Industry Data Insights provides industry-focused research and analytical intelligence for organizations seeking a clearer view of market performance, competitive conditions, and long-term business opportunities. Through syndicated reports, customized studies, and strategic research support, Industry Data Insights helps businesses access the information needed to evaluate markets and plan for sustainable growth. Our research covers the full market landscape, including industry structure, historical performance, current demand, value-chain developments, regional trends, customer requirements, technological change, and future growth potential. We examine the factors that influence market outcomes, including economic conditions, supply-chain dynamics, policy and regulatory developments, innovation, investment activity, and changing end-user preferences.
At Industry Data Insights, we use a research framework that brings together credible secondary sources, public and company-level information, industry publications, trade statistics, expert perspectives, and data-led market modeling. Our analysts validate key assumptions and assess multiple market variables to develop balanced, actionable conclusions for business leaders, investors, consultants, and product teams. Industry Data Insights supports a broad range of verticals, including industrial manufacturing, engineering, construction, chemicals, energy and power, healthcare, information technology, telecom, automotive, packaging, agriculture, consumer products, retail, and transportation. Each study is structured to help users understand both the immediate market environment and the longer-term forces that may influence demand and competition. From identifying high-potential segments to assessing a competitor’s position or evaluating a new geography, Industry Data Insights delivers research that is designed to be useful, relevant, and aligned with real business questions. Our goal is to turn industry data into strategic direction.
2 Way Foley Catheter Market Report: Size, Share & Forecast
2 Way Foley Catheter Market Report by Material (Silicone, Latex), by Indication (Urinary Incontinence, Benign Prostatic Hyperplasia, Spinal Cord Injury, Prostate Cancer, Urolithiasis, Others), by Usage (Short-term, Long-term), by End Use (Hospitals, Long-term Care, Ambulatory Surgery Centers, Home Care), by North America (USA, Canada, Mexico), by Europe (Germany, UK, France, Italy, Spain), by Asia Pacific (China, Japan, India, South Korea, Australia), by Latin America (Brazil, Mexico, Argentina), by Middle East & Africa (Saudi Arabia, UAE, South Africa) Forecast 2026-2034
2 Way Foley Catheter Market Report: Size, Share & Forecast
Discover the Latest Market Insight Reports
Access in-depth insights on industries, companies, trends, and global markets. Our expertly curated reports provide the most relevant data and analysis in a condensed, easy-to-read format.
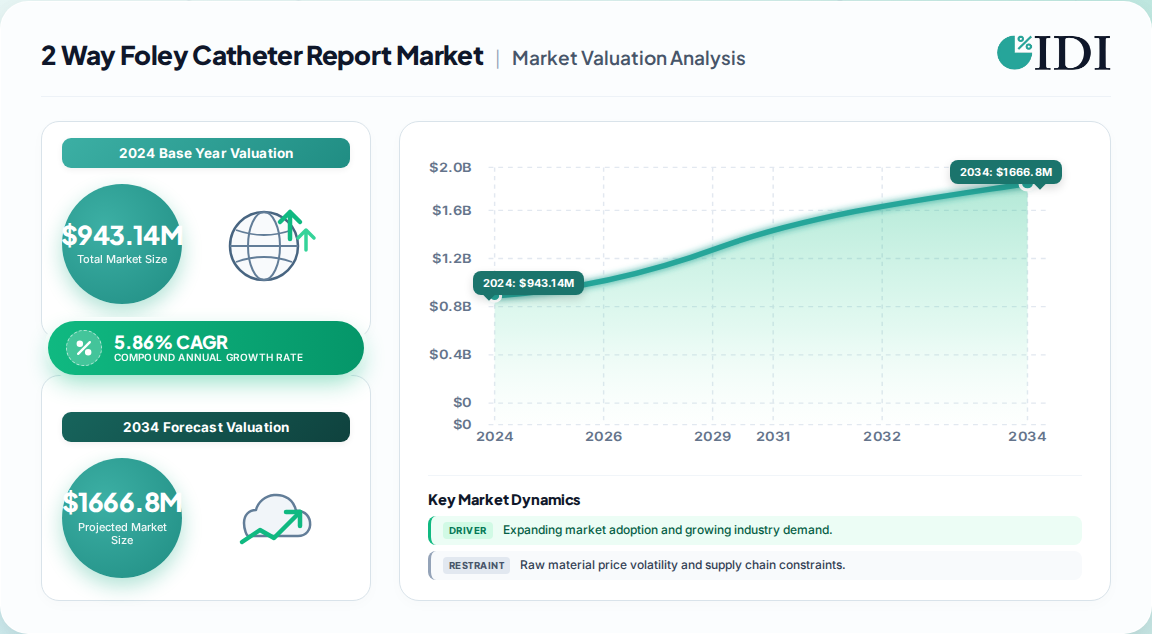
The global 2-way Foley catheter market was estimated at USD 943.14 million in 2024 and is projected to reach approximately USD 1.33 billion by 2030. All figures global unless otherwise noted.
Growth runs at a 5.86% CAGR from 2025 to 2030, driven by urological disease burden, surgical volumes and material migration.
Silicone captured the largest material share in 2024; latex remains the fastest-growing material on a cost-driven baseline.
Urinary incontinence led indications at roughly 33.51% of revenue; spinal cord injury is the fastest-growing indication.
North America and Europe dominate value; Asia-Pacific carries the highest growth trajectory on hospital capacity build-out.
Leading vendors include Teleflex, Cardinal Health, B. Braun, Coloplast, Medline and ConvaTec, with moderate consolidation.
Why this matters for decision-makers: Material mix, not volume, now determines revenue capture. Buyers shifting to silicone and coated latex will lift average selling prices and margin pools, so suppliers must align portfolios and tender strategies to that migration or risk commoditization.
2 Way Foley Catheter Market Report Market Size (In Million)
1.5B
1.0B
500.0M
0
943.0 M
2024
998.0 M
2025
1.060 B
2026
1.120 B
2027
1.180 B
2028
1.250 B
2029
1.330 B
2030
2 Way Foley Catheter Market Report Market Size (In Million)
Year
Market Size
2024
943.0 M
2025
998.0 M
2026
1.060 B
2027
1.120 B
2028
1.180 B
2029
1.250 B
2030
1.330 B
What is the 2 Way Foley Catheter Market Report?
The 2 Way Foley Catheter Market Report is an analytical study of indwelling urinary catheters with two lumens—one for drainage, one for balloon inflation—covering silicone and latex materials, clinical indications, usage duration, end-use settings and regional demand. It quantifies market size, growth and vendor structure for procurement and investment decisions.
Scope: what this report covers and excludes
This report covers two-lumen Foley catheters across material (silicone, latex), indication (urinary incontinence, benign prostatic hyperplasia, spinal cord injury, prostate cancer, urolithiasis and others), usage duration, end use (hospitals, long-term care, ambulatory surgery centers, home care) and all major regions. This analysis does not cover three-way or four-way catheters, intermittent or external catheters, ureteral stents, or non-Foley drainage devices.
How big is the market for 2 Way Foley Catheter Market Report?
The most defensible base valuation is USD 943.14 million for 2024 on a 5.86% CAGR to 2030, implying roughly USD 1.33 billion at the horizon. Broader Foley catheter estimates include two-, three- and four-lumen devices and therefore read materially higher.
Estimate
Base year
Horizon
CAGR
Definition / scope
Attribution
USD 943.14 million
2024
2030
5.86%
Two-lumen Foley catheters only, global
One published estimate
USD 1.9 billion to USD 3.0 billion
2025 to 2033
2033
5.6%
All Foley catheters including multi-lumen
A competing analysis
USD 3.36 billion to USD 5.64 billion
2025 to 2035
2035
5.38%
Full Foley catheter category including coated variants
A competing analysis
Our analysis suggests the two-lumen figure is the correct planning base for buyers and suppliers focused on standard indwelling drainage, while the broader numbers are useful only as category context. The gap between estimates is definitional, not a signal of disagreement on direction. Notably, the CAGR spread (5.38% to 5.86%) is narrow, which strengthens confidence in the growth trajectory even as absolute values diverge.
How is the market segmented?
Segmentation follows four non-geographic axes: material, indication, usage duration and end use. Material and indication carry the greatest commercial weight because they drive pricing and formulary decisions.
Hospitals, Long-term care, Ambulatory surgery centers, Home care
Silicone held the largest material share in 2024 on comfort, latex-free protocols and lower encrustation risk. Latex is expected to grow fastest, supported by cost-sensitive tenders and thermo-sensitive flexibility. Medium sizes (12–18 Fr) dominate volume because they cover the majority of adult transurethral drainage.
Which region leads in 2 Way Foley Catheter Market Report?
North America leads the global two-way Foley catheter market, supported by high per-capita device use, strict infection surveillance and penalty-linked reimbursement. Europe follows with mature demand shaped by regulation, while Asia-Pacific is the fastest-growing region as hospital capacity expands.
2 Way Foley Catheter Market Report Regional Market Share
Loading chart...
2 Way Foley Catheter Market Report Regional Market Share
Region
Market Share (%)
North America
0.33%
Europe
0.26%
Asia-Pacific
0.3%
Latin America
0.06%
Middle East & Africa
0.05%
North America (USA, Canada, Mexico)
USA
Canada
Mexico
Europe (Germany, UK, France, Italy, Spain, Rest of Europe)
Germany
UK
France
Italy
Spain
Asia Pacific (China, Japan, India, South Korea, Australia)
China
Japan
India
South Korea
Latin America (Brazil, Mexico, Argentina)
Middle East & Africa (Saudi Arabia, UAE, South Africa)
Region
Share
North America
33%
Europe
26%
Asia-Pacific
30%
Latin America
6%
Middle East & Africa
5%
The regional tree matters because procurement authority is local even when manufacturing is global. Our analysis suggests Asia-Pacific will absorb the largest incremental volume through 2030, but North America will retain the highest value per catheter due to silicone mix and infection-control specifications.
What is driving growth — and what is holding it back?
Growth is anchored by demographics and disease burden, while restraint comes from catheter-avoidance protocols and tender price pressure. The net balance favors volume expansion, but margin capture depends on material mix.
Factor
Direction
Evidence strength
Mechanism
Aging population and rising BPH burden
Driver
High
Chronic retention and post-surgical drainage drive repeat catheter use
CAUTI penalty and surveillance programs
Driver
High
Avoided penalties justify premium coated and silicone devices
Shift to silicone and latex-free materials
Driver
Medium
Lifts average selling prices and formulary review cycles
The balance of evidence favors continued expansion. BPH prevalence has risen sharply over three decades, and roughly 15% to 25% of hospitalized patients receive a urinary catheter during their stay. Against that, early-removal protocols are real and measurable. The implication is that volume growth will be slower than disease growth, but value growth will outpace volume as silicone penetration rises.
Who are the leading vendors?
Leading vendors are diversified device manufacturers with broad catheter portfolios, global distribution and strong tender relationships. Differentiation rests on material science, coating technology and infection-control evidence rather than basic catheter design.
Company
Portfolio focus
Differentiation
Teleflex
Urology and critical care
Broad catalog and clinical education
Cardinal Health
Distributed medical consumables
Scale and hospital channel access
B. Braun
catheter systems and infusion
Vertical integration and quality systems
Coloplast
Urology and continence care
Specialty focus and patient-centric design
Medline
Private-label and branded supplies
Supply-chain breadth and pricing flexibility
ConvaTec
Continence and wound care
Chronic-care channel strength
Competitive moats are built on regulatory approvals, coating intellectual property and group purchasing organization contracts. Our analysis suggests mid-tier vendors can compete on coated-latex intermediates, where price sensitivity is lower than plain latex but silicone conversion is not yet complete.
What do buyers and operators need to know?
Buyers should prioritize material compatibility, coating evidence and closed-system integration over unit price alone. Catheter-associated urinary tract infection adds an estimated USD 13,793 per event, far exceeding the price differential between plain latex and silicone devices, so total cost of care should govern formulary decisions.
Procurement risk concentrates in supply continuity and regulatory status. EU MDR compliance and ethylene oxide sterilization rules can delay product availability, and single-source tenders create exposure. Switching costs are moderate: clinical training, inventory reconfiguration and formulary approval take time, but catheter design is standardized enough that switching is feasible when quality evidence is strong.
Operators in long-term and home care should favor silicone for dwell duration and encrustation resistance. Hospitals with penalty exposure should weigh antimicrobial and hydrophilic coatings against avoided infection costs. Our analysis suggests the most common procurement error is optimizing unit price while ignoring dwell-related complication costs.
Strategic Recommendations & Analyst Perspective
The balance of evidence favors a value-growth story rather than a volume-growth story. The 5.86% CAGR is credible, but the composition matters more than the headline: silicone and coated-latex migration will outpace plain latex demand, and buyers are increasingly evaluating catheters on infection-avoidance economics rather than unit price.
The strongest counter-argument is that catheter-avoidance protocols and early-removal initiatives could suppress consumption faster than demographics expand it. That risk is real in mature Western systems, but it is offset in Asia-Pacific, where hospital capacity build-out and insurance expansion are adding treated patients. On balance, we judge the avoidance effect as a mix-shifter rather than a demand-killer.
Suppliers should build coated-latex and silicone capacity ahead of tender specifications, because formulary reviews reward evidence before price.
Investors should weight vendors by silicone portfolio share and infection-control evidence, not by raw catheter volume.
Operators should adopt total-cost-of-care procurement models that price CAUTI avoidance into device selection.
What would change our conclusion: a sustained decline in catheterization rates across North America and Europe, or a regulatory action that sharply raises silicone costs and reverses the material migration. Absent those signals, the value-growth thesis holds.
2 Way Foley Catheter Market Report Regional Market Share
Higher Coverage
Lower Coverage
No Coverage
2 Way Foley Catheter Market Report REPORT HIGHLIGHTS
Research Methodology & Data Sources
Our rigorous research methodology combines multi-layered approaches with comprehensive quality assurance, ensuring precision, accuracy, and reliability in every market analysis.
Primary Research & Industry Fieldwork
Our research applies a 70/30 primary-to-secondary split. In-depth interviews were conducted across the value chain with raw material and silicone suppliers, specialized catheter producers, contract coating and sterilization partners, and global distributors. Decision-makers interviewed included VP-level sourcing executives, heads of R&D, technical directors and commercial operations leads, ensuring both clinical and procurement perspectives inform the sizing.
Key Stakeholders Interviewed
Key Stakeholders Interviewed
Stakeholder Role
Interview Share (%)
VP Sourcing & Procurement Leads
35%
Heads of R&D
25%
Technical Directors
25%
Commercial Operations Leads
15%
Industry Ecosystem Breakdown
Industry Ecosystem Breakdown
Company Type
Representation (%)
Raw Material & Silicone Suppliers
30%
Specialized Catheter Producers
40%
Coating & Sterilization Partners
15%
Global Distributors
15%
Secondary Benchmarking & Public Trade Validation
We validate primary findings against official multilateral trade and standards databases including UN Comtrade, WTO tariff data, US ITC records and Eurostat, alongside corporate annual filings (10-K and investor presentations), patent databases and recognized technical standards bodies. This triangulation anchors vendor capacity and pricing assumptions to auditable public records rather than unverified estimates.
Demand Modeling & Market Sizing Triangulation
Sizing combines top-down macroeconomic and segment allocation with bottom-up manufacturer capacity, product pricing and end-use consumption modeling. Catheterization rates by care setting, surgical volumes and average selling prices are modeled separately by region, then reconciled to a single consensus base year.
Data Triangulation & Validation Matrix
Dimension
Analytical Scope
Methodology Applied
Validation Level
Base-Year Market Size
Value in USD for base year
Bottom-up production and revenue triangulation
High
Forecast Horizon
Multi-year compound projection
Historical CAGR, regression analysis and demand elasticity
High
Regional Distribution
Regional share breakdown
Cross-border trade flow analysis and regional consumption
High
Competitive Landscape
Leading market players
Annual reports, capacity mapping and commercial filings
High
Sources Referenced
US Food and Drug Administration (FDA) device guidance and 510(k) records
EU Medical Device Regulation (MDR) conformity databases
UN Comtrade and WTO trade statistics
CDC National Healthcare Safety Network CAUTI surveillance data
Aspects
Details
Study Period
2020-2034
Base Year
2025
Estimated Year
2026
Forecast Period
2026-2034
Historical Period
2020-2025
Growth Rate
CAGR of 5.86% from 2020-2034
Segmentation
By Material
Silicone
Latex
By Indication
Urinary Incontinence
Benign Prostatic Hyperplasia
Spinal Cord Injury
Prostate Cancer
Urolithiasis
Others
By Usage
Short-term
Long-term
By End Use
Hospitals
Long-term Care
Ambulatory Surgery Centers
Home Care
By Geography
North America
USA
Canada
Mexico
Europe
Germany
UK
France
Italy
Spain
Asia Pacific
China
Japan
India
South Korea
Australia
Latin America
Brazil
Mexico
Argentina
Middle East & Africa
Saudi Arabia
UAE
South Africa
Table of Contents
1. 2 Way Foley Catheter Market Report Introduction
1.1. Research Scope
1.2. Market Segmentation
1.3. Research Objective
1.4. Definitions and Assumptions
2. 2 Way Foley Catheter Market Report Executive Summary
2.1. Market Snapshot
3. 2 Way Foley Catheter Market Report Dynamics
3.1. Introduction
3.2. Market Drivers
3.3. Market Restrains
3.4. Market Trends
4. 2 Way Foley Catheter Market Report Factor Analysis
4.1. Porters Five Forces
4.1.1. Bargaining Power of Suppliers
4.1.2. Bargaining Power of Buyers
4.1.3. Threat of New Entrants
4.1.4. Threat of Substitutes
4.1.5. Competitive Rivalry
4.2. PESTEL analysis
4.3. BCG Analysis
4.3.1. Stars (High Growth, High Market Share)
4.3.2. Cash Cows (Low Growth, High Market Share)
4.3.3. Question Mark (High Growth, Low Market Share)
4.3.4. Dogs (Low Growth, Low Market Share)
4.4. Ansoff Matrix Analysis
4.5. Supply Chain Analysis
4.6. Regulatory Landscape
4.7. Current Market Potential and Opportunity Assessment (TAM–SAM–SOM Framework)
4.8. IDI Analyst Note
5. 2 Way Foley Catheter Market Report Analysis, Insights and Forecast, 2020-2034
5.1. Analysis, Insights and Forecast - by Material
5.1.1. Silicone
5.1.2. Latex
5.2. Analysis, Insights and Forecast - by Indication
5.2.1. Urinary Incontinence
5.2.2. Benign Prostatic Hyperplasia
5.2.3. Spinal Cord Injury
5.2.4. Prostate Cancer
5.2.5. Urolithiasis
5.2.6. Others
5.3. Analysis, Insights and Forecast - by Usage
5.3.1. Short-term
5.3.2. Long-term
5.4. Analysis, Insights and Forecast - by End Use
5.4.1. Hospitals
5.4.2. Long-term Care
5.4.3. Ambulatory Surgery Centers
5.4.4. Home Care
5.5. Analysis, Insights and Forecast - by Region
5.5.1. North America
5.5.2. Europe
5.5.3. Asia Pacific
5.5.4. Latin America
5.5.5. Middle East & Africa
6. 2 Way Foley Catheter Market Report North America Analysis, Insights and Forecast, 2020-2034
6.1. Analysis, Insights and Forecast - by Material
6.1.1. Silicone
6.1.2. Latex
6.2. Analysis, Insights and Forecast - by Indication
6.2.1. Urinary Incontinence
6.2.2. Benign Prostatic Hyperplasia
6.2.3. Spinal Cord Injury
6.2.4. Prostate Cancer
6.2.5. Urolithiasis
6.2.6. Others
6.3. Analysis, Insights and Forecast - by Usage
6.3.1. Short-term
6.3.2. Long-term
6.4. Analysis, Insights and Forecast - by End Use
6.4.1. Hospitals
6.4.2. Long-term Care
6.4.3. Ambulatory Surgery Centers
6.4.4. Home Care
7. 2 Way Foley Catheter Market Report Europe Analysis, Insights and Forecast, 2020-2034
7.1. Analysis, Insights and Forecast - by Material
7.1.1. Silicone
7.1.2. Latex
7.2. Analysis, Insights and Forecast - by Indication
7.2.1. Urinary Incontinence
7.2.2. Benign Prostatic Hyperplasia
7.2.3. Spinal Cord Injury
7.2.4. Prostate Cancer
7.2.5. Urolithiasis
7.2.6. Others
7.3. Analysis, Insights and Forecast - by Usage
7.3.1. Short-term
7.3.2. Long-term
7.4. Analysis, Insights and Forecast - by End Use
7.4.1. Hospitals
7.4.2. Long-term Care
7.4.3. Ambulatory Surgery Centers
7.4.4. Home Care
8. 2 Way Foley Catheter Market Report Asia Pacific Analysis, Insights and Forecast, 2020-2034
8.1. Analysis, Insights and Forecast - by Material
8.1.1. Silicone
8.1.2. Latex
8.2. Analysis, Insights and Forecast - by Indication
8.2.1. Urinary Incontinence
8.2.2. Benign Prostatic Hyperplasia
8.2.3. Spinal Cord Injury
8.2.4. Prostate Cancer
8.2.5. Urolithiasis
8.2.6. Others
8.3. Analysis, Insights and Forecast - by Usage
8.3.1. Short-term
8.3.2. Long-term
8.4. Analysis, Insights and Forecast - by End Use
8.4.1. Hospitals
8.4.2. Long-term Care
8.4.3. Ambulatory Surgery Centers
8.4.4. Home Care
9. 2 Way Foley Catheter Market Report Latin America Analysis, Insights and Forecast, 2020-2034
9.1. Analysis, Insights and Forecast - by Material
9.1.1. Silicone
9.1.2. Latex
9.2. Analysis, Insights and Forecast - by Indication
9.2.1. Urinary Incontinence
9.2.2. Benign Prostatic Hyperplasia
9.2.3. Spinal Cord Injury
9.2.4. Prostate Cancer
9.2.5. Urolithiasis
9.2.6. Others
9.3. Analysis, Insights and Forecast - by Usage
9.3.1. Short-term
9.3.2. Long-term
9.4. Analysis, Insights and Forecast - by End Use
9.4.1. Hospitals
9.4.2. Long-term Care
9.4.3. Ambulatory Surgery Centers
9.4.4. Home Care
10. 2 Way Foley Catheter Market Report Middle East & Africa Analysis, Insights and Forecast, 2020-2034
10.1. Analysis, Insights and Forecast - by Material
10.1.1. Silicone
10.1.2. Latex
10.2. Analysis, Insights and Forecast - by Indication
10.2.1. Urinary Incontinence
10.2.2. Benign Prostatic Hyperplasia
10.2.3. Spinal Cord Injury
10.2.4. Prostate Cancer
10.2.5. Urolithiasis
10.2.6. Others
10.3. Analysis, Insights and Forecast - by Usage
10.3.1. Short-term
10.3.2. Long-term
10.4. Analysis, Insights and Forecast - by End Use
10.4.1. Hospitals
10.4.2. Long-term Care
10.4.3. Ambulatory Surgery Centers
10.4.4. Home Care
11. 2 Way Foley Catheter Market Report Competitive Analysis
11.1. Company Profiles
11.2. Market Entropy
11.2.1. Company's Key Areas Served
11.2.2. Recent Developments
11.3. Company Market Share Analysis, 2026
11.3.1. Top 5 Companies Market Share Analysis
11.3.2. Top 3 Companies Market Share Analysis
11.4. List of Potential Customers
12. 2 Way Foley Catheter Market Report Research Methodology
List of Figures
Figure 1: 2 Way Foley Catheter Market Report Revenue Breakdown (Million, %) by Region 2026 & 2034
Figure 2: North America 2 Way Foley Catheter Market Report Revenue (Million), by Material 2026 & 2034
Figure 3: North America 2 Way Foley Catheter Market Report Revenue Share (%), by Material 2026 & 2034
Figure 4: North America 2 Way Foley Catheter Market Report Revenue (Million), by Indication 2026 & 2034
Figure 5: North America 2 Way Foley Catheter Market Report Revenue Share (%), by Indication 2026 & 2034
Figure 6: North America 2 Way Foley Catheter Market Report Revenue (Million), by Usage 2026 & 2034
Figure 7: North America 2 Way Foley Catheter Market Report Revenue Share (%), by Usage 2026 & 2034
Figure 8: North America 2 Way Foley Catheter Market Report Revenue (Million), by End Use 2026 & 2034
Figure 9: North America 2 Way Foley Catheter Market Report Revenue Share (%), by End Use 2026 & 2034
Figure 10: North America 2 Way Foley Catheter Market Report Revenue (Million), by Country 2026 & 2034
Figure 11: North America 2 Way Foley Catheter Market Report Revenue Share (%), by Country 2026 & 2034
Figure 12: Europe 2 Way Foley Catheter Market Report Revenue (Million), by Material 2026 & 2034
Figure 13: Europe 2 Way Foley Catheter Market Report Revenue Share (%), by Material 2026 & 2034
Figure 14: Europe 2 Way Foley Catheter Market Report Revenue (Million), by Indication 2026 & 2034
Figure 15: Europe 2 Way Foley Catheter Market Report Revenue Share (%), by Indication 2026 & 2034
Europe 2 Way Foley Catheter Market Report Revenue (Million), by Usage 2026 & 2034
List of Tables
Table 1: 2 Way Foley Catheter Market Report Revenue Million Forecast, by Material 2020 & 2034
Table 2: 2 Way Foley Catheter Market Report Revenue Million Forecast, by Indication 2020 & 2034
Table 3: 2 Way Foley Catheter Market Report Revenue Million Forecast, by Usage 2020 & 2034
Table 4: 2 Way Foley Catheter Market Report Revenue Million Forecast, by End Use 2020 & 2034
Table 5: 2 Way Foley Catheter Market Report Revenue Million Forecast, by Region 2020 & 2034
Table 6: North America 2 Way Foley Catheter Market Report Revenue Million Forecast, by Material 2020 & 2034
Table 7: North America 2 Way Foley Catheter Market Report Revenue Million Forecast, by Indication 2020 & 2034
Table 8: North America 2 Way Foley Catheter Market Report Revenue Million Forecast, by Usage 2020 & 2034
Table 9: North America 2 Way Foley Catheter Market Report Revenue Million Forecast, by End Use 2020 & 2034
Table 10: North America 2 Way Foley Catheter Market Report Revenue Million Forecast, by Country 2020 & 2034
Table 11: USA 2 Way Foley Catheter Market Report Revenue (Million) Forecast, by Application 2020 & 2034
Table 12: Canada 2 Way Foley Catheter Market Report Revenue (Million) Forecast, by Application 2020 & 2034
Table 13: Mexico 2 Way Foley Catheter Market Report Revenue (Million) Forecast, by Application 2020 & 2034
Table 14: Europe 2 Way Foley Catheter Market Report Revenue Million Forecast, by Material 2020 & 2034
Table 15: Europe 2 Way Foley Catheter Market Report Revenue Million Forecast, by Indication 2020 & 2034
Europe 2 Way Foley Catheter Market Report Revenue Million Forecast, by Usage 2020 & 2034
Frequently Asked Questions
1. What is the 2-way Foley catheter market size?
The global market was estimated at USD 943.14 million in 2024 and is projected to reach approximately USD 1.33 billion by 2030 at a 5.86% CAGR, based on one published estimate.
2. Which material leads the 2-way Foley catheter market?
Silicone held the largest share in 2024 due to comfort, latex-free protocols and lower encrustation risk, while latex is expected to grow fastest on cost-sensitive demand.
3. Which region grows fastest in the 2-way Foley catheter market?
Asia-Pacific is the fastest-growing region, driven by hospital capacity expansion and rising urological disease burden in China and India.
4. Who are the leading 2-way Foley catheter vendors?
Teleflex, Cardinal Health, B. Braun, Coloplast, Medline and ConvaTec lead, competing on material science, coatings and tender access.
5. What is driving 2-way Foley catheter demand?
Aging populations, rising BPH and urological disease burden, surgical volumes and CAUTI penalty programs that reward premium devices.
6. What limits 2-way Foley catheter market growth?
Catheter-avoidance protocols, early-removal initiatives, tender price pressure and EU MDR compliance costs restrain volume and margin.
7. Why buy the full 2-way Foley catheter report?
The full report provides segment-level forecasts, vendor benchmarking, procurement risk matrices and regional deep dives needed to execute strategy with confidence.
Figure 16:
Figure 17: Europe 2 Way Foley Catheter Market Report Revenue Share (%), by Usage 2026 & 2034
Figure 18: Europe 2 Way Foley Catheter Market Report Revenue (Million), by End Use 2026 & 2034
Figure 19: Europe 2 Way Foley Catheter Market Report Revenue Share (%), by End Use 2026 & 2034
Figure 20: Europe 2 Way Foley Catheter Market Report Revenue (Million), by Country 2026 & 2034
Figure 21: Europe 2 Way Foley Catheter Market Report Revenue Share (%), by Country 2026 & 2034
Figure 22: Asia Pacific 2 Way Foley Catheter Market Report Revenue (Million), by Material 2026 & 2034
Figure 23: Asia Pacific 2 Way Foley Catheter Market Report Revenue Share (%), by Material 2026 & 2034
Figure 24: Asia Pacific 2 Way Foley Catheter Market Report Revenue (Million), by Indication 2026 & 2034
Figure 25: Asia Pacific 2 Way Foley Catheter Market Report Revenue Share (%), by Indication 2026 & 2034
Figure 26: Asia Pacific 2 Way Foley Catheter Market Report Revenue (Million), by Usage 2026 & 2034
Figure 27: Asia Pacific 2 Way Foley Catheter Market Report Revenue Share (%), by Usage 2026 & 2034
Figure 28: Asia Pacific 2 Way Foley Catheter Market Report Revenue (Million), by End Use 2026 & 2034
Figure 29: Asia Pacific 2 Way Foley Catheter Market Report Revenue Share (%), by End Use 2026 & 2034
Figure 30: Asia Pacific 2 Way Foley Catheter Market Report Revenue (Million), by Country 2026 & 2034
Figure 31: Asia Pacific 2 Way Foley Catheter Market Report Revenue Share (%), by Country 2026 & 2034
Figure 32: Latin America 2 Way Foley Catheter Market Report Revenue (Million), by Material 2026 & 2034
Figure 33: Latin America 2 Way Foley Catheter Market Report Revenue Share (%), by Material 2026 & 2034
Figure 34: Latin America 2 Way Foley Catheter Market Report Revenue (Million), by Indication 2026 & 2034
Figure 35: Latin America 2 Way Foley Catheter Market Report Revenue Share (%), by Indication 2026 & 2034
Figure 36: Latin America 2 Way Foley Catheter Market Report Revenue (Million), by Usage 2026 & 2034
Figure 37: Latin America 2 Way Foley Catheter Market Report Revenue Share (%), by Usage 2026 & 2034
Figure 38: Latin America 2 Way Foley Catheter Market Report Revenue (Million), by End Use 2026 & 2034
Figure 39: Latin America 2 Way Foley Catheter Market Report Revenue Share (%), by End Use 2026 & 2034
Figure 40: Latin America 2 Way Foley Catheter Market Report Revenue (Million), by Country 2026 & 2034
Figure 41: Latin America 2 Way Foley Catheter Market Report Revenue Share (%), by Country 2026 & 2034
Figure 42: Middle East & Africa 2 Way Foley Catheter Market Report Revenue (Million), by Material 2026 & 2034
Figure 43: Middle East & Africa 2 Way Foley Catheter Market Report Revenue Share (%), by Material 2026 & 2034
Figure 44: Middle East & Africa 2 Way Foley Catheter Market Report Revenue (Million), by Indication 2026 & 2034
Figure 45: Middle East & Africa 2 Way Foley Catheter Market Report Revenue Share (%), by Indication 2026 & 2034
Figure 46: Middle East & Africa 2 Way Foley Catheter Market Report Revenue (Million), by Usage 2026 & 2034
Figure 47: Middle East & Africa 2 Way Foley Catheter Market Report Revenue Share (%), by Usage 2026 & 2034
Figure 48: Middle East & Africa 2 Way Foley Catheter Market Report Revenue (Million), by End Use 2026 & 2034
Figure 49: Middle East & Africa 2 Way Foley Catheter Market Report Revenue Share (%), by End Use 2026 & 2034
Figure 50: Middle East & Africa 2 Way Foley Catheter Market Report Revenue (Million), by Country 2026 & 2034
Figure 51: Middle East & Africa 2 Way Foley Catheter Market Report Revenue Share (%), by Country 2026 & 2034
Table 16:
Table 17: Europe 2 Way Foley Catheter Market Report Revenue Million Forecast, by End Use 2020 & 2034
Table 18: Europe 2 Way Foley Catheter Market Report Revenue Million Forecast, by Country 2020 & 2034
Table 19: Germany 2 Way Foley Catheter Market Report Revenue (Million) Forecast, by Application 2020 & 2034
Table 20: UK 2 Way Foley Catheter Market Report Revenue (Million) Forecast, by Application 2020 & 2034
Table 21: France 2 Way Foley Catheter Market Report Revenue (Million) Forecast, by Application 2020 & 2034
Table 22: Italy 2 Way Foley Catheter Market Report Revenue (Million) Forecast, by Application 2020 & 2034
Table 23: Spain 2 Way Foley Catheter Market Report Revenue (Million) Forecast, by Application 2020 & 2034
Table 24: Asia Pacific 2 Way Foley Catheter Market Report Revenue Million Forecast, by Material 2020 & 2034
Table 25: Asia Pacific 2 Way Foley Catheter Market Report Revenue Million Forecast, by Indication 2020 & 2034
Table 26: Asia Pacific 2 Way Foley Catheter Market Report Revenue Million Forecast, by Usage 2020 & 2034
Table 27: Asia Pacific 2 Way Foley Catheter Market Report Revenue Million Forecast, by End Use 2020 & 2034
Table 28: Asia Pacific 2 Way Foley Catheter Market Report Revenue Million Forecast, by Country 2020 & 2034
Table 29: China 2 Way Foley Catheter Market Report Revenue (Million) Forecast, by Application 2020 & 2034
Table 30: Japan 2 Way Foley Catheter Market Report Revenue (Million) Forecast, by Application 2020 & 2034
Table 31: India 2 Way Foley Catheter Market Report Revenue (Million) Forecast, by Application 2020 & 2034
Table 32: South Korea 2 Way Foley Catheter Market Report Revenue (Million) Forecast, by Application 2020 & 2034
Table 33: Australia 2 Way Foley Catheter Market Report Revenue (Million) Forecast, by Application 2020 & 2034
Table 34: Latin America 2 Way Foley Catheter Market Report Revenue Million Forecast, by Material 2020 & 2034
Table 35: Latin America 2 Way Foley Catheter Market Report Revenue Million Forecast, by Indication 2020 & 2034
Table 36: Latin America 2 Way Foley Catheter Market Report Revenue Million Forecast, by Usage 2020 & 2034
Table 37: Latin America 2 Way Foley Catheter Market Report Revenue Million Forecast, by End Use 2020 & 2034
Table 38: Latin America 2 Way Foley Catheter Market Report Revenue Million Forecast, by Country 2020 & 2034
Table 39: Brazil 2 Way Foley Catheter Market Report Revenue (Million) Forecast, by Application 2020 & 2034
Table 40: Mexico 2 Way Foley Catheter Market Report Revenue (Million) Forecast, by Application 2020 & 2034
Table 41: Argentina 2 Way Foley Catheter Market Report Revenue (Million) Forecast, by Application 2020 & 2034
Table 42: Middle East & Africa 2 Way Foley Catheter Market Report Revenue Million Forecast, by Material 2020 & 2034
Table 43: Middle East & Africa 2 Way Foley Catheter Market Report Revenue Million Forecast, by Indication 2020 & 2034
Table 44: Middle East & Africa 2 Way Foley Catheter Market Report Revenue Million Forecast, by Usage 2020 & 2034
Table 45: Middle East & Africa 2 Way Foley Catheter Market Report Revenue Million Forecast, by End Use 2020 & 2034
Table 46: Middle East & Africa 2 Way Foley Catheter Market Report Revenue Million Forecast, by Country 2020 & 2034
Table 47: Saudi Arabia 2 Way Foley Catheter Market Report Revenue (Million) Forecast, by Application 2020 & 2034
Table 48: UAE 2 Way Foley Catheter Market Report Revenue (Million) Forecast, by Application 2020 & 2034
Table 49: South Africa 2 Way Foley Catheter Market Report Revenue (Million) Forecast, by Application 2020 & 2034