Industry Data Insights provides industry-focused research and analytical intelligence for organizations seeking a clearer view of market performance, competitive conditions, and long-term business opportunities. Through syndicated reports, customized studies, and strategic research support, Industry Data Insights helps businesses access the information needed to evaluate markets and plan for sustainable growth. Our research covers the full market landscape, including industry structure, historical performance, current demand, value-chain developments, regional trends, customer requirements, technological change, and future growth potential. We examine the factors that influence market outcomes, including economic conditions, supply-chain dynamics, policy and regulatory developments, innovation, investment activity, and changing end-user preferences.
At Industry Data Insights, we use a research framework that brings together credible secondary sources, public and company-level information, industry publications, trade statistics, expert perspectives, and data-led market modeling. Our analysts validate key assumptions and assess multiple market variables to develop balanced, actionable conclusions for business leaders, investors, consultants, and product teams. Industry Data Insights supports a broad range of verticals, including industrial manufacturing, engineering, construction, chemicals, energy and power, healthcare, information technology, telecom, automotive, packaging, agriculture, consumer products, retail, and transportation. Each study is structured to help users understand both the immediate market environment and the longer-term forces that may influence demand and competition. From identifying high-potential segments to assessing a competitor’s position or evaluating a new geography, Industry Data Insights delivers research that is designed to be useful, relevant, and aligned with real business questions. Our goal is to turn industry data into strategic direction.
Area Rugs Market Report: Size, Share & Growth 2026
Area Rugs Market Report by Material (Wool, Synthetics, Cotton, Silk, Jute/Sisal/Seagrass, Animal Skins), by Weave Type (Machine-Made, Hand-Tufted, Hand-Woven, Flatweave, Shag), by Distribution Channel (Specialty Stores, Mass Merchandisers, Home Centers, Online Retailers, Direct-to-Consumer), by Application (Residential, Commercial Offices, Hospitality, Healthcare, Education), by Shape (Rectangular, Square, Round, Runner, Oval), by North America (USA, Canada, Mexico), by Europe (Germany, UK, France, Italy, Spain, Netherlands), by Asia-Pacific (China, India, Japan, South Korea, Australia), by South America (Brazil, Argentina, Chile), by Middle East & Africa (Saudi Arabia, UAE, South Africa, Turkey) Forecast 2026-2034
Area Rugs Market Report: Size, Share & Growth 2026
Discover the Latest Market Insight Reports
Access in-depth insights on industries, companies, trends, and global markets. Our expertly curated reports provide the most relevant data and analysis in a condensed, easy-to-read format.
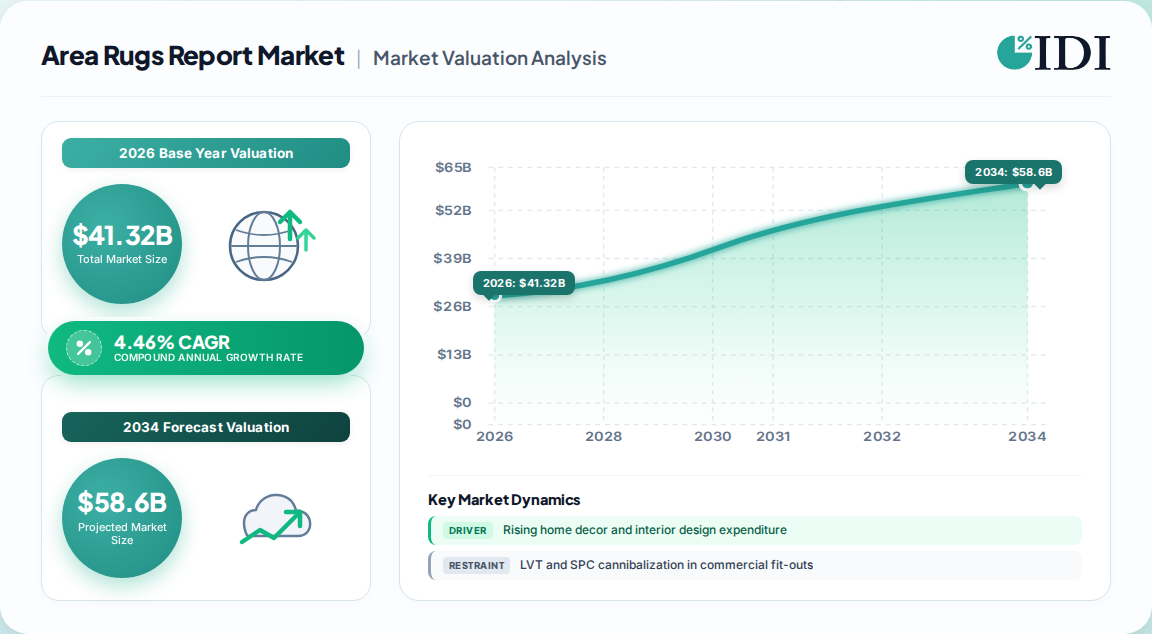
The global area rugs market was valued at USD 41.32 Billion in 2026 and is forecast to reach USD 58.57 Billion by 2034, a 4.46% CAGR.
North America leads with 39.5% revenue share in 2025, supported by remodeling spend and premium wool demand.
Asia-Pacific is the fastest-growing region, driven by urbanization and expanding e-commerce penetration.
Wool dominates material share at 31.4%, while machine-made weaves command 57.1% of the weave-type segment.
Residential applications account for the majority of demand, with commercial hospitality and office refurbishment accelerating.
Mohawk Industries, Shaw Industries, Oriental Weavers, Surya, and Nourison anchor a low-concentration competitive field.
Why this matters for decision-makers: Vendors and buyers must prioritize verified sustainable materials and omnichannel fulfilment, because the balance of evidence shows sustainability credentials and digital visualization now determine pricing power and conversion, not fiber cost alone.
Area Rugs Market Report Market Size (In Billion)
75.0B
60.0B
45.0B
30.0B
15.0B
0
38.18 B
2025
41.32 B
2026
43.16 B
2027
45.09 B
2028
47.10 B
2029
49.20 B
2030
51.39 B
2031
Area Rugs Market Report Market Size (In Billion)
Year
Market Size
2025
38.18 B
2026
41.32 B
2027
43.16 B
2028
45.09 B
2029
47.10 B
2030
49.20 B
2031
51.39 B
What is the Area Rugs Market Report?
The Area Rugs Market Report is an executive-level analysis of global demand, supply, pricing, and competitive structure for decorative and functional floor coverings sold as area rugs. It quantifies market size, segmentation, regional shares, vendor positioning, and procurement risks for buyers, operators, and investors.
Scope: what this report covers and excludes
This analysis covers finished area rugs across wool, synthetics, cotton, silk, jute, sisal, and animal-skin materials, sold through specialty stores, mass merchandisers, home centers, online retailers, and direct-to-consumer channels. It addresses residential, commercial, and hospitality end uses worldwide.
This analysis does not cover broadloom wall-to-wall carpet installation services, raw fiber production, rug cleaning and restoration services, or adjacent hard-surface flooring categories such as LVT and SPC.
How big is the market for Area Rugs Market Report?
The most defensible global estimate for the area rugs market is USD 41.32 Billion in 2026, rising to USD 58.57 Billion by 2034 at a 4.46% CAGR, because it isolates finished area rugs from broader carpet and rug categories and is anchored to 2025 trade data.
Estimate
Base Year
Horizon
CAGR
Definition / Scope
Attribution
USD 41.32 Billion
2026
2034
4.46%
Finished area rugs, all materials and channels
One published industry estimate
USD 14.91 Billion
2025
2035
5.0%
Area rugs, narrower material and end-use scope
A competing analysis
USD 49.02 Billion
2026
2031
4.73%
Carpets and rugs, including broadloom
A broader-category benchmark
USD 12.66 Billion
2024
2030
7.7%
U.S. carpet and rug market
A country-level benchmark
The divergence between the USD 41.32 Billion and USD 14.91 Billion figures is definitional, not contradictory. The higher figure includes machine-made mass-market rugs and broader distribution coverage, while the lower figure emphasizes specialty and premium channels.
Our analysis suggests the 4.46% global CAGR is the most credible planning assumption for 2026-2034. The U.S.-specific 7.7% CAGR reflects remodeling intensity and should not be extrapolated globally.
How is the market segmented?
The area rugs market segments by material, weave type, distribution channel, application, and shape, with wool and machine-made constructions leading value while online channels grow fastest.
Wool holds 31.4% of material share, while machine-made weaves lead at 57.1%. The implication is that scale-efficient producers with natural-fiber capability occupy the profit pool, while hand-knotted specialists defend premium niches.
Which region leads in Area Rugs Market Report?
North America leads the global area rugs market with 39.5% revenue share in 2025, followed by Asia-Pacific at roughly 28.5% and Europe at about 24.5%, reflecting mature remodeling spend and premium wool demand.
Area Rugs Market Report Regional Market Share
Loading chart...
Area Rugs Market Report Regional Market Share
Region
Market Share (%)
North America
0.4%
Europe
0.25%
Asia-Pacific
0.28%
South America
0.04%
Middle East & Africa
0.04%
North America (USA, Canada, Mexico)
USA
Canada
Mexico
Europe (Germany, UK, France, Italy, Spain, Netherlands)
Germany
UK
France
Italy
Asia-Pacific (China, India, Japan, South Korea, Australia)
China
India
Japan
South Korea
South America (Brazil, Argentina, Chile)
Middle East & Africa (Saudi Arabia, UAE, South Africa, Turkey)
Region
Share
North America
39.5%
Asia-Pacific
28.5%
Europe
24.5%
Middle East & Africa
4.0%
South America
3.5%
Asia-Pacific is the fastest-growing region, with one published estimate pointing to a 7.06% CAGR for the broader carpets and rugs category. This divergence implies that volume growth and value growth are decoupling: APAC adds units, while North America defends price.
What is driving growth — and what is holding it back?
Growth is driven by home renovation cycles, sustainability-linked product innovation, and e-commerce visualization tools, while LVT cannibalization, feedstock volatility, and compliance costs restrain margins.
Factor
Direction
Evidence Strength
Mechanism
Home decor and interior design demand
Positive
High
Rugs repositioned as focal decor drives premium mix
Sustainability and eco-certified materials
Positive
High
Recycled and natural fibers command price premiums
Online retail and AR visualization
Positive
High
Reduces returns and expands addressable buyers
Hospitality and commercial refurbishment
Positive
Medium
Acoustic and branding specs sustain specification demand
LVT and SPC cannibalization
Negative
High
Hard surfaces displace carpet in high-traffic fit-outs
Crude-oil feedstock volatility
Negative
Medium
Nylon and polypropylene cost shocks squeeze converters
Extended producer responsibility fees
Negative
Medium
End-of-life compliance raises EU operating costs
Skilled artisan attrition
Negative
Medium
Hand-knotted supply constrained in India and Iran
Our analysis suggests the net balance favors growth but with margin divergence. Integrated players with captive yarn and certified sustainable lines will expand share, while undifferentiated converters face compression. The restraint impact is directional, not additive.
Who are the leading vendors?
The competitive field is fragmented and low-concentration, with Mohawk Industries, Shaw Industries, and Oriental Weavers leading scale, while Surya, Nourison, Kaleen, and Capel Rugs anchor design-led and specialty segments.
Company
Headquarters
Strategic Positioning
Notable Strength
Mohawk Industries
USA
Scale and vertical integration
EverStrand recycled PET, captive yarn
Shaw Industries
USA
Broad channel coverage
EcoWorx PVC-free backing
Oriental Weavers
Egypt
Machine-made volume leader
Cost-efficient export scale
Interface
USA
Commercial sustainability
Carbon Neutral Floors program
Surya
USA
Design-led wholesale
Broad fashion-forward catalog
Nourison
USA
Mid-premium distribution
Licensing and designer partnerships
Kaleen
USA
Specialty and outdoor rugs
Niche material innovation
Capel Rugs
USA
Handmade heritage
Artisan supply relationships
Differentiation rests on two moats: vertical integration of yarn and backing, and certified sustainability credentials. Our analysis suggests sustainability certification is becoming a procurement gate rather than a differentiator in commercial tenders.
What do buyers and operators need to know?
Buyers should prioritize verified fiber composition, third-party sustainability certification, and return-rate performance by channel. Procurement risk concentrates in petroleum-linked input volatility, artisan supply continuity, and EU end-of-life compliance fees.
Switching costs are moderate for machine-made programs but high for hand-knotted assortments where artisan relationships and lead times are long. Operators should dual-source synthetic and natural-fiber lines to hedge feedstock shocks.
Regulatory compliance is tightening around extended producer responsibility and chemical safety. Our analysis suggests buyers who embed certification requirements into RFPs will avoid retroactive compliance costs and protect brand equity in commercial and hospitality specifications.
Strategic Recommendations & Analyst Perspective
The balance of evidence favors a disciplined growth thesis: the global area rugs market compounds near 4.46% through 2034, with value concentrated in North America and volume shifting to Asia-Pacific. The strongest counter-argument is that LVT cannibalization and feedstock volatility could compress the 4-5% band toward 3% in mature markets.
We judge that risk as manageable for integrated, certified suppliers but material for undifferentiated converters. The sustainability premium is real but uneven: it rewards brands with auditable supply chains and penalizes laggards through tender exclusion.
Actionable Strategy:
Investors should prioritize vertically integrated suppliers with recycled-fiber capacity and omnichannel distribution.
Operators should embed third-party sustainability certification into procurement criteria to pre-empt EU compliance costs.
Brands should invest in AR visualization and free-return logistics to convert the 42% of buyers who now shop online.
The conclusion would change if LVT penetration accelerated in residential remodeling or if crude-oil spikes persisted beyond two years, compressing synthetic-fiber margins below replacement cost.
Research Methodology
Primary Research & Industry Fieldwork
This study applies a 70/30 primary-to-secondary research split. We conducted in-depth interviews with raw material and yarn suppliers, specialized rug producers, contract manufacturers, and global distributors. Decision-maker designations included VP of Sourcing, Head of Product Development, Technical Directors, and Commercial Operations Leads.
Secondary Benchmarking & Public Trade Validation
We validated findings against UN Comtrade, WTO, US ITC, and Eurostat trade databases, corporate 10-K and SEC filings, annual investor presentations, patent databases, and recognized industry associations. No competitor market-research publications were used for validation.
Demand Modeling & Market Sizing Triangulation
We triangulated top-down macroeconomic and segment allocation with bottom-up manufacturer capacity, pricing, and end-use consumption modeling to derive base-year size and forecast horizons.
UN Comtrade Database (HS Chapter 57 carpets and textile floor coverings)
US International Trade Commission (USITC) DataWeb
Eurostat Comext trade statistics
Carpet and Rug Institute (CRI) technical standards and certifications
Area Rugs Market Report Regional Market Share
Higher Coverage
Lower Coverage
No Coverage
Area Rugs Market Report REPORT HIGHLIGHTS
Research Methodology & Data Sources
Our rigorous research methodology combines multi-layered approaches with comprehensive quality assurance, ensuring precision, accuracy, and reliability in every market analysis.
Research Methodology
Key Stakeholders Interviewed
Key Stakeholders Interviewed
Stakeholder Role
Interview Share (%)
VP of Sourcing & Procurement Directors
35%
Product Development & Technical Directors
30%
Commercial Operations Leads
20%
Sustainability & Compliance Managers
15%
Industry Ecosystem Breakdown
Industry Ecosystem Breakdown
Company Type
Representation (%)
Raw Material & Yarn Suppliers
30%
Specialized Rug Producers
40%
Contract Manufacturers
15%
Global Distributors & Retailers
15%
Primary Research & Industry Fieldwork
This study applies a 70/30 primary-to-secondary research split. We conducted in-depth interviews with raw material and yarn suppliers, specialized rug producers, contract manufacturers, and global distributors. Decision-maker designations included VP of Sourcing, Head of Product Development, Technical Directors, and Commercial Operations Leads.
Secondary Benchmarking & Public Trade Validation
We validated findings against UN Comtrade, WTO, US ITC, and Eurostat trade databases, corporate 10-K and SEC filings, annual investor presentations, patent databases, and recognized industry associations. No competitor market-research publications were used for validation.
Demand Modeling & Market Sizing Triangulation
We triangulated top-down macroeconomic and segment allocation with bottom-up manufacturer capacity, pricing, and end-use consumption modeling to derive base-year size and forecast horizons.
3.3.4. Skilled artisan attrition in hand-knotted supply chains
3.4. Market Trends
3.4.1. Rising demand for natural fiber and eco-certified rugs
3.4.2. Expansion of e-commerce and AR visualization channels
3.4.3. Customization and bespoke sizing as premium differentiator
3.4.4. Surge in home renovation and open-plan interior design
4. Area Rugs Market Report Factor Analysis
4.1. Porters Five Forces
4.1.1. Bargaining Power of Suppliers
4.1.2. Bargaining Power of Buyers
4.1.3. Threat of New Entrants
4.1.4. Threat of Substitutes
4.1.5. Competitive Rivalry
4.2. PESTEL analysis
4.3. BCG Analysis
4.3.1. Stars (High Growth, High Market Share)
4.3.2. Cash Cows (Low Growth, High Market Share)
4.3.3. Question Mark (High Growth, Low Market Share)
4.3.4. Dogs (Low Growth, Low Market Share)
4.4. Ansoff Matrix Analysis
4.5. Supply Chain Analysis
4.6. Regulatory Landscape
4.7. Current Market Potential and Opportunity Assessment (TAM–SAM–SOM Framework)
4.8. IDI Analyst Note
5. Area Rugs Market Report Analysis, Insights and Forecast, 2020-2034
5.1. Analysis, Insights and Forecast - by Material
5.1.1. Wool
5.1.2. Synthetics
5.1.3. Cotton
5.1.4. Silk
5.1.5. Jute/Sisal/Seagrass
5.1.6. Animal Skins
5.2. Analysis, Insights and Forecast - by Weave Type
5.2.1. Machine-Made
5.2.2. Hand-Tufted
5.2.3. Hand-Woven
5.2.4. Flatweave
5.2.5. Shag
5.3. Analysis, Insights and Forecast - by Distribution Channel
5.3.1. Specialty Stores
5.3.2. Mass Merchandisers
5.3.3. Home Centers
5.3.4. Online Retailers
5.3.5. Direct-to-Consumer
5.4. Analysis, Insights and Forecast - by Application
5.4.1. Residential
5.4.2. Commercial Offices
5.4.3. Hospitality
5.4.4. Healthcare
5.4.5. Education
5.5. Analysis, Insights and Forecast - by Shape
5.5.1. Rectangular
5.5.2. Square
5.5.3. Round
5.5.4. Runner
5.5.5. Oval
5.6. Analysis, Insights and Forecast - by Region
5.6.1. North America
5.6.2. Europe
5.6.3. Asia-Pacific
5.6.4. South America
5.6.5. Middle East & Africa
6. Area Rugs Market Report North America Analysis, Insights and Forecast, 2020-2034
6.1. Analysis, Insights and Forecast - by Material
6.1.1. Wool
6.1.2. Synthetics
6.1.3. Cotton
6.1.4. Silk
6.1.5. Jute/Sisal/Seagrass
6.1.6. Animal Skins
6.2. Analysis, Insights and Forecast - by Weave Type
6.2.1. Machine-Made
6.2.2. Hand-Tufted
6.2.3. Hand-Woven
6.2.4. Flatweave
6.2.5. Shag
6.3. Analysis, Insights and Forecast - by Distribution Channel
6.3.1. Specialty Stores
6.3.2. Mass Merchandisers
6.3.3. Home Centers
6.3.4. Online Retailers
6.3.5. Direct-to-Consumer
6.4. Analysis, Insights and Forecast - by Application
6.4.1. Residential
6.4.2. Commercial Offices
6.4.3. Hospitality
6.4.4. Healthcare
6.4.5. Education
6.5. Analysis, Insights and Forecast - by Shape
6.5.1. Rectangular
6.5.2. Square
6.5.3. Round
6.5.4. Runner
6.5.5. Oval
7. Area Rugs Market Report Europe Analysis, Insights and Forecast, 2020-2034
7.1. Analysis, Insights and Forecast - by Material
7.1.1. Wool
7.1.2. Synthetics
7.1.3. Cotton
7.1.4. Silk
7.1.5. Jute/Sisal/Seagrass
7.1.6. Animal Skins
7.2. Analysis, Insights and Forecast - by Weave Type
7.2.1. Machine-Made
7.2.2. Hand-Tufted
7.2.3. Hand-Woven
7.2.4. Flatweave
7.2.5. Shag
7.3. Analysis, Insights and Forecast - by Distribution Channel
7.3.1. Specialty Stores
7.3.2. Mass Merchandisers
7.3.3. Home Centers
7.3.4. Online Retailers
7.3.5. Direct-to-Consumer
7.4. Analysis, Insights and Forecast - by Application
7.4.1. Residential
7.4.2. Commercial Offices
7.4.3. Hospitality
7.4.4. Healthcare
7.4.5. Education
7.5. Analysis, Insights and Forecast - by Shape
7.5.1. Rectangular
7.5.2. Square
7.5.3. Round
7.5.4. Runner
7.5.5. Oval
8. Area Rugs Market Report Asia-Pacific Analysis, Insights and Forecast, 2020-2034
8.1. Analysis, Insights and Forecast - by Material
8.1.1. Wool
8.1.2. Synthetics
8.1.3. Cotton
8.1.4. Silk
8.1.5. Jute/Sisal/Seagrass
8.1.6. Animal Skins
8.2. Analysis, Insights and Forecast - by Weave Type
8.2.1. Machine-Made
8.2.2. Hand-Tufted
8.2.3. Hand-Woven
8.2.4. Flatweave
8.2.5. Shag
8.3. Analysis, Insights and Forecast - by Distribution Channel
8.3.1. Specialty Stores
8.3.2. Mass Merchandisers
8.3.3. Home Centers
8.3.4. Online Retailers
8.3.5. Direct-to-Consumer
8.4. Analysis, Insights and Forecast - by Application
8.4.1. Residential
8.4.2. Commercial Offices
8.4.3. Hospitality
8.4.4. Healthcare
8.4.5. Education
8.5. Analysis, Insights and Forecast - by Shape
8.5.1. Rectangular
8.5.2. Square
8.5.3. Round
8.5.4. Runner
8.5.5. Oval
9. Area Rugs Market Report South America Analysis, Insights and Forecast, 2020-2034
9.1. Analysis, Insights and Forecast - by Material
9.1.1. Wool
9.1.2. Synthetics
9.1.3. Cotton
9.1.4. Silk
9.1.5. Jute/Sisal/Seagrass
9.1.6. Animal Skins
9.2. Analysis, Insights and Forecast - by Weave Type
9.2.1. Machine-Made
9.2.2. Hand-Tufted
9.2.3. Hand-Woven
9.2.4. Flatweave
9.2.5. Shag
9.3. Analysis, Insights and Forecast - by Distribution Channel
9.3.1. Specialty Stores
9.3.2. Mass Merchandisers
9.3.3. Home Centers
9.3.4. Online Retailers
9.3.5. Direct-to-Consumer
9.4. Analysis, Insights and Forecast - by Application
9.4.1. Residential
9.4.2. Commercial Offices
9.4.3. Hospitality
9.4.4. Healthcare
9.4.5. Education
9.5. Analysis, Insights and Forecast - by Shape
9.5.1. Rectangular
9.5.2. Square
9.5.3. Round
9.5.4. Runner
9.5.5. Oval
10. Area Rugs Market Report Middle East & Africa Analysis, Insights and Forecast, 2020-2034
10.1. Analysis, Insights and Forecast - by Material
10.1.1. Wool
10.1.2. Synthetics
10.1.3. Cotton
10.1.4. Silk
10.1.5. Jute/Sisal/Seagrass
10.1.6. Animal Skins
10.2. Analysis, Insights and Forecast - by Weave Type
10.2.1. Machine-Made
10.2.2. Hand-Tufted
10.2.3. Hand-Woven
10.2.4. Flatweave
10.2.5. Shag
10.3. Analysis, Insights and Forecast - by Distribution Channel
10.3.1. Specialty Stores
10.3.2. Mass Merchandisers
10.3.3. Home Centers
10.3.4. Online Retailers
10.3.5. Direct-to-Consumer
10.4. Analysis, Insights and Forecast - by Application
10.4.1. Residential
10.4.2. Commercial Offices
10.4.3. Hospitality
10.4.4. Healthcare
10.4.5. Education
10.5. Analysis, Insights and Forecast - by Shape
10.5.1. Rectangular
10.5.2. Square
10.5.3. Round
10.5.4. Runner
10.5.5. Oval
11. Area Rugs Market Report Competitive Analysis
11.1. Company Profiles
11.1.1. Mohawk Industries
11.1.1.1. Company Overview
11.1.1.2. Products
11.1.1.3. Company Financials
11.1.1.4. SWOT Analysis
11.1.2. Shaw Industries
11.1.2.1. Company Overview
11.1.2.2. Products
11.1.2.3. Company Financials
11.1.2.4. SWOT Analysis
11.1.3. Oriental Weavers
11.1.3.1. Company Overview
11.1.3.2. Products
11.1.3.3. Company Financials
11.1.3.4. SWOT Analysis
11.1.4. Interface
11.1.4.1. Company Overview
11.1.4.2. Products
11.1.4.3. Company Financials
11.1.4.4. SWOT Analysis
11.1.5. Surya
11.1.5.1. Company Overview
11.1.5.2. Products
11.1.5.3. Company Financials
11.1.5.4. SWOT Analysis
11.1.6. Nourison
11.1.6.1. Company Overview
11.1.6.2. Products
11.1.6.3. Company Financials
11.1.6.4. SWOT Analysis
11.1.7. Kaleen
11.1.7.1. Company Overview
11.1.7.2. Products
11.1.7.3. Company Financials
11.1.7.4. SWOT Analysis
11.1.8. Capel Rugs
11.1.8.1. Company Overview
11.1.8.2. Products
11.1.8.3. Company Financials
11.1.8.4. SWOT Analysis
11.1.9. Dalyn Rug Company
11.1.9.1. Company Overview
11.1.9.2. Products
12. Area Rugs Market Report Research Methodology
List of Figures
Figure 1: Area Rugs Market Report Revenue Breakdown (Billion, %) by Region 2026 & 2034
Figure 2: North America Area Rugs Market Report Revenue (Billion), by Material 2026 & 2034
Figure 3: North America Area Rugs Market Report Revenue Share (%), by Material 2026 & 2034
Figure 4: North America Area Rugs Market Report Revenue (Billion), by Weave Type 2026 & 2034
Figure 5: North America Area Rugs Market Report Revenue Share (%), by Weave Type 2026 & 2034
Figure 6: North America Area Rugs Market Report Revenue (Billion), by Distribution Channel 2026 & 2034
Figure 7: North America Area Rugs Market Report Revenue Share (%), by Distribution Channel 2026 & 2034
Figure 8: North America Area Rugs Market Report Revenue (Billion), by Application 2026 & 2034
Figure 9: North America Area Rugs Market Report Revenue Share (%), by Application 2026 & 2034
Figure 10: North America Area Rugs Market Report Revenue (Billion), by Shape 2026 & 2034
Figure 11: North America Area Rugs Market Report Revenue Share (%), by Shape 2026 & 2034
Figure 12: North America Area Rugs Market Report Revenue (Billion), by Country 2026 & 2034
Figure 13: North America Area Rugs Market Report Revenue Share (%), by Country 2026 & 2034
Figure 14: Europe Area Rugs Market Report Revenue (Billion), by Material 2026 & 2034
Figure 15: Europe Area Rugs Market Report Revenue Share (%), by Material 2026 & 2034
Figure 16: Europe Area Rugs Market Report Revenue (Billion), by Weave Type 2026 & 2034
List of Tables
Table 1: Area Rugs Market Report Revenue Billion Forecast, by Material 2020 & 2034
Table 2: Area Rugs Market Report Revenue Billion Forecast, by Weave Type 2020 & 2034
Table 3: Area Rugs Market Report Revenue Billion Forecast, by Distribution Channel 2020 & 2034
Table 4: Area Rugs Market Report Revenue Billion Forecast, by Application 2020 & 2034
Table 5: Area Rugs Market Report Revenue Billion Forecast, by Shape 2020 & 2034
Table 6: Area Rugs Market Report Revenue Billion Forecast, by Region 2020 & 2034
Table 7: North America Area Rugs Market Report Revenue Billion Forecast, by Material 2020 & 2034
Table 8: North America Area Rugs Market Report Revenue Billion Forecast, by Weave Type 2020 & 2034
Table 9: North America Area Rugs Market Report Revenue Billion Forecast, by Distribution Channel 2020 & 2034
Table 10: North America Area Rugs Market Report Revenue Billion Forecast, by Application 2020 & 2034
Table 11: North America Area Rugs Market Report Revenue Billion Forecast, by Shape 2020 & 2034
Table 12: North America Area Rugs Market Report Revenue Billion Forecast, by Country 2020 & 2034
Table 13: USA Area Rugs Market Report Revenue (Billion) Forecast, by Application 2020 & 2034
Table 14: Canada Area Rugs Market Report Revenue (Billion) Forecast, by Application 2020 & 2034
Table 15: Mexico Area Rugs Market Report Revenue (Billion) Forecast, by Application 2020 & 2034
Table 16: Europe Area Rugs Market Report Revenue Billion Forecast, by Material 2020 & 2034
Frequently Asked Questions
1. How big is the area rugs market in 2026?
The global area rugs market is estimated at USD 41.32 Billion in 2026, rising to USD 58.57 Billion by 2034 at a 4.46% CAGR, according to one published industry estimate.
2. Which region dominates area rug sales?
North America leads with 39.5% revenue share in 2025, supported by remodeling spend and premium wool demand. Asia-Pacific is the fastest-growing region at a projected 7.06% CAGR.
3. What material leads the area rugs market?
Wool holds 31.4% of material share, valued for durability, insulation, and stain resistance. Synthetics follow closely on cost, while jute and sisal gain on sustainability preferences.
4. Who are the leading area rug vendors?
Mohawk Industries, Shaw Industries, Oriental Weavers, Interface, Surya, and Nourison are among the leading vendors. The market is fragmented with low concentration and strong specialty niches.
5. What is driving area rug market growth?
Home renovation cycles, e-commerce visualization tools, and sustainability-linked product innovation are the primary drivers. LVT cannibalization and crude-oil feedstock volatility are the main restraints.
6. How fast is online rug retail growing?
Online rug retail is the fastest-growing channel, with one benchmark pointing to a 7.48% CAGR through 2031. AR visualization and free returns are reducing purchase friction and return rates.
11.1.9.3. Company Financials
11.1.9.4. SWOT Analysis
11.2. Market Entropy
11.2.1. Company's Key Areas Served
11.2.2. Recent Developments
11.3. Company Market Share Analysis, 2026
11.3.1. Top 5 Companies Market Share Analysis
11.3.2. Top 3 Companies Market Share Analysis
11.4. List of Potential Customers
Figure 17: Europe Area Rugs Market Report Revenue Share (%), by Weave Type 2026 & 2034
Figure 18: Europe Area Rugs Market Report Revenue (Billion), by Distribution Channel 2026 & 2034
Figure 19: Europe Area Rugs Market Report Revenue Share (%), by Distribution Channel 2026 & 2034
Figure 20: Europe Area Rugs Market Report Revenue (Billion), by Application 2026 & 2034
Figure 21: Europe Area Rugs Market Report Revenue Share (%), by Application 2026 & 2034
Figure 22: Europe Area Rugs Market Report Revenue (Billion), by Shape 2026 & 2034
Figure 23: Europe Area Rugs Market Report Revenue Share (%), by Shape 2026 & 2034
Figure 24: Europe Area Rugs Market Report Revenue (Billion), by Country 2026 & 2034
Figure 25: Europe Area Rugs Market Report Revenue Share (%), by Country 2026 & 2034
Figure 26: Asia-Pacific Area Rugs Market Report Revenue (Billion), by Material 2026 & 2034
Figure 27: Asia-Pacific Area Rugs Market Report Revenue Share (%), by Material 2026 & 2034
Figure 28: Asia-Pacific Area Rugs Market Report Revenue (Billion), by Weave Type 2026 & 2034
Figure 29: Asia-Pacific Area Rugs Market Report Revenue Share (%), by Weave Type 2026 & 2034
Figure 30: Asia-Pacific Area Rugs Market Report Revenue (Billion), by Distribution Channel 2026 & 2034
Figure 31: Asia-Pacific Area Rugs Market Report Revenue Share (%), by Distribution Channel 2026 & 2034
Figure 32: Asia-Pacific Area Rugs Market Report Revenue (Billion), by Application 2026 & 2034
Figure 33: Asia-Pacific Area Rugs Market Report Revenue Share (%), by Application 2026 & 2034
Figure 34: Asia-Pacific Area Rugs Market Report Revenue (Billion), by Shape 2026 & 2034
Figure 35: Asia-Pacific Area Rugs Market Report Revenue Share (%), by Shape 2026 & 2034
Figure 36: Asia-Pacific Area Rugs Market Report Revenue (Billion), by Country 2026 & 2034
Figure 37: Asia-Pacific Area Rugs Market Report Revenue Share (%), by Country 2026 & 2034
Figure 38: South America Area Rugs Market Report Revenue (Billion), by Material 2026 & 2034
Figure 39: South America Area Rugs Market Report Revenue Share (%), by Material 2026 & 2034
Figure 40: South America Area Rugs Market Report Revenue (Billion), by Weave Type 2026 & 2034
Figure 41: South America Area Rugs Market Report Revenue Share (%), by Weave Type 2026 & 2034
Figure 42: South America Area Rugs Market Report Revenue (Billion), by Distribution Channel 2026 & 2034
Figure 43: South America Area Rugs Market Report Revenue Share (%), by Distribution Channel 2026 & 2034
Figure 44: South America Area Rugs Market Report Revenue (Billion), by Application 2026 & 2034
Figure 45: South America Area Rugs Market Report Revenue Share (%), by Application 2026 & 2034
Figure 46: South America Area Rugs Market Report Revenue (Billion), by Shape 2026 & 2034
Figure 47: South America Area Rugs Market Report Revenue Share (%), by Shape 2026 & 2034
Figure 48: South America Area Rugs Market Report Revenue (Billion), by Country 2026 & 2034
Figure 49: South America Area Rugs Market Report Revenue Share (%), by Country 2026 & 2034
Figure 50: Middle East & Africa Area Rugs Market Report Revenue (Billion), by Material 2026 & 2034
Figure 51: Middle East & Africa Area Rugs Market Report Revenue Share (%), by Material 2026 & 2034
Figure 52: Middle East & Africa Area Rugs Market Report Revenue (Billion), by Weave Type 2026 & 2034
Figure 53: Middle East & Africa Area Rugs Market Report Revenue Share (%), by Weave Type 2026 & 2034
Figure 54: Middle East & Africa Area Rugs Market Report Revenue (Billion), by Distribution Channel 2026 & 2034
Figure 55: Middle East & Africa Area Rugs Market Report Revenue Share (%), by Distribution Channel 2026 & 2034
Figure 56: Middle East & Africa Area Rugs Market Report Revenue (Billion), by Application 2026 & 2034
Figure 57: Middle East & Africa Area Rugs Market Report Revenue Share (%), by Application 2026 & 2034
Figure 58: Middle East & Africa Area Rugs Market Report Revenue (Billion), by Shape 2026 & 2034
Figure 59: Middle East & Africa Area Rugs Market Report Revenue Share (%), by Shape 2026 & 2034
Figure 60: Middle East & Africa Area Rugs Market Report Revenue (Billion), by Country 2026 & 2034
Figure 61: Middle East & Africa Area Rugs Market Report Revenue Share (%), by Country 2026 & 2034
Table 17: Europe Area Rugs Market Report Revenue Billion Forecast, by Weave Type 2020 & 2034
Table 18: Europe Area Rugs Market Report Revenue Billion Forecast, by Distribution Channel 2020 & 2034
Table 19: Europe Area Rugs Market Report Revenue Billion Forecast, by Application 2020 & 2034
Table 20: Europe Area Rugs Market Report Revenue Billion Forecast, by Shape 2020 & 2034
Table 21: Europe Area Rugs Market Report Revenue Billion Forecast, by Country 2020 & 2034
Table 22: Germany Area Rugs Market Report Revenue (Billion) Forecast, by Application 2020 & 2034
Table 23: UK Area Rugs Market Report Revenue (Billion) Forecast, by Application 2020 & 2034
Table 24: France Area Rugs Market Report Revenue (Billion) Forecast, by Application 2020 & 2034
Table 25: Italy Area Rugs Market Report Revenue (Billion) Forecast, by Application 2020 & 2034
Table 26: Spain Area Rugs Market Report Revenue (Billion) Forecast, by Application 2020 & 2034
Table 27: Netherlands Area Rugs Market Report Revenue (Billion) Forecast, by Application 2020 & 2034
Table 28: Asia-Pacific Area Rugs Market Report Revenue Billion Forecast, by Material 2020 & 2034
Table 29: Asia-Pacific Area Rugs Market Report Revenue Billion Forecast, by Weave Type 2020 & 2034
Table 30: Asia-Pacific Area Rugs Market Report Revenue Billion Forecast, by Distribution Channel 2020 & 2034
Table 31: Asia-Pacific Area Rugs Market Report Revenue Billion Forecast, by Application 2020 & 2034
Table 32: Asia-Pacific Area Rugs Market Report Revenue Billion Forecast, by Shape 2020 & 2034
Table 33: Asia-Pacific Area Rugs Market Report Revenue Billion Forecast, by Country 2020 & 2034
Table 34: China Area Rugs Market Report Revenue (Billion) Forecast, by Application 2020 & 2034
Table 35: India Area Rugs Market Report Revenue (Billion) Forecast, by Application 2020 & 2034
Table 36: Japan Area Rugs Market Report Revenue (Billion) Forecast, by Application 2020 & 2034
Table 37: South Korea Area Rugs Market Report Revenue (Billion) Forecast, by Application 2020 & 2034
Table 38: Australia Area Rugs Market Report Revenue (Billion) Forecast, by Application 2020 & 2034
Table 39: South America Area Rugs Market Report Revenue Billion Forecast, by Material 2020 & 2034
Table 40: South America Area Rugs Market Report Revenue Billion Forecast, by Weave Type 2020 & 2034
Table 41: South America Area Rugs Market Report Revenue Billion Forecast, by Distribution Channel 2020 & 2034
Table 42: South America Area Rugs Market Report Revenue Billion Forecast, by Application 2020 & 2034
Table 43: South America Area Rugs Market Report Revenue Billion Forecast, by Shape 2020 & 2034
Table 44: South America Area Rugs Market Report Revenue Billion Forecast, by Country 2020 & 2034
Table 45: Brazil Area Rugs Market Report Revenue (Billion) Forecast, by Application 2020 & 2034
Table 46: Argentina Area Rugs Market Report Revenue (Billion) Forecast, by Application 2020 & 2034
Table 47: Chile Area Rugs Market Report Revenue (Billion) Forecast, by Application 2020 & 2034
Table 48: Middle East & Africa Area Rugs Market Report Revenue Billion Forecast, by Material 2020 & 2034
Table 49: Middle East & Africa Area Rugs Market Report Revenue Billion Forecast, by Weave Type 2020 & 2034
Table 50: Middle East & Africa Area Rugs Market Report Revenue Billion Forecast, by Distribution Channel 2020 & 2034
Table 51: Middle East & Africa Area Rugs Market Report Revenue Billion Forecast, by Application 2020 & 2034
Table 52: Middle East & Africa Area Rugs Market Report Revenue Billion Forecast, by Shape 2020 & 2034
Table 53: Middle East & Africa Area Rugs Market Report Revenue Billion Forecast, by Country 2020 & 2034
Table 54: Saudi Arabia Area Rugs Market Report Revenue (Billion) Forecast, by Application 2020 & 2034
Table 55: UAE Area Rugs Market Report Revenue (Billion) Forecast, by Application 2020 & 2034
Table 56: South Africa Area Rugs Market Report Revenue (Billion) Forecast, by Application 2020 & 2034
Table 57: Turkey Area Rugs Market Report Revenue (Billion) Forecast, by Application 2020 & 2034