Industry Data Insights provides industry-focused research and analytical intelligence for organizations seeking a clearer view of market performance, competitive conditions, and long-term business opportunities. Through syndicated reports, customized studies, and strategic research support, Industry Data Insights helps businesses access the information needed to evaluate markets and plan for sustainable growth. Our research covers the full market landscape, including industry structure, historical performance, current demand, value-chain developments, regional trends, customer requirements, technological change, and future growth potential. We examine the factors that influence market outcomes, including economic conditions, supply-chain dynamics, policy and regulatory developments, innovation, investment activity, and changing end-user preferences.
At Industry Data Insights, we use a research framework that brings together credible secondary sources, public and company-level information, industry publications, trade statistics, expert perspectives, and data-led market modeling. Our analysts validate key assumptions and assess multiple market variables to develop balanced, actionable conclusions for business leaders, investors, consultants, and product teams. Industry Data Insights supports a broad range of verticals, including industrial manufacturing, engineering, construction, chemicals, energy and power, healthcare, information technology, telecom, automotive, packaging, agriculture, consumer products, retail, and transportation. Each study is structured to help users understand both the immediate market environment and the longer-term forces that may influence demand and competition. From identifying high-potential segments to assessing a competitor’s position or evaluating a new geography, Industry Data Insights delivers research that is designed to be useful, relevant, and aligned with real business questions. Our goal is to turn industry data into strategic direction.
Deep Learning Market Size, Growth & Forecast to 2033
Deep Learning Market
Updated On
Nov 18 2026
Total Pages
274
Shweta Thorat
Research Associate
Deep Learning Market Size, Growth & Forecast to 2033
Deep Learning Market by Solution (Hardware, Software, Services), by Hardware (CPU, GPU, FPGA, ASIC), by Application (Image Recognition, Voice Recognition, Video Surveillance & Diagnostics, Data Mining, NLP, Autonomous Systems), by End-use (Healthcare, BFSI, Manufacturing, Retail & E-Commerce, Automotive, Aerospace & Defense, Marketing, Security), by Deployment (Cloud, On-Premises), by North America (USA, Canada, Mexico), by Europe (Germany, UK, France, Italy), by Asia Pacific (China, Japan, India, South Korea, Australia), by Latin America (Brazil, Mexico, Argentina), by Middle East & Africa (Saudi Arabia, UAE, South Africa) Forecast 2026-2034
Deep Learning Market Size, Growth & Forecast to 2033
Discover the Latest Market Insight Reports
Access in-depth insights on industries, companies, trends, and global markets. Our expertly curated reports provide the most relevant data and analysis in a condensed, easy-to-read format.
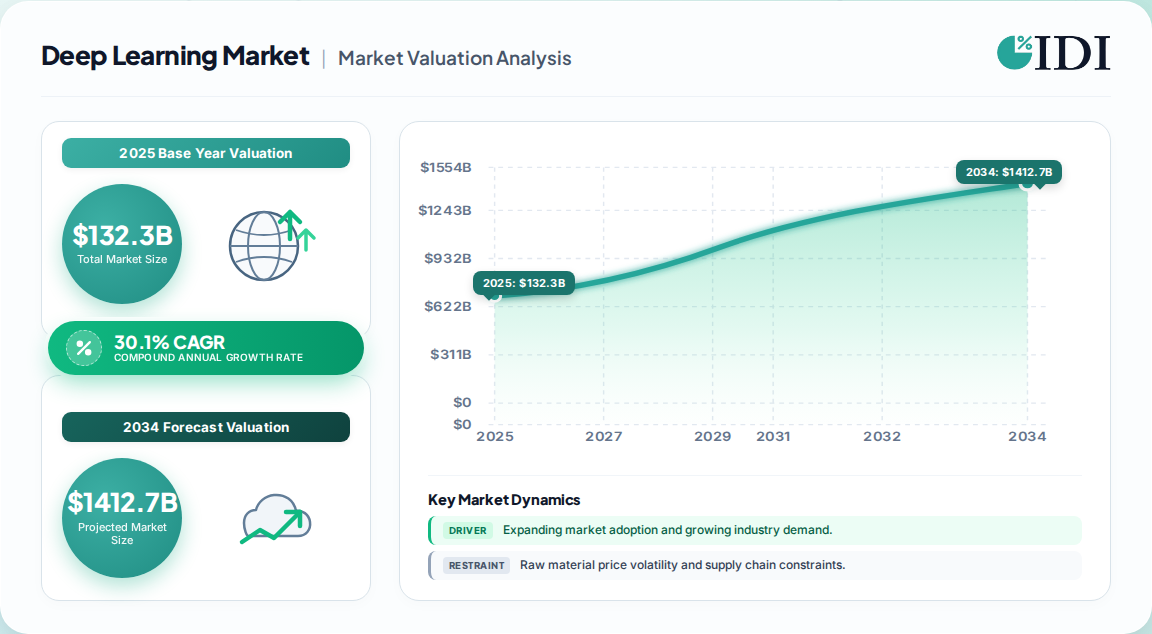
132.3 Billion in 2025 global revenue — the base from which the deep learning market nearly ninefolds.
1,125.7 Billion projected by 2033, a compound annual growth rate of 30.1% across 2026–2033.
Software led solutions at 45.3% share in 2025, though hardware acceleration is the fastest-rising component.
Image recognition remains the anchor application at roughly 35–39% share, depending on definitional scope.
North America holds the largest regional share (32–38% across published estimates); Asia Pacific grows fastest.
Healthcare and BFSI trade places as the leading vertical depending on whether revenue is measured by spend or deployment count.
Why this matters for decision-makers: Hardware costs are falling faster than software prices — buyers who lock multi-year software contracts now risk paying for compute economics that will be obsolete within 18 months.
Deep Learning Market Market Size (In Billion)
750.0B
600.0B
450.0B
300.0B
150.0B
0
132.3 B
2025
178.3 B
2026
232.0 B
2027
301.8 B
2028
392.6 B
2029
510.8 B
2030
664.6 B
2031
Deep Learning Market Market Size (In Billion)
Year
Market Size
2025
132.3 B
2026
178.3 B
2027
232.0 B
2028
301.8 B
2029
392.6 B
2030
510.8 B
2031
664.6 B
What is the Deep Learning Market?
The deep learning market comprises hardware accelerators, software frameworks and platforms, and integration services used to build and run multi-layer neural networks for perception, language, prediction and autonomous decision tasks. It excludes general machine learning tooling, analytics services and the underlying cloud infrastructure rented to host these workloads.
Scope: what this report covers and excludes
This analysis covers deep learning hardware (GPU, ASIC, FPGA, CPU), software platforms and frameworks, and professional services, across image and video recognition, speech and voice, NLP, data mining and autonomous systems. It spans BFSI, healthcare, manufacturing, retail, automotive, aerospace and defense, marketing and security verticals.
This analysis does not cover general-purpose machine learning platforms, standalone data-labeling services, broader AI consulting engagements, or cloud infrastructure spend where deep learning is not the primary billed workload.
How big is the market for Deep Learning Market?
Published estimates diverge sharply because no two analysts draw the same perimeter around hardware resale, hosted inference and embedded on-device models. The table below normalizes the four credible benchmarks against their stated definitions.
Estimate
Base year
Horizon
CAGR
Definition / scope
Attribution
132.3 Billion
2025
2033
30.1%
Full stack: hardware, software, services
One published estimate
110.24 Billion
2025
2034
34.0%
Hardware-weighted, hardware 42.7% of 2025
A competing analysis
98.72 Billion
2025
2033
26.9%
Narrow: deep learning sub-segment of broader AI
One published estimate
47.89 Billion
2025
2031
35.48%
Software and services dominated (67.3%)
A competing analysis
Our analysis suggests the 110–132 Billion band is the most defensible base-year range. The 47.89 Billion figure is not wrong — it deliberately excludes hardware resale, which is precisely where the fastest growth is occurring. Buyers evaluating total cost of ownership should anchor to the higher band; buyers evaluating platform software alone should anchor to the lower.
The 26.9% figure is the most conservative and likely understates near-term momentum, because it was constructed before the 2025 accelerator price collapse materially widened the addressable buyer base.
How is the market segmented?
Segmentation matters because margin pools sit in different layers: hardware captures volume, software captures recurring revenue, and services capture the deployment friction that neither can eliminate.
Parent segment
Children
2025 signal
By Solution
Hardware, Software, Services
Software 45.3%; hardware fastest-growing
By Hardware
CPU, GPU, FPGA, ASIC
ASIC growing ~38% CAGR
By Application
Image recognition, Voice recognition, Video surveillance & diagnostics, Data mining, NLP, Autonomous systems
Two structural observations follow. First, the software share is declining in relative terms even as it grows absolutely — hardware is outgrowing it. Second, cloud dominance at ~62% is not a permanent equilibrium; edge inference is the fastest-compounding sub-segment and it structurally favors on-premises and device-embedded deployment.
Which region leads in the Deep Learning Market?
North America leads with roughly 32–38% of global revenue in 2025, but the more consequential story is Asia Pacific posting the fastest growth at ~36–38% CAGR through the early 2030s.
Deep Learning Market Regional Market Share
Loading chart...
Deep Learning Market Regional Market Share
Region
Market Share (%)
North America
0.36%
Europe
0.24%
Asia-Pacific
0.28%
Latin America
0.06%
Middle East & Africa
0.06%
North America
United States (largest single country market)
Canada
Mexico
Europe
Germany
United Kingdom
France
Italy
Rest of Europe
Asia Pacific
China
Japan
India
South Korea (highest forecast country CAGR)
Australia
Latin America
Brazil
Mexico
Argentina
Middle East & Africa
Saudi Arabia
UAE
South Africa
The regional spread reveals a divergence worth flagging: North America's share is large but compressing, while Asia Pacific combines semiconductor supply-chain proximity with state-backed adoption. This implies that a vendor's North American revenue share overstates its strategic position — regional growth rates, not regional shares, should drive capacity allocation.
What is driving growth — and what is holding it back?
Unstructured data growth and collapsing accelerator costs are the dominant drivers, with the energy footprint and specialist talent scarcity the binding constraints on how fast demand converts to revenue.
Factor
Direction
Evidence strength
Mechanism
Unstructured data expansion (~80% of enterprise data)
Medical imaging and diagnostics adoption (521 FDA-cleared devices in 2024)
Driver
Strong
Creates regulated, recurring demand
Consumer and edge DL integration
Driver
Moderate
Shifts inference to device
Energy and cooling costs (racks at 40–140 kW)
Restraint
Strong
Caps scale-out economics
Specialist talent scarcity (~6 million roles by 2030)
Restraint
Moderate
Delays implementation cycles
Tightening AI regulation and IP liability
Restraint
Moderate
Raises compliance overhead
The balance favors expansion. Drivers are largely structural and compounding; restraints are largely transitional and priced. Our analysis suggests energy is the restraint most likely to bite first, because it is a hard physical constraint rather than a labor or legal one that markets can clear.
Who are the leading vendors?
The competitive field is bifurcated: accelerator and platform incumbents control the compute and framework layer, while vertical specialists are quietly winning the highest-margin regulated deployments.
Layer
Representative players
Moat source
Accelerators & silicon
NVIDIA, AMD, Qualcomm
Instruction-set and software ecosystem lock-in
Cloud & platforms
Microsoft, Google, AWS
Data gravity and integrated tooling
Enterprise software
IBM, SAS, Palantir
Regulatory trust and integration depth
Vertical specialists
Healthcare, industrial vision, and fintech DL vendors
Domain datasets and cleared workflows
The durable moat sits at the framework-and-toolchain layer, not the model layer. Models commoditize quickly; the tooling that trains, quantizes and deploys them does not. Buyers should test vendor lock-in at the framework level, not the model level.
What do buyers and operators need to know?
Selection criteria have shifted from raw accuracy to total cost of inference. Buyers should weight quantization support, hardware portability and data-residency guarantees above benchmark scores, because a two-point accuracy gain that doubles inference cost is rarely defensible at scale.
Procurement risk concentrates in three areas. First, multi-year software contracts priced on today's compute economics may become uneconomic within 18 months given ~40% annual cost declines. Second, regulatory exposure differs sharply by jurisdiction — medical and financial deployments face cleared-device and model-transparency obligations that general-purpose tools cannot satisfy. Third, switching costs are highest at the data-pipeline layer, not the model layer, so buyers should negotiate portability of training data and feature stores explicitly at contract signature.
Operators should also model energy as a first-class line item. Energy can represent up to 40% of total AI ownership cost, and cooling retrofits add 15–20% to capital outlay — figures that materially change payback periods for on-premises deployments.
Strategic Recommendations & Analyst Perspective
The balance of evidence favors the higher-end market estimates, and more importantly favors treating this as a compute-economics market rather than a software-licensing market. The divergence between the 47.89 Billion and 132.3 Billion base-year figures is not analytical error — it is a perimeter dispute, and the wider perimeter is where growth is fastest. Analysts anchored to software-only scopes will systematically underestimate both the opportunity and the competitive threat from silicon vendors moving up-stack.
The strongest counter-argument is that hardware dominance is cyclical. Accelerator margins have historically compressed once supply catches demand, and a hardware-led expansion could prove fragile if capital expenditure slows. That argument has merit, but it misreads the mechanism: falling hardware costs expand the buyer base rather than shrink the market, so margin compression and volume expansion coexist.
For investors: Underwrite exposure to inference-efficiency tooling and edge deployment, not to training-scale compute alone.
For vendors: Prioritize healthcare and BFSI verticals where regulatory clearance creates a defensible wedge against general-purpose platforms.
For enterprise buyers: Negotiate hardware-portable contracts and require quantization and on-premises fallback clauses before signing multi-year commitments.
What would change our conclusion: a sustained reversal in accelerator cost declines, or regulatory action that materially restricts training-data use in the EU and US simultaneously. Absent either, the 30%+ trajectory holds. Precise sub-segment forecasting by deployment mode and vertical, however, requires the full report's bottom-up modeling.
Deep Learning Market Regional Market Share
Higher Coverage
Lower Coverage
No Coverage
Deep Learning Market REPORT HIGHLIGHTS
Research Methodology & Data Sources
Our rigorous research methodology combines multi-layered approaches with comprehensive quality assurance, ensuring precision, accuracy, and reliability in every market analysis.
Primary Research & Industry Fieldwork
Our research applies a 70/30 primary-to-secondary split. Structured depth interviews were conducted across the value chain with accelerator and silicon suppliers, deep learning platform and framework providers, systems integrators and deployment consultancies, and enterprise end-users operating production models at scale. Interviews targeted named decision-makers including VP-level AI and Data Platform owners, Heads of Machine Learning Engineering, Chief Data Officers, and Commercial Operations Leads responsible for inference budget allocation. Fieldwork captured deployment economics, procurement friction and realized (not benchmarked) model performance.
Key Stakeholders Interviewed
Key Stakeholders Interviewed
Stakeholder Role
Interview Share (%)
VP AI & Data Platform Owners
35%
Heads of ML Engineering
30%
Chief Data Officers
20%
Commercial Operations Leads
15%
Industry Ecosystem Breakdown
Industry Ecosystem Breakdown
Company Type
Representation (%)
Accelerator & Silicon Suppliers
30%
Platform & Software Providers
35%
Systems Integrators & Consultancies
20%
Enterprise End-Users
15%
Secondary Benchmarking & Public Trade Validation
Secondary validation drew on official multilateral and standards sources: US ITC trade statistics for semiconductor and accelerator flows, Eurostat ICT investment series, WTO services trade data, and US SEC 10-K filings and investor presentations from listed silicon and platform vendors. Patent databases were screened for neural architecture and quantization filings, and technical standards from IEEE and ISO/IEC JTC 1 were reviewed for model documentation and AI governance requirements. No third-party market research publications were used as validation inputs.
Demand Modeling & Market Sizing Triangulation
We run simultaneous top-down and bottom-up models. The top-down model allocates macro AI and ICT spend across deep learning by segment and region. The bottom-up model builds from accelerator shipment volumes, average selling prices, software seat and consumption pricing, and end-use deployment counts. Divergence between the two is reconciled at the segment level before any forecast is published.
Data Triangulation & Validation Matrix
Dimension
Analytical Scope
Methodology Applied
Validation Level
Base-Year Market Size
Value in USD for base year
Bottom-up shipment and revenue triangulation
High
Forecast Horizon
Multi-year compound projection
Historical CAGR, regression analysis and demand elasticity
High
Regional Distribution
Regional share breakdown
Trade flow analysis and regional consumption modeling
High
Competitive Landscape
Leading market players
Annual reports, capacity mapping and commercial filings
High
Sources Referenced
US International Trade Commission (US ITC) trade statistics
Eurostat ICT and digital economy indicators
IEEE and ISO/IEC JTC 1 artificial intelligence standards
US SEC EDGAR corporate filings (10-K, 10-Q, investor presentations)
Aspects
Details
Study Period
2020-2034
Base Year
2025
Estimated Year
2026
Forecast Period
2026-2034
Historical Period
2020-2025
Growth Rate
CAGR of 30.1% from 2020-2034
Segmentation
By Solution
Hardware
Software
Services
By Hardware
CPU
GPU
FPGA
ASIC
By Application
Image Recognition
Voice Recognition
Video Surveillance & Diagnostics
Data Mining
NLP
Autonomous Systems
By End-use
Healthcare
BFSI
Manufacturing
Retail & E-Commerce
Automotive
Aerospace & Defense
Marketing
Security
By Deployment
Cloud
On-Premises
By Geography
North America
USA
Canada
Mexico
Europe
Germany
UK
France
Italy
Asia Pacific
China
Japan
India
South Korea
Australia
Latin America
Brazil
Mexico
Argentina
Middle East & Africa
Saudi Arabia
UAE
South Africa
Table of Contents
1. Deep Learning Market Introduction
1.1. Research Scope
1.2. Market Segmentation
1.3. Research Objective
1.4. Definitions and Assumptions
2. Deep Learning Market Executive Summary
2.1. Market Snapshot
3. Deep Learning Market Dynamics
3.1. Introduction
3.2. Market Drivers
3.3. Market Restrains
3.4. Market Trends
4. Deep Learning Market Factor Analysis
4.1. Porters Five Forces
4.1.1. Bargaining Power of Suppliers
4.1.2. Bargaining Power of Buyers
4.1.3. Threat of New Entrants
4.1.4. Threat of Substitutes
4.1.5. Competitive Rivalry
4.2. PESTEL analysis
4.3. BCG Analysis
4.3.1. Stars (High Growth, High Market Share)
4.3.2. Cash Cows (Low Growth, High Market Share)
4.3.3. Question Mark (High Growth, Low Market Share)
4.3.4. Dogs (Low Growth, Low Market Share)
4.4. Ansoff Matrix Analysis
4.5. Supply Chain Analysis
4.6. Regulatory Landscape
4.7. Current Market Potential and Opportunity Assessment (TAM–SAM–SOM Framework)
4.8. IDI Analyst Note
5. Deep Learning Market Analysis, Insights and Forecast, 2020-2034
5.1. Analysis, Insights and Forecast - by Solution
5.1.1. Hardware
5.1.2. Software
5.1.3. Services
5.2. Analysis, Insights and Forecast - by Hardware
5.2.1. CPU
5.2.2. GPU
5.2.3. FPGA
5.2.4. ASIC
5.3. Analysis, Insights and Forecast - by Application
5.3.1. Image Recognition
5.3.2. Voice Recognition
5.3.3. Video Surveillance & Diagnostics
5.3.4. Data Mining
5.3.5. NLP
5.3.6. Autonomous Systems
5.4. Analysis, Insights and Forecast - by End-use
5.4.1. Healthcare
5.4.2. BFSI
5.4.3. Manufacturing
5.4.4. Retail & E-Commerce
5.4.5. Automotive
5.4.6. Aerospace & Defense
5.4.7. Marketing
5.4.8. Security
5.5. Analysis, Insights and Forecast - by Deployment
5.5.1. Cloud
5.5.2. On-Premises
5.6. Analysis, Insights and Forecast - by Region
5.6.1. North America
5.6.2. Europe
5.6.3. Asia Pacific
5.6.4. Latin America
5.6.5. Middle East & Africa
6. Deep Learning Market North America Analysis, Insights and Forecast, 2020-2034
6.1. Analysis, Insights and Forecast - by Solution
6.1.1. Hardware
6.1.2. Software
6.1.3. Services
6.2. Analysis, Insights and Forecast - by Hardware
6.2.1. CPU
6.2.2. GPU
6.2.3. FPGA
6.2.4. ASIC
6.3. Analysis, Insights and Forecast - by Application
6.3.1. Image Recognition
6.3.2. Voice Recognition
6.3.3. Video Surveillance & Diagnostics
6.3.4. Data Mining
6.3.5. NLP
6.3.6. Autonomous Systems
6.4. Analysis, Insights and Forecast - by End-use
6.4.1. Healthcare
6.4.2. BFSI
6.4.3. Manufacturing
6.4.4. Retail & E-Commerce
6.4.5. Automotive
6.4.6. Aerospace & Defense
6.4.7. Marketing
6.4.8. Security
6.5. Analysis, Insights and Forecast - by Deployment
6.5.1. Cloud
6.5.2. On-Premises
7. Deep Learning Market Europe Analysis, Insights and Forecast, 2020-2034
7.1. Analysis, Insights and Forecast - by Solution
7.1.1. Hardware
7.1.2. Software
7.1.3. Services
7.2. Analysis, Insights and Forecast - by Hardware
7.2.1. CPU
7.2.2. GPU
7.2.3. FPGA
7.2.4. ASIC
7.3. Analysis, Insights and Forecast - by Application
7.3.1. Image Recognition
7.3.2. Voice Recognition
7.3.3. Video Surveillance & Diagnostics
7.3.4. Data Mining
7.3.5. NLP
7.3.6. Autonomous Systems
7.4. Analysis, Insights and Forecast - by End-use
7.4.1. Healthcare
7.4.2. BFSI
7.4.3. Manufacturing
7.4.4. Retail & E-Commerce
7.4.5. Automotive
7.4.6. Aerospace & Defense
7.4.7. Marketing
7.4.8. Security
7.5. Analysis, Insights and Forecast - by Deployment
7.5.1. Cloud
7.5.2. On-Premises
8. Deep Learning Market Asia Pacific Analysis, Insights and Forecast, 2020-2034
8.1. Analysis, Insights and Forecast - by Solution
8.1.1. Hardware
8.1.2. Software
8.1.3. Services
8.2. Analysis, Insights and Forecast - by Hardware
8.2.1. CPU
8.2.2. GPU
8.2.3. FPGA
8.2.4. ASIC
8.3. Analysis, Insights and Forecast - by Application
8.3.1. Image Recognition
8.3.2. Voice Recognition
8.3.3. Video Surveillance & Diagnostics
8.3.4. Data Mining
8.3.5. NLP
8.3.6. Autonomous Systems
8.4. Analysis, Insights and Forecast - by End-use
8.4.1. Healthcare
8.4.2. BFSI
8.4.3. Manufacturing
8.4.4. Retail & E-Commerce
8.4.5. Automotive
8.4.6. Aerospace & Defense
8.4.7. Marketing
8.4.8. Security
8.5. Analysis, Insights and Forecast - by Deployment
8.5.1. Cloud
8.5.2. On-Premises
9. Deep Learning Market Latin America Analysis, Insights and Forecast, 2020-2034
9.1. Analysis, Insights and Forecast - by Solution
9.1.1. Hardware
9.1.2. Software
9.1.3. Services
9.2. Analysis, Insights and Forecast - by Hardware
9.2.1. CPU
9.2.2. GPU
9.2.3. FPGA
9.2.4. ASIC
9.3. Analysis, Insights and Forecast - by Application
9.3.1. Image Recognition
9.3.2. Voice Recognition
9.3.3. Video Surveillance & Diagnostics
9.3.4. Data Mining
9.3.5. NLP
9.3.6. Autonomous Systems
9.4. Analysis, Insights and Forecast - by End-use
9.4.1. Healthcare
9.4.2. BFSI
9.4.3. Manufacturing
9.4.4. Retail & E-Commerce
9.4.5. Automotive
9.4.6. Aerospace & Defense
9.4.7. Marketing
9.4.8. Security
9.5. Analysis, Insights and Forecast - by Deployment
9.5.1. Cloud
9.5.2. On-Premises
10. Deep Learning Market Middle East & Africa Analysis, Insights and Forecast, 2020-2034
10.1. Analysis, Insights and Forecast - by Solution
10.1.1. Hardware
10.1.2. Software
10.1.3. Services
10.2. Analysis, Insights and Forecast - by Hardware
10.2.1. CPU
10.2.2. GPU
10.2.3. FPGA
10.2.4. ASIC
10.3. Analysis, Insights and Forecast - by Application
10.3.1. Image Recognition
10.3.2. Voice Recognition
10.3.3. Video Surveillance & Diagnostics
10.3.4. Data Mining
10.3.5. NLP
10.3.6. Autonomous Systems
10.4. Analysis, Insights and Forecast - by End-use
10.4.1. Healthcare
10.4.2. BFSI
10.4.3. Manufacturing
10.4.4. Retail & E-Commerce
10.4.5. Automotive
10.4.6. Aerospace & Defense
10.4.7. Marketing
10.4.8. Security
10.5. Analysis, Insights and Forecast - by Deployment
10.5.1. Cloud
10.5.2. On-Premises
11. Deep Learning Market Competitive Analysis
11.1. Company Profiles
11.2. Market Entropy
11.2.1. Company's Key Areas Served
11.2.2. Recent Developments
11.3. Company Market Share Analysis, 2026
11.3.1. Top 5 Companies Market Share Analysis
11.3.2. Top 3 Companies Market Share Analysis
11.4. List of Potential Customers
12. Deep Learning Market Research Methodology
List of Figures
Figure 1: Deep Learning Market Revenue Breakdown (Billion, %) by Region 2026 & 2034
Figure 2: North America Deep Learning Market Revenue (Billion), by Solution 2026 & 2034
Figure 3: North America Deep Learning Market Revenue Share (%), by Solution 2026 & 2034
Figure 4: North America Deep Learning Market Revenue (Billion), by Hardware 2026 & 2034
Figure 5: North America Deep Learning Market Revenue Share (%), by Hardware 2026 & 2034
Figure 6: North America Deep Learning Market Revenue (Billion), by Application 2026 & 2034
Figure 7: North America Deep Learning Market Revenue Share (%), by Application 2026 & 2034
Figure 8: North America Deep Learning Market Revenue (Billion), by End-use 2026 & 2034
Figure 9: North America Deep Learning Market Revenue Share (%), by End-use 2026 & 2034
Figure 10: North America Deep Learning Market Revenue (Billion), by Deployment 2026 & 2034
Figure 11: North America Deep Learning Market Revenue Share (%), by Deployment 2026 & 2034
Figure 12: North America Deep Learning Market Revenue (Billion), by Country 2026 & 2034
Figure 13: North America Deep Learning Market Revenue Share (%), by Country 2026 & 2034
Figure 14: Europe Deep Learning Market Revenue (Billion), by Solution 2026 & 2034
Figure 15: Europe Deep Learning Market Revenue Share (%), by Solution 2026 & 2034
Figure 16: Europe Deep Learning Market Revenue (Billion), by Hardware 2026 & 2034
Europe Deep Learning Market Revenue Share (%), by Hardware 2026 & 2034
List of Tables
Table 1: Deep Learning Market Revenue Billion Forecast, by Solution 2020 & 2034
Table 2: Deep Learning Market Revenue Billion Forecast, by Hardware 2020 & 2034
Table 3: Deep Learning Market Revenue Billion Forecast, by Application 2020 & 2034
Table 4: Deep Learning Market Revenue Billion Forecast, by End-use 2020 & 2034
Table 5: Deep Learning Market Revenue Billion Forecast, by Deployment 2020 & 2034
Table 6: Deep Learning Market Revenue Billion Forecast, by Region 2020 & 2034
Table 7: North America Deep Learning Market Revenue Billion Forecast, by Solution 2020 & 2034
Table 8: North America Deep Learning Market Revenue Billion Forecast, by Hardware 2020 & 2034
Table 9: North America Deep Learning Market Revenue Billion Forecast, by Application 2020 & 2034
Table 10: North America Deep Learning Market Revenue Billion Forecast, by End-use 2020 & 2034
Table 11: North America Deep Learning Market Revenue Billion Forecast, by Deployment 2020 & 2034
Table 12: North America Deep Learning Market Revenue Billion Forecast, by Country 2020 & 2034
Table 13: USA Deep Learning Market Revenue (Billion) Forecast, by Application 2020 & 2034
Table 14: Canada Deep Learning Market Revenue (Billion) Forecast, by Application 2020 & 2034
Table 15: Mexico Deep Learning Market Revenue (Billion) Forecast, by Application 2020 & 2034
Table 16: Europe Deep Learning Market Revenue Billion Forecast, by Solution 2020 & 2034
Europe Deep Learning Market Revenue Billion Forecast, by Hardware 2020 & 2034
Frequently Asked Questions
1. How big is the deep learning market in 2025?
The deep learning market was valued at approximately 132.3 Billion in 2025 on a full-stack basis including hardware, software and services. Narrower software-only scopes place it near 48 Billion. The gap reflects perimeter differences, not disagreement on direction.
2. What is the deep learning market growth rate?
Most published forecasts cluster between 26.9% and 35.5% CAGR for the 2026–2031/2033 window. A 30.1% CAGR is a reasonable central case, implying roughly 1,125.7 Billion in global revenue by 2033.
3. Which region leads the deep learning market?
North America leads with roughly 32–38% of 2025 revenue, driven by US hyperscaler and enterprise adoption. Asia Pacific is the fastest-growing region at approximately 36–38% CAGR, supported by semiconductor supply chains and state-backed AI programs.
4. What are the main restraints on deep learning adoption?
Energy and cooling costs, specialist talent scarcity, tightening AI regulation and IP liability for training data collectively slow conversion of demand into revenue. Energy is the hardest constraint because it is physical rather than labor or legal.
5. Which end-use industry is adopting deep learning fastest?
Healthcare and life sciences is the fastest-growing vertical, tracking roughly 36.75% CAGR, aided by 521 FDA-cleared AI-enabled devices in 2024. BFSI remains the largest single vertical by revenue share at approximately 24%.
Figure 17:
Figure 18: Europe Deep Learning Market Revenue (Billion), by Application 2026 & 2034
Figure 19: Europe Deep Learning Market Revenue Share (%), by Application 2026 & 2034
Figure 20: Europe Deep Learning Market Revenue (Billion), by End-use 2026 & 2034
Figure 21: Europe Deep Learning Market Revenue Share (%), by End-use 2026 & 2034
Figure 22: Europe Deep Learning Market Revenue (Billion), by Deployment 2026 & 2034
Figure 23: Europe Deep Learning Market Revenue Share (%), by Deployment 2026 & 2034
Figure 24: Europe Deep Learning Market Revenue (Billion), by Country 2026 & 2034
Figure 25: Europe Deep Learning Market Revenue Share (%), by Country 2026 & 2034
Figure 26: Asia Pacific Deep Learning Market Revenue (Billion), by Solution 2026 & 2034
Figure 27: Asia Pacific Deep Learning Market Revenue Share (%), by Solution 2026 & 2034
Figure 28: Asia Pacific Deep Learning Market Revenue (Billion), by Hardware 2026 & 2034
Figure 29: Asia Pacific Deep Learning Market Revenue Share (%), by Hardware 2026 & 2034
Figure 30: Asia Pacific Deep Learning Market Revenue (Billion), by Application 2026 & 2034
Figure 31: Asia Pacific Deep Learning Market Revenue Share (%), by Application 2026 & 2034
Figure 32: Asia Pacific Deep Learning Market Revenue (Billion), by End-use 2026 & 2034
Figure 33: Asia Pacific Deep Learning Market Revenue Share (%), by End-use 2026 & 2034
Figure 34: Asia Pacific Deep Learning Market Revenue (Billion), by Deployment 2026 & 2034
Figure 35: Asia Pacific Deep Learning Market Revenue Share (%), by Deployment 2026 & 2034
Figure 36: Asia Pacific Deep Learning Market Revenue (Billion), by Country 2026 & 2034
Figure 37: Asia Pacific Deep Learning Market Revenue Share (%), by Country 2026 & 2034
Figure 38: Latin America Deep Learning Market Revenue (Billion), by Solution 2026 & 2034
Figure 39: Latin America Deep Learning Market Revenue Share (%), by Solution 2026 & 2034
Figure 40: Latin America Deep Learning Market Revenue (Billion), by Hardware 2026 & 2034
Figure 41: Latin America Deep Learning Market Revenue Share (%), by Hardware 2026 & 2034
Figure 42: Latin America Deep Learning Market Revenue (Billion), by Application 2026 & 2034
Figure 43: Latin America Deep Learning Market Revenue Share (%), by Application 2026 & 2034
Figure 44: Latin America Deep Learning Market Revenue (Billion), by End-use 2026 & 2034
Figure 45: Latin America Deep Learning Market Revenue Share (%), by End-use 2026 & 2034
Figure 46: Latin America Deep Learning Market Revenue (Billion), by Deployment 2026 & 2034
Figure 47: Latin America Deep Learning Market Revenue Share (%), by Deployment 2026 & 2034
Figure 48: Latin America Deep Learning Market Revenue (Billion), by Country 2026 & 2034
Figure 49: Latin America Deep Learning Market Revenue Share (%), by Country 2026 & 2034
Figure 50: Middle East & Africa Deep Learning Market Revenue (Billion), by Solution 2026 & 2034
Figure 51: Middle East & Africa Deep Learning Market Revenue Share (%), by Solution 2026 & 2034
Figure 52: Middle East & Africa Deep Learning Market Revenue (Billion), by Hardware 2026 & 2034
Figure 53: Middle East & Africa Deep Learning Market Revenue Share (%), by Hardware 2026 & 2034
Figure 54: Middle East & Africa Deep Learning Market Revenue (Billion), by Application 2026 & 2034
Figure 55: Middle East & Africa Deep Learning Market Revenue Share (%), by Application 2026 & 2034
Figure 56: Middle East & Africa Deep Learning Market Revenue (Billion), by End-use 2026 & 2034
Figure 57: Middle East & Africa Deep Learning Market Revenue Share (%), by End-use 2026 & 2034
Figure 58: Middle East & Africa Deep Learning Market Revenue (Billion), by Deployment 2026 & 2034
Figure 59: Middle East & Africa Deep Learning Market Revenue Share (%), by Deployment 2026 & 2034
Figure 60: Middle East & Africa Deep Learning Market Revenue (Billion), by Country 2026 & 2034
Figure 61: Middle East & Africa Deep Learning Market Revenue Share (%), by Country 2026 & 2034
Table 17:
Table 18: Europe Deep Learning Market Revenue Billion Forecast, by Application 2020 & 2034
Table 19: Europe Deep Learning Market Revenue Billion Forecast, by End-use 2020 & 2034
Table 20: Europe Deep Learning Market Revenue Billion Forecast, by Deployment 2020 & 2034
Table 21: Europe Deep Learning Market Revenue Billion Forecast, by Country 2020 & 2034
Table 22: Germany Deep Learning Market Revenue (Billion) Forecast, by Application 2020 & 2034
Table 23: UK Deep Learning Market Revenue (Billion) Forecast, by Application 2020 & 2034
Table 24: France Deep Learning Market Revenue (Billion) Forecast, by Application 2020 & 2034
Table 25: Italy Deep Learning Market Revenue (Billion) Forecast, by Application 2020 & 2034
Table 26: Asia Pacific Deep Learning Market Revenue Billion Forecast, by Solution 2020 & 2034
Table 27: Asia Pacific Deep Learning Market Revenue Billion Forecast, by Hardware 2020 & 2034
Table 28: Asia Pacific Deep Learning Market Revenue Billion Forecast, by Application 2020 & 2034
Table 29: Asia Pacific Deep Learning Market Revenue Billion Forecast, by End-use 2020 & 2034
Table 30: Asia Pacific Deep Learning Market Revenue Billion Forecast, by Deployment 2020 & 2034
Table 31: Asia Pacific Deep Learning Market Revenue Billion Forecast, by Country 2020 & 2034
Table 32: China Deep Learning Market Revenue (Billion) Forecast, by Application 2020 & 2034
Table 33: Japan Deep Learning Market Revenue (Billion) Forecast, by Application 2020 & 2034
Table 34: India Deep Learning Market Revenue (Billion) Forecast, by Application 2020 & 2034
Table 35: South Korea Deep Learning Market Revenue (Billion) Forecast, by Application 2020 & 2034
Table 36: Australia Deep Learning Market Revenue (Billion) Forecast, by Application 2020 & 2034
Table 37: Latin America Deep Learning Market Revenue Billion Forecast, by Solution 2020 & 2034
Table 38: Latin America Deep Learning Market Revenue Billion Forecast, by Hardware 2020 & 2034
Table 39: Latin America Deep Learning Market Revenue Billion Forecast, by Application 2020 & 2034
Table 40: Latin America Deep Learning Market Revenue Billion Forecast, by End-use 2020 & 2034
Table 41: Latin America Deep Learning Market Revenue Billion Forecast, by Deployment 2020 & 2034
Table 42: Latin America Deep Learning Market Revenue Billion Forecast, by Country 2020 & 2034
Table 43: Brazil Deep Learning Market Revenue (Billion) Forecast, by Application 2020 & 2034
Table 44: Mexico Deep Learning Market Revenue (Billion) Forecast, by Application 2020 & 2034
Table 45: Argentina Deep Learning Market Revenue (Billion) Forecast, by Application 2020 & 2034
Table 46: Middle East & Africa Deep Learning Market Revenue Billion Forecast, by Solution 2020 & 2034
Table 47: Middle East & Africa Deep Learning Market Revenue Billion Forecast, by Hardware 2020 & 2034
Table 48: Middle East & Africa Deep Learning Market Revenue Billion Forecast, by Application 2020 & 2034
Table 49: Middle East & Africa Deep Learning Market Revenue Billion Forecast, by End-use 2020 & 2034
Table 50: Middle East & Africa Deep Learning Market Revenue Billion Forecast, by Deployment 2020 & 2034
Table 51: Middle East & Africa Deep Learning Market Revenue Billion Forecast, by Country 2020 & 2034
Table 52: Saudi Arabia Deep Learning Market Revenue (Billion) Forecast, by Application 2020 & 2034
Table 53: UAE Deep Learning Market Revenue (Billion) Forecast, by Application 2020 & 2034
Table 54: South Africa Deep Learning Market Revenue (Billion) Forecast, by Application 2020 & 2034