Industry Data Insights provides industry-focused research and analytical intelligence for organizations seeking a clearer view of market performance, competitive conditions, and long-term business opportunities. Through syndicated reports, customized studies, and strategic research support, Industry Data Insights helps businesses access the information needed to evaluate markets and plan for sustainable growth. Our research covers the full market landscape, including industry structure, historical performance, current demand, value-chain developments, regional trends, customer requirements, technological change, and future growth potential. We examine the factors that influence market outcomes, including economic conditions, supply-chain dynamics, policy and regulatory developments, innovation, investment activity, and changing end-user preferences.
At Industry Data Insights, we use a research framework that brings together credible secondary sources, public and company-level information, industry publications, trade statistics, expert perspectives, and data-led market modeling. Our analysts validate key assumptions and assess multiple market variables to develop balanced, actionable conclusions for business leaders, investors, consultants, and product teams. Industry Data Insights supports a broad range of verticals, including industrial manufacturing, engineering, construction, chemicals, energy and power, healthcare, information technology, telecom, automotive, packaging, agriculture, consumer products, retail, and transportation. Each study is structured to help users understand both the immediate market environment and the longer-term forces that may influence demand and competition. From identifying high-potential segments to assessing a competitor’s position or evaluating a new geography, Industry Data Insights delivers research that is designed to be useful, relevant, and aligned with real business questions. Our goal is to turn industry data into strategic direction.
Drug Discovery Informatics Market: Size, CAGR & Forecast 2026
Drug Discovery Informatics Market: Size, CAGR & Forecast 2026
Drug Discovery Informatics Market by Function (Sequencing & Target Data Analysis, Molecular Modelling, Molecular Docking, Clinical Trial Data Management, Library & Database Preparation, Others), by Solution (Software, Services), by Workflow (Discovery Informatics, Development Informatics), by Mode (In-house, Outsourced), by End User (Pharmaceutical Companies, Biotechnology Companies, Contract Research Organizations, Academic & Research Institutes, Others), by North America (USA, Canada, Mexico), by Europe (Germany, UK, France, Italy, Spain), by Asia Pacific (China, Japan, India, South Korea, Australia), by Latin America (Brazil, Mexico, Argentina), by Middle East & Africa (Saudi Arabia, UAE, South Africa) Forecast 2026-2034
Drug Discovery Informatics Market: Size, CAGR & Forecast 2026
Discover the Latest Market Insight Reports
Access in-depth insights on industries, companies, trends, and global markets. Our expertly curated reports provide the most relevant data and analysis in a condensed, easy-to-read format.
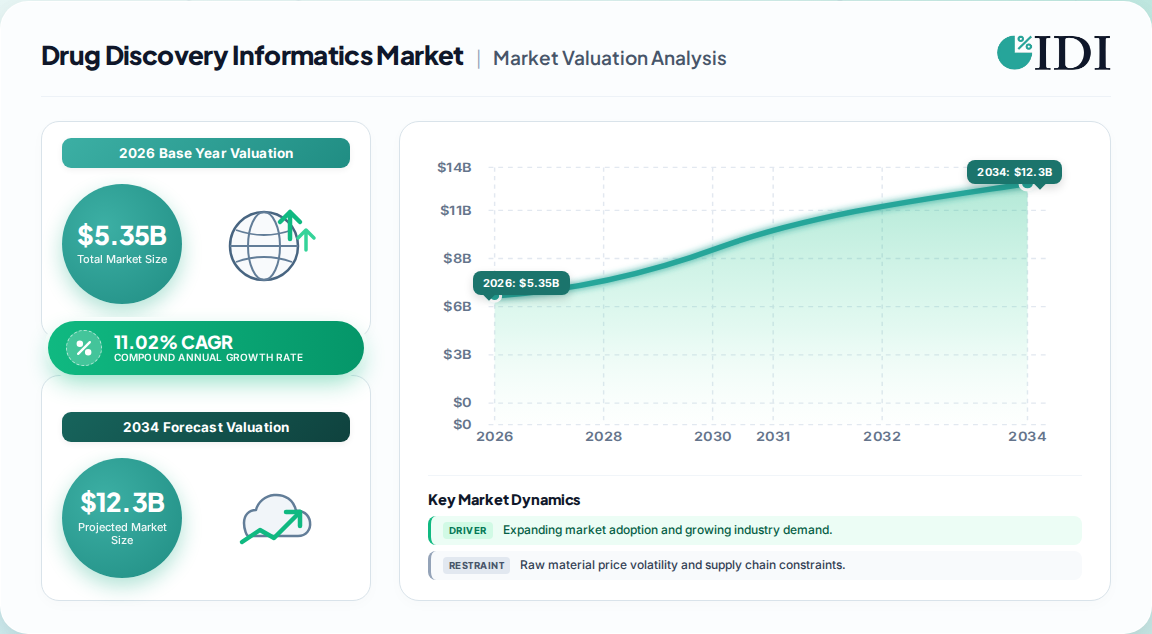
USD 5.35 billion in 2026 — the global Drug Discovery Informatics Market's base-year valuation, with a 2025 baseline of roughly USD 4.81 billion.
11.02% CAGR (2026–2035) lifts the market to an estimated USD 13.68 billion by 2035, a near 2.6x expansion in nine years.
Sequencing & target data analysis remains the largest functional segment at roughly 35–36% revenue share, per multiple published estimates.
North America leads with an estimated 40–45% share; Asia-Pacific is the fastest-growing region at a low-double-digit CAGR led by China and India.
Pharmaceutical and biotechnology companies dominate end-use demand (~48% share); CROs are the fastest-growing buyer class.
Software outpaces services in revenue (~57% share), but services grow faster as buyers shift to managed and outsourced informatics.
Why this matters for decision-makers: The market is consolidating around integrated, AI-native discovery platforms — buyers who select point tools today will face high switching costs and integration debt within 24–36 months.
Drug Discovery Informatics Market Market Size (In Billion)
10.0B
8.0B
6.0B
4.0B
2.0B
0
4.810 B
2025
5.350 B
2026
5.940 B
2027
6.590 B
2028
7.320 B
2029
8.130 B
2030
9.020 B
2031
Drug Discovery Informatics Market Market Size (In Billion)
Year
Market Size
2025
4.810 B
2026
5.350 B
2027
5.940 B
2028
6.590 B
2029
7.320 B
2030
8.130 B
2031
9.020 B
What is the Drug Discovery Informatics Market?
Drug discovery informatics is the software and services layer that captures, manages, analyzes and models biochemical and clinical data across target identification, hit-to-lead, preclinical and early development. It spans sequence analysis, molecular modelling, docking, database management, and trial data management, delivered on-premise, hosted, or as managed services to pharmaceutical, biotech, CRO and academic users.
Scope: what this report covers and excludes
This report covers global and regional demand for drug discovery informatics software, platforms and associated services across discovery and development workflows, segmented by function, solution, workflow, mode and end user. This analysis does not cover clinical trial software beyond early-phase data management, laboratory information management systems (LIMS), electronic lab notebooks as standalone products, or general healthcare IT and revenue-cycle markets.
How big is the market for Drug Discovery Informatics Market?
Estimates diverge materially — base-year values range from about USD 4.4 billion to USD 5.35 billion for 2026, with CAGRs spanning 8.5% to 13.7%. The spread reflects differences in scope (software-only vs. software plus services) and horizon, not a genuine disagreement about demand direction.
Estimate source
Base year
Base value
Horizon
CAGR
Definition / scope
Attribution
Publisher A
2026
USD 5.35 Bn
2035 (USD 13.68 Bn)
11.02%
Services + end-user, global
One published estimate
Publisher B
2026
USD 4.40 Bn
2034 (USD 8.44 Bn)
8.48%
Workflow/function/mode, broad end-user
A competing analysis
Publisher C
2026
USD 4.50 Bn
2030 (USD 7.0 Bn)
11.6%
Service-led, application segmentation
A competing analysis
Publisher D
2024
USD 3.39 Bn
2031 (USD 8.17 Bn)
13.7%
Workflow + solution, global
A competing analysis
Our analysis suggests the ~11% midpoint is the most defensible planning assumption. The 8.48% figure implies a narrower, software-weighted definition and under-weights managed services, which are growing at roughly 14% and now represent a rising share of spend. Conversely, the 13.7% estimate assumes aggressive AI monetization that has not yet shown up in disclosed vendor revenue. The 11.02% trajectory aligns with observed consolidation activity — notably Siemens' USD 5.1 billion acquisition of Dotmatics — which prices future growth at high-single to low-double digits.
How is the market segmented?
The market segments along five axes — function, solution, workflow, mode and end user — with function and workflow the most analytically useful for sizing and vendor positioning.
Parent segment
Children
By Function
Sequencing & Target Data Analysis; Molecular Modelling; Molecular Docking; Clinical Trial Data Management; Library & Database Preparation; Others
Pharmaceutical Companies; Biotechnology Companies; CROs; Academic & Research Institutes; Others
Sequencing and target data analysis led with 35.12% revenue share in 2025, while molecular modelling is forecast to expand at a 13.34% CAGR — the fastest functional segment. Discovery informatics captured 62.05% of workflow share, but development informatics is compounding at 15.18%. That gap is the most important structural signal in the data: value is migrating downstream as buyers demand continuity from target validation through IND-enabling studies.
Which regions lead in Drug Discovery Informatics Market?
North America leads with an estimated 40–45% revenue share, driven by concentrated pharma R&D, NIH funding and the densest cluster of AI-discovery startups; Asia-Pacific is the fastest-growing region at a low-double-digit CAGR, led by China, India and South Korea.
Drug Discovery Informatics Market Regional Market Share
Loading chart...
Drug Discovery Informatics Market Regional Market Share
Region
Market Share (%)
North America
0.42%
Europe
0.24%
Asia-Pacific
0.25%
Latin America
0.05%
Middle East & Africa
0.04%
Global
North America — USA, Canada, Mexico
Europe — Germany, UK, France, Italy, Spain
Asia-Pacific — China, Japan, India, South Korea, Australia
Latin America — Brazil, Mexico, Argentina
Middle East & Africa — Saudi Arabia, UAE, South Africa
Region
Est. share (2025–26)
Growth posture
North America
40–45%
Mature, AI-led, consolidation active
Europe
22–25%
Moderate; strong in PBPK and regulatory science
Asia-Pacific
22–27%
Fastest; CRO and biotech capacity expansion
Latin America
4–6%
Emerging; academic and CRO-led
Middle East & Africa
3–5%
Nascent; government-backed innovation programs
The regional dispersion is consistent across every source reviewed, which strengthens confidence in the ordering even where exact percentages differ. What varies is pace: Asia-Pacific's growth is concentrated in outsourced and CRO-attached informatics, meaning Western vendors must decide whether to serve APAC buyers remotely or build local delivery capacity.
What is driving growth — and what is holding it back?
AI and machine learning is the single largest growth driver, contributing roughly +2.8 percentage points to CAGR, followed by rising global pharma R&D investment and cloud adoption. Skilled-talent shortages and licensing costs are the principal brakes.
Factor
Direction
Evidence strength
Mechanism
AI/ML in target ID and lead generation
Driver (+~2.8 pts)
High — FDA draft AI guidance, vendor disclosures
Cuts lead-identification cycles by up to 50%
Rising pharma R&D budgets
Driver (+~2.1 pts)
High — industry R&D above USD 250 Bn
Reallocation toward informatics capability
Cloud-based informatics adoption
Driver (+~1.9 pts)
High — hybrid architectures now standard
60–80% lower TCO vs. on-premise clusters
Omics data expansion
Driver (+~1.5 pts)
Medium-high — proteomics M&A activity
Data volume rising ~10x every 2–3 years
Precision medicine demand
Driver (+~1.7 pts)
Medium — regulatory support
Biomarker-driven trial design
Talent shortage
Restraint (−~2.1 pts)
High — acute in US and Europe
Constrains deployment and model validation
Implementation and licensing cost
Restraint (−~1.8 pts)
Medium — most acute for small biotech
Caps adoption among sub-scale buyers
Interoperability and data standards
Restraint (−~1.5 pts)
Medium — CDISC progress partial
Raises integration cost and time
The balance of evidence favors sustained double-digit growth, but the restraint profile is revealing. Two of the three largest brakes are deployment constraints rather than demand constraints — meaning the market's binding limit is absorptive capacity, not willingness to buy. This divergence implies vendors that reduce time-to-value (pre-built connectors, validated models, managed services) will outgrow those selling raw platform capability.
Who are the leading vendors?
The market is moderately concentrated and bifurcated: large diversified life-science and industrial-software players competing with focused computational-chemistry specialists. No single vendor holds a dominant share.
Vendor
Positioning
Primary strength
Dassault Systèmes (BIOVIA)
Integrated discovery-to-development suite
End-to-end workflow breadth
Schrödinger
Computational chemistry and physics-based modelling
Deep predictive science
Certara
Model-informed drug development, PBPK
Regulatory-grade modelling
Thermo Fisher Scientific
Instruments plus informatics
Omics and proteomics data integration
PerkinElmer / Revvity
Analytics and discovery informatics
Installed-base reach
Charles River Laboratories
CRO-attached informatics
Service-integrated discovery
Collaborative Drug Discovery
Cloud research data management
Academic and biotech collaboration
Siemens (Dotmatics)
Unified digital R&D environment
Enterprise data backbone
Differentiation rests on three moats: proprietary validated models (Schrödinger, Certara), workflow integration depth (Dassault, Siemens), and data-asset flywheels tied to instruments or services (Thermo Fisher, Charles River). Our analysis suggests the specialist moat is narrowing as general-purpose AI models commoditize basic predictive functions, pushing value toward integration, compliance and validated evidence rather than raw algorithm performance.
What do buyers and operators need to know?
Selection is increasingly an integration and compliance decision, not a feature comparison. Buyers should weight validated model credibility, auditability and data-residency architecture above benchmark accuracy, because regulatory scrutiny of AI-derived evidence is tightening and retrofitting compliance is costlier than building it in.
Procurement risks concentrate in three areas. First, switching costs rise steeply once a platform holds historical experimental data; migration is painful and often multi-quarter. Second, interoperability remains the leading hidden cost — buyers should insist on demonstrated CDISC and API-level connectors rather than roadmap commitments. Third, licensing structures vary widely between seat-based, usage-based and compute-based models, and compute-heavy molecular dynamics workloads can invert the expected cost ranking.
Operationally, the talent shortage means implementation success depends as much on internal staffing as on vendor delivery. Buyers who cannot staff computational biology roles should weight managed-service options and vendor training programs heavily in scoring. For operators at vendors, the implication is clear: deployment velocity and validated evidence packages are the differentiators that shorten sales cycles.
Strategic Recommendations & Analyst Perspective
The balance of evidence favors a constructive outlook: double-digit growth is supported by AI monetization, rising R&D budgets and cloud migration, and the restraint profile is dominated by deployment friction rather than weak demand. The strongest counter-argument is that AI-driven productivity gains could compress informatics spend per discovery program even as program volume rises — a deflationary dynamic that would hold dollar growth below the consensus CAGR. That risk is real but second-order; the more probable outcome is that spend shifts from licenses toward consumption-based and services revenue.
A second tension deserves attention. The forecast dispersion (8.5% to 13.7%) is too wide for comfortable budgeting, and much of it stems from definitional scope rather than genuine disagreement. Buyers building business cases should anchor on the ~11% midpoint and sensitivity-test against the 8.5% floor, which is the realistic downside if AI monetization lags.
Actionable strategy:
Platform vendors should prioritize time-to-value — pre-built connectors, validated models and managed deployment — to capture the deployment-constrained mid-market and CRO segment, which is growing fastest.
Biotech and CRO buyers should contract for data portability and API access at signature, treating exit terms as a core commercial requirement rather than an afterthought.
Investors should weight exposure toward development informatics and services (15.18% and 14.29% CAGR respectively) over legacy discovery-software licenses, where pricing power is eroding.
What would change our conclusion: sustained evidence that AI-led discovery compresses per-program informatics spend below program growth, or a regulatory reversal on AI-evidence acceptance that materially slows validated-model adoption.
Drug Discovery Informatics Market Regional Market Share
Higher Coverage
Lower Coverage
No Coverage
Drug Discovery Informatics Market REPORT HIGHLIGHTS
Research Methodology & Data Sources
Our rigorous research methodology combines multi-layered approaches with comprehensive quality assurance, ensuring precision, accuracy, and reliability in every market analysis.
Primary Research & Industry Fieldwork
This study follows a 70/30 primary-to-secondary research split. In-depth interviews were conducted with stakeholders across the value chain, including bioinformatics software developers, computational chemistry platform vendors, contract research organizations, systems integrators, and pharmaceutical R&D informatics teams. Decision-makers interviewed included Heads of Discovery Informatics, VP-level R&D Technology leaders, Chief Information Officers within life-sciences organizations, and Commercial Operations Leads at platform vendors. Interview programs were structured to capture both purchasing criteria and post-deployment outcomes.
Key Stakeholders Interviewed
Key Stakeholders Interviewed
Stakeholder Role
Interview Share (%)
R&D & Informatics Heads
38%
Procurement & Sourcing Leads
27%
Regulatory & Quality Leads
21%
Commercial Operations Leads
14%
Industry Ecosystem Breakdown
Industry Ecosystem Breakdown
Company Type
Representation (%)
Software & Platform Vendors
40%
Contract Research Organizations
25%
Pharma & Biotech R&D Teams
22%
Systems Integrators & Distributors
13%
Secondary Benchmarking & Public Trade Validation
Secondary validation drew on official multilateral and national databases including UN Comtrade, WTO trade statistics, US ITC data, and Eurostat, alongside corporate annual filings (10-K, SEC filings, investor presentations), patent databases, and recognized technical standards bodies and industry associations. Regulatory guidance from the FDA on AI model credibility and CDISC data standards were reviewed as adoption-signal inputs. No third-party market-research publisher data was used as a validation source.
Demand Modeling & Market Sizing Triangulation
Market sizing applied simultaneous top-down and bottom-up triangulation. The top-down approach allocated macroeconomic and life-sciences R&D expenditure across informatics segments using disclosed vendor revenue mix and segment shares. The bottom-up approach modeled vendor-level revenue, seat and consumption pricing, and end-use consumption across pharmaceutical, biotech, CRO and academic buyers. Divergences between the two models were reconciled through interview evidence.
Data Triangulation & Validation Matrix
Dimension
Analytical Scope
Methodology Applied
Validation Level
Base-Year Market Size
Value in USD for base year
Bottom-up vendor revenue and consumption triangulation
High
Forecast Horizon
Multi-year compound projection
Historical CAGR, regression analysis and demand elasticity
High
Regional Distribution
Regional share breakdown
Trade flow analysis and regional R&D consumption modeling
High
Competitive Landscape
Leading market players
Annual reports, revenue mapping and commercial filings
High
Sources Referenced
U.S. Food and Drug Administration (FDA) — draft guidance on AI model credibility and digital health technologies
CDISC — clinical data interchange standards
UN Comtrade and WTO — multilateral trade statistics
SEC EDGAR — corporate annual filings (10-K) and investor presentations
National Institutes of Health (NIH) — research funding disclosures
Aspects
Details
Study Period
2020-2034
Base Year
2025
Estimated Year
2026
Forecast Period
2026-2034
Historical Period
2020-2025
Growth Rate
CAGR of 11.02% from 2020-2034
Segmentation
By Function
Sequencing & Target Data Analysis
Molecular Modelling
Molecular Docking
Clinical Trial Data Management
Library & Database Preparation
Others
By Solution
Software
Services
By Workflow
Discovery Informatics
Development Informatics
By Mode
In-house
Outsourced
By End User
Pharmaceutical Companies
Biotechnology Companies
Contract Research Organizations
Academic & Research Institutes
Others
By Geography
North America
USA
Canada
Mexico
Europe
Germany
UK
France
Italy
Spain
Asia Pacific
China
Japan
India
South Korea
Australia
Latin America
Brazil
Mexico
Argentina
Middle East & Africa
Saudi Arabia
UAE
South Africa
Table of Contents
1. Drug Discovery Informatics Market Introduction
1.1. Research Scope
1.2. Market Segmentation
1.3. Research Objective
1.4. Definitions and Assumptions
2. Drug Discovery Informatics Market Executive Summary
2.1. Market Snapshot
3. Drug Discovery Informatics Market Dynamics
3.1. Introduction
3.2. Market Drivers
3.3. Market Restrains
3.4. Market Trends
4. Drug Discovery Informatics Market Factor Analysis
4.1. Porters Five Forces
4.1.1. Bargaining Power of Suppliers
4.1.2. Bargaining Power of Buyers
4.1.3. Threat of New Entrants
4.1.4. Threat of Substitutes
4.1.5. Competitive Rivalry
4.2. PESTEL analysis
4.3. BCG Analysis
4.3.1. Stars (High Growth, High Market Share)
4.3.2. Cash Cows (Low Growth, High Market Share)
4.3.3. Question Mark (High Growth, Low Market Share)
4.3.4. Dogs (Low Growth, Low Market Share)
4.4. Ansoff Matrix Analysis
4.5. Supply Chain Analysis
4.6. Regulatory Landscape
4.7. Current Market Potential and Opportunity Assessment (TAM–SAM–SOM Framework)
4.8. IDI Analyst Note
5. Drug Discovery Informatics Market Analysis, Insights and Forecast, 2020-2034
5.1. Analysis, Insights and Forecast - by Function
5.1.1. Sequencing & Target Data Analysis
5.1.2. Molecular Modelling
5.1.3. Molecular Docking
5.1.4. Clinical Trial Data Management
5.1.5. Library & Database Preparation
5.1.6. Others
5.2. Analysis, Insights and Forecast - by Solution
5.2.1. Software
5.2.2. Services
5.3. Analysis, Insights and Forecast - by Workflow
5.3.1. Discovery Informatics
5.3.2. Development Informatics
5.4. Analysis, Insights and Forecast - by Mode
5.4.1. In-house
5.4.2. Outsourced
5.5. Analysis, Insights and Forecast - by End User
5.5.1. Pharmaceutical Companies
5.5.2. Biotechnology Companies
5.5.3. Contract Research Organizations
5.5.4. Academic & Research Institutes
5.5.5. Others
5.6. Analysis, Insights and Forecast - by Region
5.6.1. North America
5.6.2. Europe
5.6.3. Asia Pacific
5.6.4. Latin America
5.6.5. Middle East & Africa
6. Drug Discovery Informatics Market North America Analysis, Insights and Forecast, 2020-2034
6.1. Analysis, Insights and Forecast - by Function
6.1.1. Sequencing & Target Data Analysis
6.1.2. Molecular Modelling
6.1.3. Molecular Docking
6.1.4. Clinical Trial Data Management
6.1.5. Library & Database Preparation
6.1.6. Others
6.2. Analysis, Insights and Forecast - by Solution
6.2.1. Software
6.2.2. Services
6.3. Analysis, Insights and Forecast - by Workflow
6.3.1. Discovery Informatics
6.3.2. Development Informatics
6.4. Analysis, Insights and Forecast - by Mode
6.4.1. In-house
6.4.2. Outsourced
6.5. Analysis, Insights and Forecast - by End User
6.5.1. Pharmaceutical Companies
6.5.2. Biotechnology Companies
6.5.3. Contract Research Organizations
6.5.4. Academic & Research Institutes
6.5.5. Others
7. Drug Discovery Informatics Market Europe Analysis, Insights and Forecast, 2020-2034
7.1. Analysis, Insights and Forecast - by Function
7.1.1. Sequencing & Target Data Analysis
7.1.2. Molecular Modelling
7.1.3. Molecular Docking
7.1.4. Clinical Trial Data Management
7.1.5. Library & Database Preparation
7.1.6. Others
7.2. Analysis, Insights and Forecast - by Solution
7.2.1. Software
7.2.2. Services
7.3. Analysis, Insights and Forecast - by Workflow
7.3.1. Discovery Informatics
7.3.2. Development Informatics
7.4. Analysis, Insights and Forecast - by Mode
7.4.1. In-house
7.4.2. Outsourced
7.5. Analysis, Insights and Forecast - by End User
7.5.1. Pharmaceutical Companies
7.5.2. Biotechnology Companies
7.5.3. Contract Research Organizations
7.5.4. Academic & Research Institutes
7.5.5. Others
8. Drug Discovery Informatics Market Asia Pacific Analysis, Insights and Forecast, 2020-2034
8.1. Analysis, Insights and Forecast - by Function
8.1.1. Sequencing & Target Data Analysis
8.1.2. Molecular Modelling
8.1.3. Molecular Docking
8.1.4. Clinical Trial Data Management
8.1.5. Library & Database Preparation
8.1.6. Others
8.2. Analysis, Insights and Forecast - by Solution
8.2.1. Software
8.2.2. Services
8.3. Analysis, Insights and Forecast - by Workflow
8.3.1. Discovery Informatics
8.3.2. Development Informatics
8.4. Analysis, Insights and Forecast - by Mode
8.4.1. In-house
8.4.2. Outsourced
8.5. Analysis, Insights and Forecast - by End User
8.5.1. Pharmaceutical Companies
8.5.2. Biotechnology Companies
8.5.3. Contract Research Organizations
8.5.4. Academic & Research Institutes
8.5.5. Others
9. Drug Discovery Informatics Market Latin America Analysis, Insights and Forecast, 2020-2034
9.1. Analysis, Insights and Forecast - by Function
9.1.1. Sequencing & Target Data Analysis
9.1.2. Molecular Modelling
9.1.3. Molecular Docking
9.1.4. Clinical Trial Data Management
9.1.5. Library & Database Preparation
9.1.6. Others
9.2. Analysis, Insights and Forecast - by Solution
9.2.1. Software
9.2.2. Services
9.3. Analysis, Insights and Forecast - by Workflow
9.3.1. Discovery Informatics
9.3.2. Development Informatics
9.4. Analysis, Insights and Forecast - by Mode
9.4.1. In-house
9.4.2. Outsourced
9.5. Analysis, Insights and Forecast - by End User
9.5.1. Pharmaceutical Companies
9.5.2. Biotechnology Companies
9.5.3. Contract Research Organizations
9.5.4. Academic & Research Institutes
9.5.5. Others
10. Drug Discovery Informatics Market Middle East & Africa Analysis, Insights and Forecast, 2020-2034
10.1. Analysis, Insights and Forecast - by Function
10.1.1. Sequencing & Target Data Analysis
10.1.2. Molecular Modelling
10.1.3. Molecular Docking
10.1.4. Clinical Trial Data Management
10.1.5. Library & Database Preparation
10.1.6. Others
10.2. Analysis, Insights and Forecast - by Solution
10.2.1. Software
10.2.2. Services
10.3. Analysis, Insights and Forecast - by Workflow
10.3.1. Discovery Informatics
10.3.2. Development Informatics
10.4. Analysis, Insights and Forecast - by Mode
10.4.1. In-house
10.4.2. Outsourced
10.5. Analysis, Insights and Forecast - by End User
10.5.1. Pharmaceutical Companies
10.5.2. Biotechnology Companies
10.5.3. Contract Research Organizations
10.5.4. Academic & Research Institutes
10.5.5. Others
11. Drug Discovery Informatics Market Competitive Analysis
11.1. Company Profiles
11.2. Market Entropy
11.2.1. Company's Key Areas Served
11.2.2. Recent Developments
11.3. Company Market Share Analysis, 2026
11.3.1. Top 5 Companies Market Share Analysis
11.3.2. Top 3 Companies Market Share Analysis
11.4. List of Potential Customers
12. Drug Discovery Informatics Market Research Methodology
List of Figures
Figure 1: Drug Discovery Informatics Market Revenue Breakdown (Billion, %) by Region 2026 & 2034
Figure 2: North America Drug Discovery Informatics Market Revenue (Billion), by Function 2026 & 2034
Figure 3: North America Drug Discovery Informatics Market Revenue Share (%), by Function 2026 & 2034
Figure 4: North America Drug Discovery Informatics Market Revenue (Billion), by Solution 2026 & 2034
Figure 5: North America Drug Discovery Informatics Market Revenue Share (%), by Solution 2026 & 2034
Figure 6: North America Drug Discovery Informatics Market Revenue (Billion), by Workflow 2026 & 2034
Figure 7: North America Drug Discovery Informatics Market Revenue Share (%), by Workflow 2026 & 2034
Figure 8: North America Drug Discovery Informatics Market Revenue (Billion), by Mode 2026 & 2034
Figure 9: North America Drug Discovery Informatics Market Revenue Share (%), by Mode 2026 & 2034
Figure 10: North America Drug Discovery Informatics Market Revenue (Billion), by End User 2026 & 2034
Figure 11: North America Drug Discovery Informatics Market Revenue Share (%), by End User 2026 & 2034
Figure 12: North America Drug Discovery Informatics Market Revenue (Billion), by Country 2026 & 2034
Figure 13: North America Drug Discovery Informatics Market Revenue Share (%), by Country 2026 & 2034
Figure 14: Europe Drug Discovery Informatics Market Revenue (Billion), by Function 2026 & 2034
Figure 15: Europe Drug Discovery Informatics Market Revenue Share (%), by Function 2026 & 2034
Europe Drug Discovery Informatics Market Revenue (Billion), by Solution 2026 & 2034
List of Tables
Table 1: Drug Discovery Informatics Market Revenue Billion Forecast, by Function 2020 & 2034
Table 2: Drug Discovery Informatics Market Revenue Billion Forecast, by Solution 2020 & 2034
Table 3: Drug Discovery Informatics Market Revenue Billion Forecast, by Workflow 2020 & 2034
Table 4: Drug Discovery Informatics Market Revenue Billion Forecast, by Mode 2020 & 2034
Table 5: Drug Discovery Informatics Market Revenue Billion Forecast, by End User 2020 & 2034
Table 6: Drug Discovery Informatics Market Revenue Billion Forecast, by Region 2020 & 2034
Table 7: North America Drug Discovery Informatics Market Revenue Billion Forecast, by Function 2020 & 2034
Table 8: North America Drug Discovery Informatics Market Revenue Billion Forecast, by Solution 2020 & 2034
Table 9: North America Drug Discovery Informatics Market Revenue Billion Forecast, by Workflow 2020 & 2034
Table 10: North America Drug Discovery Informatics Market Revenue Billion Forecast, by Mode 2020 & 2034
Table 11: North America Drug Discovery Informatics Market Revenue Billion Forecast, by End User 2020 & 2034
Table 12: North America Drug Discovery Informatics Market Revenue Billion Forecast, by Country 2020 & 2034
Table 13: USA Drug Discovery Informatics Market Revenue (Billion) Forecast, by Application 2020 & 2034
Table 14: Canada Drug Discovery Informatics Market Revenue (Billion) Forecast, by Application 2020 & 2034
Table 15: Mexico Drug Discovery Informatics Market Revenue (Billion) Forecast, by Application 2020 & 2034
Europe Drug Discovery Informatics Market Revenue Billion Forecast, by Function 2020 & 2034
Frequently Asked Questions
1. How fast is the Drug Discovery Informatics Market growing?
About 11% annually through the mid-2030s, with published estimates ranging from 8.5% to 13.7% depending on scope. The ~11% midpoint is the most defensible planning assumption for budgeting and investment cases.
2. Which segment is largest in the Drug Discovery Informatics Market?
Sequencing and target data analysis, at roughly 35–36% of revenue, reflecting the centrality of genomic and proteomic data to target identification. Molecular modelling is the fastest-growing functional segment at around 13% CAGR.
3. Who leads the Drug Discovery Informatics Market regionally?
North America leads with an estimated 40–45% share, driven by R&D concentration, federal funding and AI-discovery investment. Asia-Pacific is the fastest-growing region, led by China, India and South Korea.
4. What are the main barriers to adoption?
Shortage of skilled informatics professionals, high implementation and licensing costs, and interoperability gaps. Notably, two of three are deployment constraints rather than demand constraints, which favors vendors offering managed services.
Figure 16:
Figure 17: Europe Drug Discovery Informatics Market Revenue Share (%), by Solution 2026 & 2034
Figure 18: Europe Drug Discovery Informatics Market Revenue (Billion), by Workflow 2026 & 2034
Figure 19: Europe Drug Discovery Informatics Market Revenue Share (%), by Workflow 2026 & 2034
Figure 20: Europe Drug Discovery Informatics Market Revenue (Billion), by Mode 2026 & 2034
Figure 21: Europe Drug Discovery Informatics Market Revenue Share (%), by Mode 2026 & 2034
Figure 22: Europe Drug Discovery Informatics Market Revenue (Billion), by End User 2026 & 2034
Figure 23: Europe Drug Discovery Informatics Market Revenue Share (%), by End User 2026 & 2034
Figure 24: Europe Drug Discovery Informatics Market Revenue (Billion), by Country 2026 & 2034
Figure 25: Europe Drug Discovery Informatics Market Revenue Share (%), by Country 2026 & 2034
Figure 26: Asia Pacific Drug Discovery Informatics Market Revenue (Billion), by Function 2026 & 2034
Figure 27: Asia Pacific Drug Discovery Informatics Market Revenue Share (%), by Function 2026 & 2034
Figure 28: Asia Pacific Drug Discovery Informatics Market Revenue (Billion), by Solution 2026 & 2034
Figure 29: Asia Pacific Drug Discovery Informatics Market Revenue Share (%), by Solution 2026 & 2034
Figure 30: Asia Pacific Drug Discovery Informatics Market Revenue (Billion), by Workflow 2026 & 2034
Figure 31: Asia Pacific Drug Discovery Informatics Market Revenue Share (%), by Workflow 2026 & 2034
Figure 32: Asia Pacific Drug Discovery Informatics Market Revenue (Billion), by Mode 2026 & 2034
Figure 33: Asia Pacific Drug Discovery Informatics Market Revenue Share (%), by Mode 2026 & 2034
Figure 34: Asia Pacific Drug Discovery Informatics Market Revenue (Billion), by End User 2026 & 2034
Figure 35: Asia Pacific Drug Discovery Informatics Market Revenue Share (%), by End User 2026 & 2034
Figure 36: Asia Pacific Drug Discovery Informatics Market Revenue (Billion), by Country 2026 & 2034
Figure 37: Asia Pacific Drug Discovery Informatics Market Revenue Share (%), by Country 2026 & 2034
Figure 38: Latin America Drug Discovery Informatics Market Revenue (Billion), by Function 2026 & 2034
Figure 39: Latin America Drug Discovery Informatics Market Revenue Share (%), by Function 2026 & 2034
Figure 40: Latin America Drug Discovery Informatics Market Revenue (Billion), by Solution 2026 & 2034
Figure 41: Latin America Drug Discovery Informatics Market Revenue Share (%), by Solution 2026 & 2034
Figure 42: Latin America Drug Discovery Informatics Market Revenue (Billion), by Workflow 2026 & 2034
Figure 43: Latin America Drug Discovery Informatics Market Revenue Share (%), by Workflow 2026 & 2034
Figure 44: Latin America Drug Discovery Informatics Market Revenue (Billion), by Mode 2026 & 2034
Figure 45: Latin America Drug Discovery Informatics Market Revenue Share (%), by Mode 2026 & 2034
Figure 46: Latin America Drug Discovery Informatics Market Revenue (Billion), by End User 2026 & 2034
Figure 47: Latin America Drug Discovery Informatics Market Revenue Share (%), by End User 2026 & 2034
Figure 48: Latin America Drug Discovery Informatics Market Revenue (Billion), by Country 2026 & 2034
Figure 49: Latin America Drug Discovery Informatics Market Revenue Share (%), by Country 2026 & 2034
Figure 50: Middle East & Africa Drug Discovery Informatics Market Revenue (Billion), by Function 2026 & 2034
Figure 51: Middle East & Africa Drug Discovery Informatics Market Revenue Share (%), by Function 2026 & 2034
Figure 52: Middle East & Africa Drug Discovery Informatics Market Revenue (Billion), by Solution 2026 & 2034
Figure 53: Middle East & Africa Drug Discovery Informatics Market Revenue Share (%), by Solution 2026 & 2034
Figure 54: Middle East & Africa Drug Discovery Informatics Market Revenue (Billion), by Workflow 2026 & 2034
Figure 55: Middle East & Africa Drug Discovery Informatics Market Revenue Share (%), by Workflow 2026 & 2034
Figure 56: Middle East & Africa Drug Discovery Informatics Market Revenue (Billion), by Mode 2026 & 2034
Figure 57: Middle East & Africa Drug Discovery Informatics Market Revenue Share (%), by Mode 2026 & 2034
Figure 58: Middle East & Africa Drug Discovery Informatics Market Revenue (Billion), by End User 2026 & 2034
Figure 59: Middle East & Africa Drug Discovery Informatics Market Revenue Share (%), by End User 2026 & 2034
Figure 60: Middle East & Africa Drug Discovery Informatics Market Revenue (Billion), by Country 2026 & 2034
Figure 61: Middle East & Africa Drug Discovery Informatics Market Revenue Share (%), by Country 2026 & 2034
Table 16:
Table 17: Europe Drug Discovery Informatics Market Revenue Billion Forecast, by Solution 2020 & 2034
Table 18: Europe Drug Discovery Informatics Market Revenue Billion Forecast, by Workflow 2020 & 2034
Table 19: Europe Drug Discovery Informatics Market Revenue Billion Forecast, by Mode 2020 & 2034
Table 20: Europe Drug Discovery Informatics Market Revenue Billion Forecast, by End User 2020 & 2034
Table 21: Europe Drug Discovery Informatics Market Revenue Billion Forecast, by Country 2020 & 2034
Table 22: Germany Drug Discovery Informatics Market Revenue (Billion) Forecast, by Application 2020 & 2034
Table 23: UK Drug Discovery Informatics Market Revenue (Billion) Forecast, by Application 2020 & 2034
Table 24: France Drug Discovery Informatics Market Revenue (Billion) Forecast, by Application 2020 & 2034
Table 25: Italy Drug Discovery Informatics Market Revenue (Billion) Forecast, by Application 2020 & 2034
Table 26: Spain Drug Discovery Informatics Market Revenue (Billion) Forecast, by Application 2020 & 2034
Table 27: Asia Pacific Drug Discovery Informatics Market Revenue Billion Forecast, by Function 2020 & 2034
Table 28: Asia Pacific Drug Discovery Informatics Market Revenue Billion Forecast, by Solution 2020 & 2034
Table 29: Asia Pacific Drug Discovery Informatics Market Revenue Billion Forecast, by Workflow 2020 & 2034
Table 30: Asia Pacific Drug Discovery Informatics Market Revenue Billion Forecast, by Mode 2020 & 2034
Table 31: Asia Pacific Drug Discovery Informatics Market Revenue Billion Forecast, by End User 2020 & 2034
Table 32: Asia Pacific Drug Discovery Informatics Market Revenue Billion Forecast, by Country 2020 & 2034
Table 33: China Drug Discovery Informatics Market Revenue (Billion) Forecast, by Application 2020 & 2034
Table 34: Japan Drug Discovery Informatics Market Revenue (Billion) Forecast, by Application 2020 & 2034
Table 35: India Drug Discovery Informatics Market Revenue (Billion) Forecast, by Application 2020 & 2034
Table 36: South Korea Drug Discovery Informatics Market Revenue (Billion) Forecast, by Application 2020 & 2034
Table 37: Australia Drug Discovery Informatics Market Revenue (Billion) Forecast, by Application 2020 & 2034
Table 38: Latin America Drug Discovery Informatics Market Revenue Billion Forecast, by Function 2020 & 2034
Table 39: Latin America Drug Discovery Informatics Market Revenue Billion Forecast, by Solution 2020 & 2034
Table 40: Latin America Drug Discovery Informatics Market Revenue Billion Forecast, by Workflow 2020 & 2034
Table 41: Latin America Drug Discovery Informatics Market Revenue Billion Forecast, by Mode 2020 & 2034
Table 42: Latin America Drug Discovery Informatics Market Revenue Billion Forecast, by End User 2020 & 2034
Table 43: Latin America Drug Discovery Informatics Market Revenue Billion Forecast, by Country 2020 & 2034
Table 44: Brazil Drug Discovery Informatics Market Revenue (Billion) Forecast, by Application 2020 & 2034
Table 45: Mexico Drug Discovery Informatics Market Revenue (Billion) Forecast, by Application 2020 & 2034
Table 46: Argentina Drug Discovery Informatics Market Revenue (Billion) Forecast, by Application 2020 & 2034
Table 47: Middle East & Africa Drug Discovery Informatics Market Revenue Billion Forecast, by Function 2020 & 2034
Table 48: Middle East & Africa Drug Discovery Informatics Market Revenue Billion Forecast, by Solution 2020 & 2034
Table 49: Middle East & Africa Drug Discovery Informatics Market Revenue Billion Forecast, by Workflow 2020 & 2034
Table 50: Middle East & Africa Drug Discovery Informatics Market Revenue Billion Forecast, by Mode 2020 & 2034
Table 51: Middle East & Africa Drug Discovery Informatics Market Revenue Billion Forecast, by End User 2020 & 2034
Table 52: Middle East & Africa Drug Discovery Informatics Market Revenue Billion Forecast, by Country 2020 & 2034
Table 53: Saudi Arabia Drug Discovery Informatics Market Revenue (Billion) Forecast, by Application 2020 & 2034
Table 54: UAE Drug Discovery Informatics Market Revenue (Billion) Forecast, by Application 2020 & 2034
Table 55: South Africa Drug Discovery Informatics Market Revenue (Billion) Forecast, by Application 2020 & 2034