Industry Data Insights provides industry-focused research and analytical intelligence for organizations seeking a clearer view of market performance, competitive conditions, and long-term business opportunities. Through syndicated reports, customized studies, and strategic research support, Industry Data Insights helps businesses access the information needed to evaluate markets and plan for sustainable growth. Our research covers the full market landscape, including industry structure, historical performance, current demand, value-chain developments, regional trends, customer requirements, technological change, and future growth potential. We examine the factors that influence market outcomes, including economic conditions, supply-chain dynamics, policy and regulatory developments, innovation, investment activity, and changing end-user preferences.
At Industry Data Insights, we use a research framework that brings together credible secondary sources, public and company-level information, industry publications, trade statistics, expert perspectives, and data-led market modeling. Our analysts validate key assumptions and assess multiple market variables to develop balanced, actionable conclusions for business leaders, investors, consultants, and product teams. Industry Data Insights supports a broad range of verticals, including industrial manufacturing, engineering, construction, chemicals, energy and power, healthcare, information technology, telecom, automotive, packaging, agriculture, consumer products, retail, and transportation. Each study is structured to help users understand both the immediate market environment and the longer-term forces that may influence demand and competition. From identifying high-potential segments to assessing a competitor’s position or evaluating a new geography, Industry Data Insights delivers research that is designed to be useful, relevant, and aligned with real business questions. Our goal is to turn industry data into strategic direction.
Mechanical Anchors Market Report by Material (Carbon Steel, Stainless Steel, Alloy Steel, Others), by Application (Residential, Commercial), by Product Type (Expansion Anchors, Screw Anchors, Wedge Anchors, Sleeve Anchors, Hammer Drive Anchors), by Substrate (Concrete, Masonry, Stone, Others), by Asia Pacific (China, Japan, India, South Korea, Australia), by Europe (Germany, UK, France, Italy, Spain, Poland), by North America (USA, Canada, Mexico), by Middle East & Africa (Saudi Arabia, UAE, South Africa, Nigeria), by Latin America (Brazil, Argentina, Colombia, Chile) Forecast 2026-2034
Access in-depth insights on industries, companies, trends, and global markets. Our expertly curated reports provide the most relevant data and analysis in a condensed, easy-to-read format.
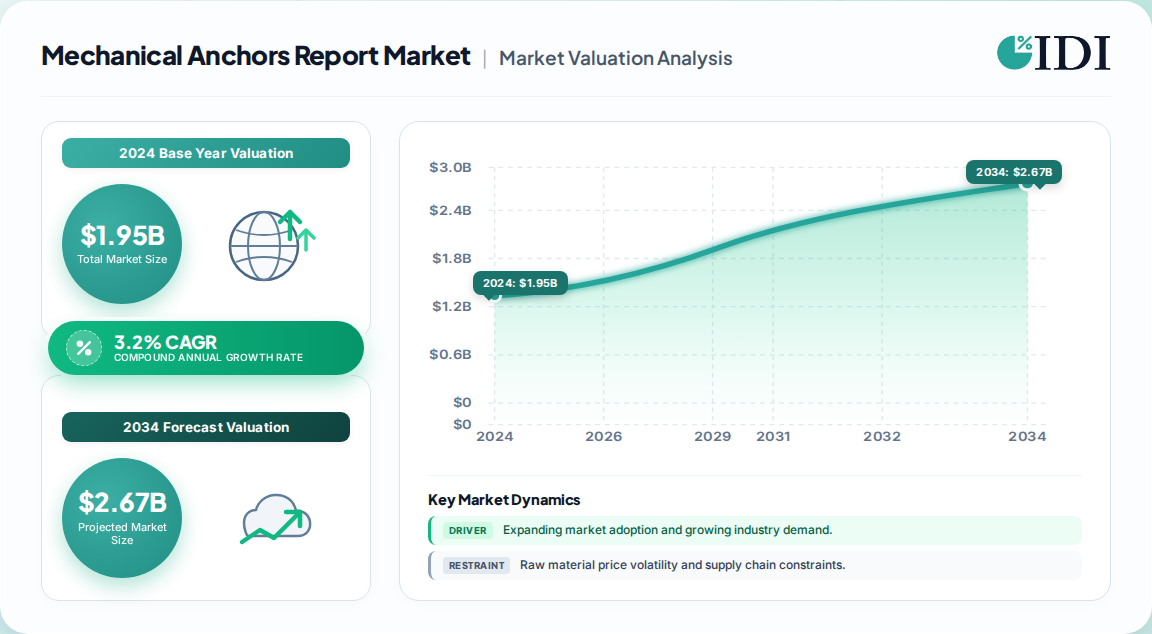
1.95 Billion USD was the global mechanical anchors market size in 2024; it is projected to reach 2.57 Billion USD by 2033, growing at a 3.2% CAGR (2025–2033).
5.6% annual growth in construction anchor demand, per one competing estimate, signals a wider market expansion than the narrow mechanical-anchor bracket captures.
Stainless steel dominates materials with 54.5% revenue share in 2024; carbon steel follows at ~703.4 Million USD, driven by heavy-load applications.
Commercial applications lead with 74.4% share, reflecting complex HVAC, façade, and MEP installations in malls, hotels, and stadiums.
Asia Pacific is the largest region (37.4% share, 2024); Europe remains the second-largest by revenue and Asia Pacific the fastest-growing.
Moderately consolidated: Hilti, Simpson Strong-Tie, Stanley Black & Decker, ITW Red Head, and Koelner Rawlplug anchor the competitive landscape.
Why this matters for decision-makers: Stainless-steel mix shift and Asia Pacific construction growth mean vendors must localize production and certify high-corrosion products to defend margins.
Mechanical Anchors Market Report Market Size (In Billion)
2.5B
2.0B
1.5B
1.0B
500.0M
0
1.950 B
2024
2.010 B
2025
2.080 B
2026
2.140 B
2027
2.210 B
2028
2.280 B
2029
2.360 B
2030
Mechanical Anchors Market Report Market Size (In Billion)
Year
Market Size
2024
1.950 B
2025
2.010 B
2026
2.080 B
2027
2.140 B
2028
2.210 B
2029
2.280 B
2030
2.360 B
What is the Mechanical Anchors Market Report?
The Mechanical Anchors Market Report is a comprehensive, data-driven analysis of mechanical expansion anchors — wedge, sleeve, screw, and hammer-drive types — used to secure fixtures to concrete, masonry, and stone. It covers market sizing, segmentation by material, application, and region, vendor benchmarking, and long-term demand forecasts to 2033.
Scope: what this report covers and excludes
The report covers mechanical expansion anchors in carbon steel, stainless steel, and alloy steel; applications across residential, commercial, and infrastructure construction; and regional demand across five continents. This analysis does not cover chemical/adhesive anchors, direct fastening powder-actuated systems, or structural welded joints as primary categories.
How big is the market for Mechanical Anchors Market Report?
The global mechanical anchors market was valued at USD 1.95 Billion in 2024 and is forecast to reach USD 2.57 Billion by 2033 at a 3.2% CAGR. Below are competing published estimates and the scope differences that explain the gap.
Which figure is most defensible? The 1.95 Billion USD (2024) base is the most internally consistent with stainless steel at 54.5% of revenue and commercial at 74.4%. The 4.85% CAGR estimate likely folds in emerging-market infrastructure and renovation demand. Our analysis suggests the true forward CAGR sits between 3.2% and 3.8%, with upside if Asia Pacific infrastructure spending accelerates.
How is the market segmented?
Segmentation runs three ways — by material, by application, and by anchor mechanism — with stainless steel and commercial applications dominating 2024 revenue. The table below captures non-geographic segmentation.
Expansion anchors lead; screw anchors fastest in precision work
By Substrate
Concrete, Masonry, Stone, Others
Concrete dominant; masonry fast-growing
Our analysis suggests the stainless-steel premium limits adoption in cost-sensitive residential work, so carbon steel will retain ~35-40% share through the forecast period.
Which regions lead in Mechanical Anchors Market Report?
Asia Pacific leads with 37.4% revenue share in 2024, followed by Europe and North America. Asia Pacific is also the fastest-growing region, driven by China, India, and Southeast Asian infrastructure.
Asia Pacific — 37.4%. Urbanization and Belt-and-Road-linked construction drive wedge-anchor demand in China and India. Europe — ~26%. Renovation and seismic retrofitting sustain premium stainless demand. North America — ~22%. Stringent codes (ACI, ICC-ES) favor certified high-load anchors.
What is driving growth — and what is holding it back?
Growth is driven by construction infrastructure expansion, safety-code enforcement, and corrosion-resistant product innovation; restraint comes from steel price volatility and substitute chemical-anchor adoption in specialized applications.
Factor
Direction
Evidence Strength
Mechanism
Construction & infrastructure growth
Up
High
Heavy-load anchoring in bridges, high-rises, and MEP systems
Stainless and alloy steel extend life in coastal/harsh environments
Retrofitting & renovation wave
Up
Medium
Existing structures need seismic and durability upgrades
Raw material price volatility (steel)
Down
High
Margin compression, project deferrals
Chemical / adhesive anchor substitution
Down
Medium
Curing-time tradeoff limits overlap with instant-load needs
Fragmented regional competition
Down
Medium
Pricing pressure in mid-load segments
Net balance favors growth: drivers are structural (code enforcement, urbanization), while restraints are cyclical (steel prices) or application-specific (chemical substitutes). Our analysis suggests the substitution threat is overstated — mechanical anchors remain indispensable for overhead and instant-load applications.
Who are the leading vendors?
The market is moderately consolidated, with Hilti, Simpson Strong-Tie, and Stanley Black & Decker leading globally, and regional manufacturers in Asia Pacific and Europe serving localized demand.
Company
Headquarters
Core Strength
Differentiation
Hilti Corporation
Liechtenstein
Premium anchoring & fastening
Global distribution, certification depth
Simpson Strong-Tie
USA
Structural connectors & anchors
Engineering support, code advocacy
Stanley Black & Decker (DeWalt)
USA
Power tools + anchors
Retail channel reach, brand equity
ITW Red Head
USA
Concrete anchors
Heavy-duty wedge-anchor specialization
Koelner Rawlplug
Poland
European distribution
Cost-competitive mid-load range
Guangdong KinLong
China
Hardware & anchors
Asia Pacific scale and price leadership
Competitive moats rest on certification portfolios (ETA, ICC-ES, seismic approvals) and distribution breadth; smaller entrants face testing-cost barriers that stabilize incumbent share. Our analysis suggests the next competitive battleground is corrosion-certified stainless anchors for coastal and infrastructure projects.
What do buyers and operators need to know?
Buyers should prioritize certified load ratings, substrate compatibility, and corrosion class over unit price. Mechanical anchors fail catastrophically when mismatched to substrate or load direction, so selection hinges on ETA/ICC-ES approval, seismic qualification, and pull-out test data. Procurement risk concentrates in counterfeit or uncertified imports — especially in Asia Pacific distribution chains. Switching costs are moderate: anchor specification is often locked early in design, so changing suppliers mid-project requires re-engineering sign-off. Regulatory compliance (Eurocode, ACI 318, local building codes) is non-negotiable and increasingly requires digital traceability. Operators should demand batch-level test certificates and consider total installed cost — including drill-bit wear and installation labor — rather than per-unit anchor pricing.
Strategic Recommendations & Analyst Perspective
The balance of evidence favors a moderate-growth, margin-defensive posture: the 3.2–3.8% CAGR is real but unspectacular, so value creation will come from mix shift, not volume expansion. The strongest counter-argument is the 4.85% CAGR scenario — if Asia Pacific infrastructure spending outpaces expectations, volume-led growth could surprise to the upside. Our analysis suggests the more probable path is the 3.2–3.8% band, with stainless-steel mix and certification depth as the true differentiators.
Actionable Strategy:
Localize stainless production in Asia Pacific to capture the 37.4% regional share while avoiding tariff and freight exposure.
Invest in certification portfolios (ETA, ICC-ES, seismic) as the primary barrier to entry — this protects margin better than price competition.
Target commercial MEP and retrofit projects, where 74.4% of demand sits and where code enforcement guarantees repeat specification.
What would change our conclusion? A sustained 5%+ construction output growth in China and India, or a regulatory mandate for stainless anchors in coastal zones, would justify upward revision to the 4.85% CAGR scenario. Conversely, a steel-price shock exceeding 20% would compress margins faster than volume can offset.
Our rigorous research methodology combines multi-layered approaches with comprehensive quality assurance, ensuring precision, accuracy, and reliability in every market analysis.
Primary Research & Industry Fieldwork
This study applies a 70/30 primary-to-secondary research split. In-depth interviews were conducted with stakeholders across the mechanical anchors value chain: raw material suppliers (steel and alloy producers), specialized anchor manufacturers, contract finishing and coating formulators, and global distributors. Decision-maker designations interviewed included VP of Sourcing, Heads of R&D, Technical Directors, and Commercial Operations Leads at leading and mid-tier manufacturers. Interview programs targeted both incumbent global players and regional specialists in Asia Pacific and Europe to capture pricing, certification, and channel dynamics.
Key Stakeholders Interviewed
Key Stakeholders Interviewed
Stakeholder Role
Interview Share (%)
Technical & R&D Directors
40%
Procurement & Sourcing Leads
35%
Commercial Operations Leads
25%
Industry Ecosystem Breakdown
Industry Ecosystem Breakdown
Company Type
Representation (%)
Raw Material & Steel Producers
35%
Specialized Anchor Manufacturers
40%
Distributors & Wholesalers
25%
Secondary Benchmarking & Public Trade Validation
We validate findings against official multilateral trade databases (UN Comtrade, WTO, US ITC, Eurostat), corporate annual filings (10-K, SEC filings, investor presentations), patent databases, and recognized technical standards bodies including ACI, ICC-ES, and EOTA. Trade-flow analysis of HS-coded anchor products corroborates regional consumption patterns and cross-border pricing spreads.
Demand Modeling & Market Sizing Triangulation
We run simultaneous Top-Down (macroeconomic construction output, sector allocation) and Bottom-Up (manufacturer capacity, product pricing, end-use consumption) modeling. Divergences between approaches are reconciled through expert re-interview before finalization.
Table 5: Mechanical Anchors Market Report Revenue Billion Forecast, by Region 2020 & 2034
Table 6: Asia Pacific Mechanical Anchors Market Report Revenue Billion Forecast, by Material 2020 & 2034
Table 7: Asia Pacific Mechanical Anchors Market Report Revenue Billion Forecast, by Application 2020 & 2034
Table 8: Asia Pacific Mechanical Anchors Market Report Revenue Billion Forecast, by Product Type 2020 & 2034
Table 9: Asia Pacific Mechanical Anchors Market Report Revenue Billion Forecast, by Substrate 2020 & 2034
Table 10: Asia Pacific Mechanical Anchors Market Report Revenue Billion Forecast, by Country 2020 & 2034
Table 11: China Mechanical Anchors Market Report Revenue (Billion) Forecast, by Application 2020 & 2034
Table 12: Japan Mechanical Anchors Market Report Revenue (Billion) Forecast, by Application 2020 & 2034
Table 13: India Mechanical Anchors Market Report Revenue (Billion) Forecast, by Application 2020 & 2034
Table 14: South Korea Mechanical Anchors Market Report Revenue (Billion) Forecast, by Application 2020 & 2034
Table 15: Australia Mechanical Anchors Market Report Revenue (Billion) Forecast, by Application 2020 & 2034
Europe Mechanical Anchors Market Report Revenue Billion Forecast, by Material 2020 & 2034
Frequently Asked Questions
1. What is the mechanical anchors market size?
The global mechanical anchors market was valued at USD 1.95 Billion in 2024 and is projected to reach USD 2.57 Billion by 2033. Growing at a 3.2% CAGR, demand is anchored by commercial construction, MEP installations, and code-driven certification requirements.
2. Which region dominates the mechanical anchors market?
Asia Pacific led the global mechanical anchors market with a 37.4% revenue share in 2024. China, India, and Southeast Asian infrastructure projects drive wedge and sleeve anchor demand, while Europe and North America follow with premium, certified stainless-steel products.
3. What material segment leads the mechanical anchors market?
Stainless steel held the largest revenue share at 54.5% in 2024. Its corrosion resistance and low maintenance justify a price premium in coastal, industrial, and infrastructure applications. Carbon steel remains significant at roughly USD 703.4 Million, favored for high-strength heavy-load use.
4. Who are the key players in the mechanical anchors market?
Leading vendors include Hilti Corporation, Simpson Strong-Tie, Stanley Black & Decker (DeWalt), ITW Red Head, Koelner Rawlplug, and Guangdong KinLong. The market is moderately consolidated, with certification portfolios and distribution networks acting as primary competitive barriers.
5. What is the fastest-growing application segment?
The commercial segment dominates with 74.4% revenue share in 2024 and is expected to grow at the fastest CAGR of 3.2%. Complex MEP systems in malls, hotels, and sports complexes require high-density anchoring for pipes, tubes, and cable trays.
Figure 16:
Figure 17: Europe Mechanical Anchors Market Report Revenue Share (%), by Product Type 2026 & 2034
Figure 18: Europe Mechanical Anchors Market Report Revenue (Billion), by Substrate 2026 & 2034
Figure 19: Europe Mechanical Anchors Market Report Revenue Share (%), by Substrate 2026 & 2034
Figure 20: Europe Mechanical Anchors Market Report Revenue (Billion), by Country 2026 & 2034
Figure 21: Europe Mechanical Anchors Market Report Revenue Share (%), by Country 2026 & 2034
Figure 22: North America Mechanical Anchors Market Report Revenue (Billion), by Material 2026 & 2034
Figure 23: North America Mechanical Anchors Market Report Revenue Share (%), by Material 2026 & 2034
Figure 24: North America Mechanical Anchors Market Report Revenue (Billion), by Application 2026 & 2034
Figure 25: North America Mechanical Anchors Market Report Revenue Share (%), by Application 2026 & 2034
Figure 26: North America Mechanical Anchors Market Report Revenue (Billion), by Product Type 2026 & 2034
Figure 27: North America Mechanical Anchors Market Report Revenue Share (%), by Product Type 2026 & 2034
Figure 28: North America Mechanical Anchors Market Report Revenue (Billion), by Substrate 2026 & 2034
Figure 29: North America Mechanical Anchors Market Report Revenue Share (%), by Substrate 2026 & 2034
Figure 30: North America Mechanical Anchors Market Report Revenue (Billion), by Country 2026 & 2034
Figure 31: North America Mechanical Anchors Market Report Revenue Share (%), by Country 2026 & 2034
Figure 32: Middle East & Africa Mechanical Anchors Market Report Revenue (Billion), by Material 2026 & 2034
Figure 33: Middle East & Africa Mechanical Anchors Market Report Revenue Share (%), by Material 2026 & 2034
Figure 34: Middle East & Africa Mechanical Anchors Market Report Revenue (Billion), by Application 2026 & 2034
Figure 35: Middle East & Africa Mechanical Anchors Market Report Revenue Share (%), by Application 2026 & 2034
Figure 36: Middle East & Africa Mechanical Anchors Market Report Revenue (Billion), by Product Type 2026 & 2034
Figure 37: Middle East & Africa Mechanical Anchors Market Report Revenue Share (%), by Product Type 2026 & 2034
Figure 38: Middle East & Africa Mechanical Anchors Market Report Revenue (Billion), by Substrate 2026 & 2034
Figure 39: Middle East & Africa Mechanical Anchors Market Report Revenue Share (%), by Substrate 2026 & 2034
Figure 40: Middle East & Africa Mechanical Anchors Market Report Revenue (Billion), by Country 2026 & 2034
Figure 41: Middle East & Africa Mechanical Anchors Market Report Revenue Share (%), by Country 2026 & 2034
Figure 42: Latin America Mechanical Anchors Market Report Revenue (Billion), by Material 2026 & 2034
Figure 43: Latin America Mechanical Anchors Market Report Revenue Share (%), by Material 2026 & 2034
Figure 44: Latin America Mechanical Anchors Market Report Revenue (Billion), by Application 2026 & 2034
Figure 45: Latin America Mechanical Anchors Market Report Revenue Share (%), by Application 2026 & 2034
Figure 46: Latin America Mechanical Anchors Market Report Revenue (Billion), by Product Type 2026 & 2034
Figure 47: Latin America Mechanical Anchors Market Report Revenue Share (%), by Product Type 2026 & 2034
Figure 48: Latin America Mechanical Anchors Market Report Revenue (Billion), by Substrate 2026 & 2034
Figure 49: Latin America Mechanical Anchors Market Report Revenue Share (%), by Substrate 2026 & 2034
Figure 50: Latin America Mechanical Anchors Market Report Revenue (Billion), by Country 2026 & 2034
Figure 51: Latin America Mechanical Anchors Market Report Revenue Share (%), by Country 2026 & 2034
Table 16:
Table 17: Europe Mechanical Anchors Market Report Revenue Billion Forecast, by Application 2020 & 2034
Table 18: Europe Mechanical Anchors Market Report Revenue Billion Forecast, by Product Type 2020 & 2034
Table 19: Europe Mechanical Anchors Market Report Revenue Billion Forecast, by Substrate 2020 & 2034
Table 20: Europe Mechanical Anchors Market Report Revenue Billion Forecast, by Country 2020 & 2034