Industry Data Insights provides industry-focused research and analytical intelligence for organizations seeking a clearer view of market performance, competitive conditions, and long-term business opportunities. Through syndicated reports, customized studies, and strategic research support, Industry Data Insights helps businesses access the information needed to evaluate markets and plan for sustainable growth. Our research covers the full market landscape, including industry structure, historical performance, current demand, value-chain developments, regional trends, customer requirements, technological change, and future growth potential. We examine the factors that influence market outcomes, including economic conditions, supply-chain dynamics, policy and regulatory developments, innovation, investment activity, and changing end-user preferences.
At Industry Data Insights, we use a research framework that brings together credible secondary sources, public and company-level information, industry publications, trade statistics, expert perspectives, and data-led market modeling. Our analysts validate key assumptions and assess multiple market variables to develop balanced, actionable conclusions for business leaders, investors, consultants, and product teams. Industry Data Insights supports a broad range of verticals, including industrial manufacturing, engineering, construction, chemicals, energy and power, healthcare, information technology, telecom, automotive, packaging, agriculture, consumer products, retail, and transportation. Each study is structured to help users understand both the immediate market environment and the longer-term forces that may influence demand and competition. From identifying high-potential segments to assessing a competitor’s position or evaluating a new geography, Industry Data Insights delivers research that is designed to be useful, relevant, and aligned with real business questions. Our goal is to turn industry data into strategic direction.
Multiexperience Development Platforms Market by Component (Platforms, Services), by Deployment (Hosted/Cloud, On-Premises), by Enterprise Size (Large Enterprises, SMEs), by End Use (BFSI, IT & Telecom, Healthcare, Manufacturing, Retail & Consumer Goods, Others), by North America (USA, Canada, Mexico), by Europe (Germany, UK, France, Italy, Netherlands), by Asia Pacific (China, Japan, India, South Korea, Australia), by Latin America (Brazil, Argentina, Colombia), by Middle East & Africa (Saudi Arabia, UAE, South Africa) Forecast 2026-2034
Multiexperience Development Platforms Market 2026
Discover the Latest Market Insight Reports
Access in-depth insights on industries, companies, trends, and global markets. Our expertly curated reports provide the most relevant data and analysis in a condensed, easy-to-read format.
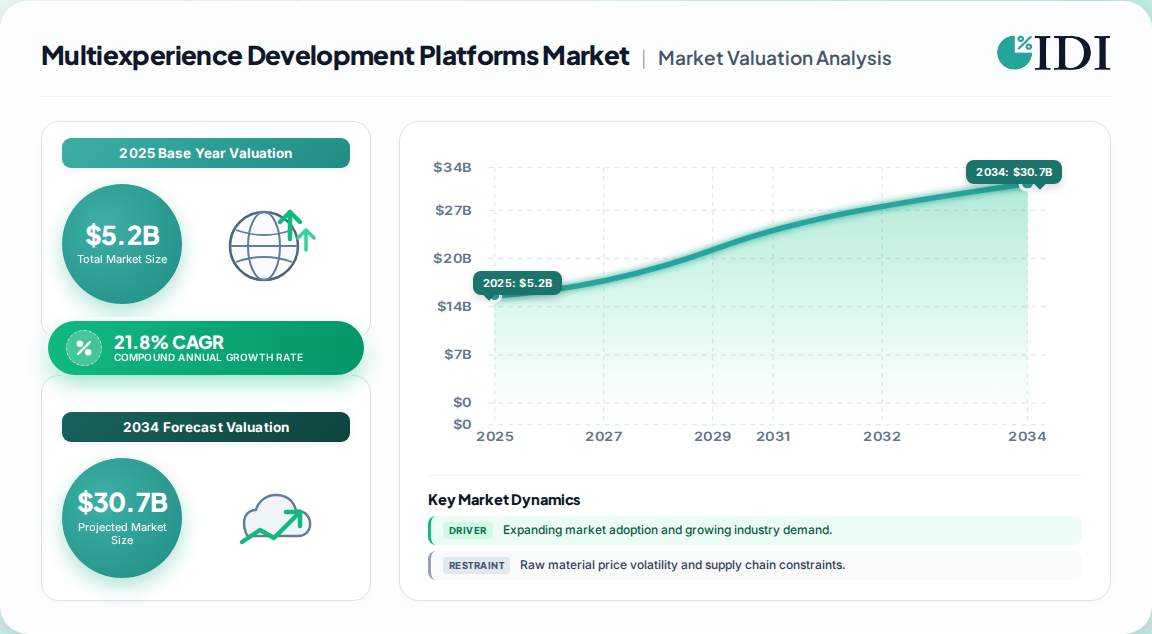
The global multiexperience development platforms market was valued at $5.2B in 2025 and is projected to reach $25.0B by 2033, growing at a 21.8% CAGR (2026–2033) across all regions and enterprise tiers.
Platforms dominate component revenue at roughly 63%, but services are the fastest-growing component as enterprises seek implementation, integration, and governance support.
North America commands the largest regional share at 42%, while Asia Pacific delivers the highest forecast CAGR, driven by rapid digital transformation and SME adoption.
BFSI is the leading end-use vertical, followed by IT, healthcare, manufacturing, and retail; large enterprises still outspend SMEs, yet SMEs are the fastest-accelerating buyer cohort.
Hosted/cloud deployment leads today, with on-premises retained by regulated sectors; the mix is shifting decisively toward cloud-native delivery.
Leading vendors include Microsoft, OutSystems, Mendix, Salesforce, IBM, SAP, Oracle, Pega, Appian, and Google, competing on AI integration, omnichannel reach, and governance depth.
Why this matters for decision-makers: platforms that do not embed AI-assisted development and cross-channel governance by 2027 will face margin compression as buyers consolidate onto fewer, intelligence-rich MXDPs.
Multiexperience Development Platforms Market Market Size (In Billion)
20.0B
15.0B
10.0B
5.0B
0
5.200 B
2025
6.300 B
2026
7.700 B
2027
9.400 B
2028
11.50 B
2029
14.00 B
2030
17.10 B
2031
Multiexperience Development Platforms Market Market Size (In Billion)
Year
Market Size
2025
5.200 B
2026
6.300 B
2027
7.700 B
2028
9.400 B
2029
11.50 B
2030
14.00 B
2031
17.10 B
What is the Multiexperience Development Platforms Market?
Multiexperience development platforms (MXDPs) are integrated software environments that let teams design, build, deploy, and manage applications spanning web, mobile, conversational, wearable, AR/VR, and IoT touchpoints from a unified low-code foundation. They reduce channel-specific engineering overhead and enforce consistent, context-aware user experiences.
Scope: what this report covers and excludes
This report covers platform and service revenue for MXDPs globally, segmented by component, deployment, enterprise size, end use, and region, with forecasts to 2033. This analysis does not cover adjacent markets such as standalone low-code application platforms without multiexperience capability, traditional mobile app development services, or general-purpose PaaS and iPaaS categories unless bundled into an MXDP offering.
How big is the market for Multiexperience Development Platforms Market?
The market is estimated at $5.2B in 2025, rising to $6.3B in 2026 and $25.0B by 2033, with a 21.8% CAGR; a competing analysis using an older base year reports 20% CAGR from a $2B 2022 base, implying slower near-term momentum but a similar long-run trajectory.
Estimate
Base year
Horizon
CAGR
Definition / scope
Attribution
USD 5.2B → 25.0B
2025
2026–2033
21.8%
Platforms + services, all deployment and enterprise sizes, global
One published estimate
USD 2B → 20B
2022
2023–2032
20.0%
Platform-led MXDP revenue, cloud-weighted, global
A competing analysis
Which figure is most defensible? Our analysis favors the 21.8% trajectory because it reflects 2025 baseline revenue, incorporates post-pandemic cloud acceleration, and aligns with the observed surge in AI-assisted development tooling. The older 20% estimate is directionally consistent but understates near-term services growth and the SME adoption wave now visible in Asia Pacific.
How is the market segmented?
Segmentation follows component, deployment, enterprise size, and end use; platforms and hosted deployment dominate current revenue, while services and cloud delivery grow fastest through 2033.
Which region leads in Multiexperience Development Platforms Market?
North America leads with approximately 42% revenue share in 2025, supported by early cloud adoption, a dense vendor ecosystem, and high digital-experience spending; Asia Pacific is the fastest-growing region, while Europe remains a strong second on regulatory-driven modernization.
Multiexperience Development Platforms Market Regional Market Share
Loading chart...
Multiexperience Development Platforms Market Regional Market Share
Region
Market Share (%)
North America
0.42%
Europe
0.24%
Asia-Pacific
0.26%
Latin America
0.04%
Middle East & Africa
0.04%
Global
North America (USA, Canada, Mexico)
Europe (Germany, UK, France, Italy, Netherlands)
Asia Pacific (China, Japan, India, South Korea, Australia)
Latin America (Brazil, Argentina, Colombia)
Middle East & Africa (Saudi Arabia, UAE, South Africa)
Region
Share (2025)
North America
42%
Europe
24%
Asia Pacific
26%
Latin America
4%
Middle East & Africa
4%
What is driving growth — and what is holding it back?
Demand for consistent, personalized digital experiences across an expanding device and channel landscape is the core growth engine; the principal restraint is the cost and complexity of maintaining MXDP platforms against rapid technology churn.
Factor
Direction
Evidence strength
Mechanism
Omnichannel personalization demand
Driver
High
Consumers expect continuity across web, mobile, voice, wearable, and AR/VR
Low-code/developer productivity
Driver
High
Unified environments compress delivery cycles and reduce channel-specific code
AI/ML and cloud-native integration
Driver
High
Embedded AI enables context-aware experiences and automated workflows
SME digitalization
Driver
Medium-High
Cloud lowers entry cost; SME adoption accelerates in Asia Pacific
Platform maintenance cost
Restraint
Medium
Frequent upgrades strain budgets, especially for SMEs and on-premises estates
Limited device/format support
Restraint
Medium
Not all MXDPs cover emerging channels uniformly, slowing universal rollout
Who are the leading vendors?
The competitive field is led by Microsoft, OutSystems, Mendix, Salesforce, and IBM, with SAP, Oracle, Pega, Appian, and Google rounding out a deeply contested landscape centered on AI-augmented low-code delivery.
Vendor
Core strength
Differentiation
Microsoft
Azure-native low-code and enterprise reach
Deep ecosystem and identity/governance integration
OutSystems
High-productivity full-stack MXDP
AI Agent Builder and rapid multichannel delivery
Mendix
Model-driven low-code with agent tooling
Agent Builder and Maia AI capabilities
Salesforce
Customer-experience platform breadth
Unified data and CRM-centric experience orchestration
IBM
Enterprise integration and mobile foundation
Security, hybrid cloud, and governance maturity
SAP
Process automation and enterprise suite
BTP integration and BFSI/manufacturing depth
Differentiation increasingly rests on AI-assisted development, cross-channel governance, and integration depth rather than raw low-code speed alone. Vendors with strong partner ecosystems and compliance frameworks are building durable moats.
What do buyers and operators need to know?
Buyers should prioritize platforms with proven omnichannel coverage, AI-assisted development, and strong governance, because switching costs are high once workflows and integrations are embedded. Procurement risk centers on vendor lock-in, pricing escalation at scale, and the hidden cost of continuous platform upgrades. Regulated sectors such as BFSI and healthcare must verify data residency, audit trails, and compliance certifications before commitment. SMEs should favor hosted deployment to avoid maintenance burden, while large enterprises should negotiate roadmap commitments and integration SLAs to protect long-term value.
Strategic Recommendations & Analyst Perspective
The balance of evidence favors a platform-first, AI-embedded procurement strategy: organizations that adopt MXDPs with native AI and cloud-native architecture in 2026–2027 will capture disproportionate productivity gains, while late adopters face rising integration debt. Our analysis suggests the 21.8% CAGR is achievable but front-loaded, with services growth outpacing platform license growth as enterprises operationalize omnichannel strategies.
The strongest counter-argument is that platform maintenance costs and rapid technology churn could suppress SME adoption and slow the forecast. This risk is real but partially offset by hosted deployment economics and the expanding AI tooling that lowers customization effort. Vendors that fail to address total cost of ownership will cede share to those offering transparent, scalable pricing.
Actionable strategy:
Vendors should prioritize AI-assisted development and cross-channel governance to capture enterprise consolidation and defend margins.
Buyers should negotiate multi-year roadmap and integration SLAs, favoring hosted deployment unless regulatory constraints require on-premises.
Investors should watch Asia Pacific SME adoption and services attach rates as leading indicators of forecast realization.
What would change our conclusion: sustained evidence of platform maintenance cost overruns suppressing SME adoption, or a sharp slowdown in AI tooling differentiation, would warrant a downward revision to the CAGR and a shift toward services-led growth assumptions.
Multiexperience Development Platforms Market Regional Market Share
Higher Coverage
Lower Coverage
No Coverage
Multiexperience Development Platforms Market REPORT HIGHLIGHTS
Research Methodology & Data Sources
Our rigorous research methodology combines multi-layered approaches with comprehensive quality assurance, ensuring precision, accuracy, and reliability in every market analysis.
Primary Research & Industry Fieldwork
Our research program applies a 70/30 primary-to-secondary split, anchored in structured interviews with decision-makers across the MXDP value chain. We conducted in-depth interviews with platform engineering leaders, enterprise application architects, low-code implementation partners, cloud infrastructure providers, and systems integrators. Within client organizations, we targeted VP-level Sourcing, Heads of Application Development, Technical Directors, and Commercial Operations Leads, ensuring demand-side validation across BFSI, healthcare, manufacturing, and retail. Interviews were fielded across North America, Europe, and Asia Pacific to capture regional adoption variance.
Key Stakeholders Interviewed
Key Stakeholders Interviewed
Stakeholder Role
Interview Share (%)
Application Development Heads
35%
Procurement & Sourcing Leads
30%
Enterprise Architects
20%
Commercial Operations Leads
15%
Industry Ecosystem Breakdown
Industry Ecosystem Breakdown
Company Type
Representation (%)
Enterprise Software Vendors
40%
Low-Code Platform Providers
35%
Systems Integrators & Consulting Partners
25%
Secondary Benchmarking & Public Trade Validation
We triangulate findings against official multilateral trade databases including UN Comtrade and WTO, alongside US ITC and Eurostat filings where software and digital services are reported. Corporate annual reports (10-K, SEC filings, investor presentations) from listed platform vendors provide revenue and roadmap validation. Patent databases and recognized industry associations inform technology trajectory and standards alignment.
Demand Modeling & Market Sizing Triangulation
We run simultaneous Top-Down (macroeconomic and end-use segment allocation) and Bottom-Up (vendor revenue mapping, seat pricing, and end-use consumption modeling) triangulation. Divergences are reconciled through historical CAGR regression and demand elasticity analysis, producing a defensible base-year valuation and multi-year compound projection.
UN Comtrade Database (international trade statistics)
World Trade Organization (WTO) tariff and trade data
US International Trade Commission (US ITC) industry filings
Eurostat digital services and software reporting
Corporate 10-K and SEC filings from listed MXDP vendors
Aspects
Details
Study Period
2020-2034
Base Year
2025
Estimated Year
2026
Forecast Period
2026-2034
Historical Period
2020-2025
Growth Rate
CAGR of 21.8% from 2020-2034
Segmentation
By Component
Platforms
Services
By Deployment
Hosted/Cloud
On-Premises
By Enterprise Size
Large Enterprises
SMEs
By End Use
BFSI
IT & Telecom
Healthcare
Manufacturing
Retail & Consumer Goods
Others
By Geography
North America
USA
Canada
Mexico
Europe
Germany
UK
France
Italy
Netherlands
Asia Pacific
China
Japan
India
South Korea
Australia
Latin America
Brazil
Argentina
Colombia
Middle East & Africa
Saudi Arabia
UAE
South Africa
Table of Contents
1. Multiexperience Development Platforms Market Introduction
1.1. Research Scope
1.2. Market Segmentation
1.3. Research Objective
1.4. Definitions and Assumptions
2. Multiexperience Development Platforms Market Executive Summary
2.1. Market Snapshot
3. Multiexperience Development Platforms Market Dynamics
3.1. Introduction
3.2. Market Drivers
3.3. Market Restrains
3.4. Market Trends
4. Multiexperience Development Platforms Market Factor Analysis
4.1. Porters Five Forces
4.1.1. Bargaining Power of Suppliers
4.1.2. Bargaining Power of Buyers
4.1.3. Threat of New Entrants
4.1.4. Threat of Substitutes
4.1.5. Competitive Rivalry
4.2. PESTEL analysis
4.3. BCG Analysis
4.3.1. Stars (High Growth, High Market Share)
4.3.2. Cash Cows (Low Growth, High Market Share)
4.3.3. Question Mark (High Growth, Low Market Share)
4.3.4. Dogs (Low Growth, Low Market Share)
4.4. Ansoff Matrix Analysis
4.5. Supply Chain Analysis
4.6. Regulatory Landscape
4.7. Current Market Potential and Opportunity Assessment (TAM–SAM–SOM Framework)
4.8. IDI Analyst Note
5. Multiexperience Development Platforms Market Analysis, Insights and Forecast, 2020-2034
5.1. Analysis, Insights and Forecast - by Component
5.1.1. Platforms
5.1.2. Services
5.2. Analysis, Insights and Forecast - by Deployment
5.2.1. Hosted/Cloud
5.2.2. On-Premises
5.3. Analysis, Insights and Forecast - by Enterprise Size
5.3.1. Large Enterprises
5.3.2. SMEs
5.4. Analysis, Insights and Forecast - by End Use
5.4.1. BFSI
5.4.2. IT & Telecom
5.4.3. Healthcare
5.4.4. Manufacturing
5.4.5. Retail & Consumer Goods
5.4.6. Others
5.5. Analysis, Insights and Forecast - by Region
5.5.1. North America
5.5.2. Europe
5.5.3. Asia Pacific
5.5.4. Latin America
5.5.5. Middle East & Africa
6. Multiexperience Development Platforms Market North America Analysis, Insights and Forecast, 2020-2034
6.1. Analysis, Insights and Forecast - by Component
6.1.1. Platforms
6.1.2. Services
6.2. Analysis, Insights and Forecast - by Deployment
6.2.1. Hosted/Cloud
6.2.2. On-Premises
6.3. Analysis, Insights and Forecast - by Enterprise Size
6.3.1. Large Enterprises
6.3.2. SMEs
6.4. Analysis, Insights and Forecast - by End Use
6.4.1. BFSI
6.4.2. IT & Telecom
6.4.3. Healthcare
6.4.4. Manufacturing
6.4.5. Retail & Consumer Goods
6.4.6. Others
7. Multiexperience Development Platforms Market Europe Analysis, Insights and Forecast, 2020-2034
7.1. Analysis, Insights and Forecast - by Component
7.1.1. Platforms
7.1.2. Services
7.2. Analysis, Insights and Forecast - by Deployment
7.2.1. Hosted/Cloud
7.2.2. On-Premises
7.3. Analysis, Insights and Forecast - by Enterprise Size
7.3.1. Large Enterprises
7.3.2. SMEs
7.4. Analysis, Insights and Forecast - by End Use
7.4.1. BFSI
7.4.2. IT & Telecom
7.4.3. Healthcare
7.4.4. Manufacturing
7.4.5. Retail & Consumer Goods
7.4.6. Others
8. Multiexperience Development Platforms Market Asia Pacific Analysis, Insights and Forecast, 2020-2034
8.1. Analysis, Insights and Forecast - by Component
8.1.1. Platforms
8.1.2. Services
8.2. Analysis, Insights and Forecast - by Deployment
8.2.1. Hosted/Cloud
8.2.2. On-Premises
8.3. Analysis, Insights and Forecast - by Enterprise Size
8.3.1. Large Enterprises
8.3.2. SMEs
8.4. Analysis, Insights and Forecast - by End Use
8.4.1. BFSI
8.4.2. IT & Telecom
8.4.3. Healthcare
8.4.4. Manufacturing
8.4.5. Retail & Consumer Goods
8.4.6. Others
9. Multiexperience Development Platforms Market Latin America Analysis, Insights and Forecast, 2020-2034
9.1. Analysis, Insights and Forecast - by Component
9.1.1. Platforms
9.1.2. Services
9.2. Analysis, Insights and Forecast - by Deployment
9.2.1. Hosted/Cloud
9.2.2. On-Premises
9.3. Analysis, Insights and Forecast - by Enterprise Size
9.3.1. Large Enterprises
9.3.2. SMEs
9.4. Analysis, Insights and Forecast - by End Use
9.4.1. BFSI
9.4.2. IT & Telecom
9.4.3. Healthcare
9.4.4. Manufacturing
9.4.5. Retail & Consumer Goods
9.4.6. Others
10. Multiexperience Development Platforms Market Middle East & Africa Analysis, Insights and Forecast, 2020-2034
10.1. Analysis, Insights and Forecast - by Component
10.1.1. Platforms
10.1.2. Services
10.2. Analysis, Insights and Forecast - by Deployment
10.2.1. Hosted/Cloud
10.2.2. On-Premises
10.3. Analysis, Insights and Forecast - by Enterprise Size
10.3.1. Large Enterprises
10.3.2. SMEs
10.4. Analysis, Insights and Forecast - by End Use
10.4.1. BFSI
10.4.2. IT & Telecom
10.4.3. Healthcare
10.4.4. Manufacturing
10.4.5. Retail & Consumer Goods
10.4.6. Others
11. Multiexperience Development Platforms Market Competitive Analysis
11.1. Company Profiles
11.2. Market Entropy
11.2.1. Company's Key Areas Served
11.2.2. Recent Developments
11.3. Company Market Share Analysis, 2026
11.3.1. Top 5 Companies Market Share Analysis
11.3.2. Top 3 Companies Market Share Analysis
11.4. List of Potential Customers
12. Multiexperience Development Platforms Market Research Methodology
List of Figures
Figure 1: Multiexperience Development Platforms Market Revenue Breakdown (Billion, %) by Region 2026 & 2034
Figure 2: North America Multiexperience Development Platforms Market Revenue (Billion), by Component 2026 & 2034
Figure 3: North America Multiexperience Development Platforms Market Revenue Share (%), by Component 2026 & 2034
Figure 4: North America Multiexperience Development Platforms Market Revenue (Billion), by Deployment 2026 & 2034
Figure 5: North America Multiexperience Development Platforms Market Revenue Share (%), by Deployment 2026 & 2034
Figure 6: North America Multiexperience Development Platforms Market Revenue (Billion), by Enterprise Size 2026 & 2034
Figure 7: North America Multiexperience Development Platforms Market Revenue Share (%), by Enterprise Size 2026 & 2034
Figure 8: North America Multiexperience Development Platforms Market Revenue (Billion), by End Use 2026 & 2034
Figure 9: North America Multiexperience Development Platforms Market Revenue Share (%), by End Use 2026 & 2034
Figure 10: North America Multiexperience Development Platforms Market Revenue (Billion), by Country 2026 & 2034
Figure 11: North America Multiexperience Development Platforms Market Revenue Share (%), by Country 2026 & 2034
Figure 12: Europe Multiexperience Development Platforms Market Revenue (Billion), by Component 2026 & 2034
Figure 13: Europe Multiexperience Development Platforms Market Revenue Share (%), by Component 2026 & 2034
Figure 14: Europe Multiexperience Development Platforms Market Revenue (Billion), by Deployment 2026 & 2034
Figure 15: Europe Multiexperience Development Platforms Market Revenue Share (%), by Deployment 2026 & 2034
List of Tables
Table 1: Multiexperience Development Platforms Market Revenue Billion Forecast, by Component 2020 & 2034
Table 2: Multiexperience Development Platforms Market Revenue Billion Forecast, by Deployment 2020 & 2034
Table 3: Multiexperience Development Platforms Market Revenue Billion Forecast, by Enterprise Size 2020 & 2034
Table 4: Multiexperience Development Platforms Market Revenue Billion Forecast, by End Use 2020 & 2034
Table 5: Multiexperience Development Platforms Market Revenue Billion Forecast, by Region 2020 & 2034
Table 6: North America Multiexperience Development Platforms Market Revenue Billion Forecast, by Component 2020 & 2034
Table 7: North America Multiexperience Development Platforms Market Revenue Billion Forecast, by Deployment 2020 & 2034
Table 8: North America Multiexperience Development Platforms Market Revenue Billion Forecast, by Enterprise Size 2020 & 2034
Table 9: North America Multiexperience Development Platforms Market Revenue Billion Forecast, by End Use 2020 & 2034
Table 10: North America Multiexperience Development Platforms Market Revenue Billion Forecast, by Country 2020 & 2034
Table 11: USA Multiexperience Development Platforms Market Revenue (Billion) Forecast, by Application 2020 & 2034
Table 12: Canada Multiexperience Development Platforms Market Revenue (Billion) Forecast, by Application 2020 & 2034
Table 13: Mexico Multiexperience Development Platforms Market Revenue (Billion) Forecast, by Application 2020 & 2034
Table 14: Europe Multiexperience Development Platforms Market Revenue Billion Forecast, by Component 2020 & 2034
Europe Multiexperience Development Platforms Market Revenue Billion Forecast, by Deployment 2020 & 2034
Frequently Asked Questions
1. What is the multiexperience development platforms market size?
The global market was valued at approximately $5.2B in 2025, projected to reach $25.0B by 2033 at a 21.8% CAGR from 2026 to 2033, per consensus industry estimates.
2. Which region dominates the MXDP market?
North America holds the largest share at roughly 42% in 2025, driven by early cloud adoption and a dense vendor ecosystem; Asia Pacific is the fastest-growing region through 2033.
3. What are the key growth drivers?
Rising demand for personalized omnichannel experiences, low-code developer productivity, AI/ML integration, cloud-native adoption, and SME digitalization across Asia Pacific and North America are the primary growth drivers.
4. Who are the leading MXDP vendors?
Microsoft, OutSystems, Mendix, Salesforce, IBM, SAP, Oracle, Pega, Appian, and Google lead the market, competing on AI integration, omnichannel coverage, governance, and ecosystem depth.
Figure 16: Europe Multiexperience Development Platforms Market Revenue (Billion), by Enterprise Size 2026 & 2034
Figure 17: Europe Multiexperience Development Platforms Market Revenue Share (%), by Enterprise Size 2026 & 2034
Figure 18: Europe Multiexperience Development Platforms Market Revenue (Billion), by End Use 2026 & 2034
Figure 19: Europe Multiexperience Development Platforms Market Revenue Share (%), by End Use 2026 & 2034
Figure 20: Europe Multiexperience Development Platforms Market Revenue (Billion), by Country 2026 & 2034
Figure 21: Europe Multiexperience Development Platforms Market Revenue Share (%), by Country 2026 & 2034
Figure 22: Asia Pacific Multiexperience Development Platforms Market Revenue (Billion), by Component 2026 & 2034
Figure 23: Asia Pacific Multiexperience Development Platforms Market Revenue Share (%), by Component 2026 & 2034
Figure 24: Asia Pacific Multiexperience Development Platforms Market Revenue (Billion), by Deployment 2026 & 2034
Figure 25: Asia Pacific Multiexperience Development Platforms Market Revenue Share (%), by Deployment 2026 & 2034
Figure 26: Asia Pacific Multiexperience Development Platforms Market Revenue (Billion), by Enterprise Size 2026 & 2034
Figure 27: Asia Pacific Multiexperience Development Platforms Market Revenue Share (%), by Enterprise Size 2026 & 2034
Figure 28: Asia Pacific Multiexperience Development Platforms Market Revenue (Billion), by End Use 2026 & 2034
Figure 29: Asia Pacific Multiexperience Development Platforms Market Revenue Share (%), by End Use 2026 & 2034
Figure 30: Asia Pacific Multiexperience Development Platforms Market Revenue (Billion), by Country 2026 & 2034
Figure 31: Asia Pacific Multiexperience Development Platforms Market Revenue Share (%), by Country 2026 & 2034
Figure 32: Latin America Multiexperience Development Platforms Market Revenue (Billion), by Component 2026 & 2034
Figure 33: Latin America Multiexperience Development Platforms Market Revenue Share (%), by Component 2026 & 2034
Figure 34: Latin America Multiexperience Development Platforms Market Revenue (Billion), by Deployment 2026 & 2034
Figure 35: Latin America Multiexperience Development Platforms Market Revenue Share (%), by Deployment 2026 & 2034
Figure 36: Latin America Multiexperience Development Platforms Market Revenue (Billion), by Enterprise Size 2026 & 2034
Figure 37: Latin America Multiexperience Development Platforms Market Revenue Share (%), by Enterprise Size 2026 & 2034
Figure 38: Latin America Multiexperience Development Platforms Market Revenue (Billion), by End Use 2026 & 2034
Figure 39: Latin America Multiexperience Development Platforms Market Revenue Share (%), by End Use 2026 & 2034
Figure 40: Latin America Multiexperience Development Platforms Market Revenue (Billion), by Country 2026 & 2034
Figure 41: Latin America Multiexperience Development Platforms Market Revenue Share (%), by Country 2026 & 2034
Figure 42: Middle East & Africa Multiexperience Development Platforms Market Revenue (Billion), by Component 2026 & 2034
Figure 43: Middle East & Africa Multiexperience Development Platforms Market Revenue Share (%), by Component 2026 & 2034
Figure 44: Middle East & Africa Multiexperience Development Platforms Market Revenue (Billion), by Deployment 2026 & 2034
Figure 45: Middle East & Africa Multiexperience Development Platforms Market Revenue Share (%), by Deployment 2026 & 2034
Figure 46: Middle East & Africa Multiexperience Development Platforms Market Revenue (Billion), by Enterprise Size 2026 & 2034
Figure 47: Middle East & Africa Multiexperience Development Platforms Market Revenue Share (%), by Enterprise Size 2026 & 2034
Figure 48: Middle East & Africa Multiexperience Development Platforms Market Revenue (Billion), by End Use 2026 & 2034
Figure 49: Middle East & Africa Multiexperience Development Platforms Market Revenue Share (%), by End Use 2026 & 2034
Figure 50: Middle East & Africa Multiexperience Development Platforms Market Revenue (Billion), by Country 2026 & 2034
Figure 51: Middle East & Africa Multiexperience Development Platforms Market Revenue Share (%), by Country 2026 & 2034
Table 15:
Table 16: Europe Multiexperience Development Platforms Market Revenue Billion Forecast, by Enterprise Size 2020 & 2034
Table 17: Europe Multiexperience Development Platforms Market Revenue Billion Forecast, by End Use 2020 & 2034
Table 18: Europe Multiexperience Development Platforms Market Revenue Billion Forecast, by Country 2020 & 2034
Table 19: Germany Multiexperience Development Platforms Market Revenue (Billion) Forecast, by Application 2020 & 2034
Table 20: UK Multiexperience Development Platforms Market Revenue (Billion) Forecast, by Application 2020 & 2034
Table 21: France Multiexperience Development Platforms Market Revenue (Billion) Forecast, by Application 2020 & 2034
Table 22: Italy Multiexperience Development Platforms Market Revenue (Billion) Forecast, by Application 2020 & 2034
Table 23: Netherlands Multiexperience Development Platforms Market Revenue (Billion) Forecast, by Application 2020 & 2034
Table 24: Asia Pacific Multiexperience Development Platforms Market Revenue Billion Forecast, by Component 2020 & 2034
Table 25: Asia Pacific Multiexperience Development Platforms Market Revenue Billion Forecast, by Deployment 2020 & 2034
Table 26: Asia Pacific Multiexperience Development Platforms Market Revenue Billion Forecast, by Enterprise Size 2020 & 2034
Table 27: Asia Pacific Multiexperience Development Platforms Market Revenue Billion Forecast, by End Use 2020 & 2034
Table 28: Asia Pacific Multiexperience Development Platforms Market Revenue Billion Forecast, by Country 2020 & 2034
Table 29: China Multiexperience Development Platforms Market Revenue (Billion) Forecast, by Application 2020 & 2034
Table 30: Japan Multiexperience Development Platforms Market Revenue (Billion) Forecast, by Application 2020 & 2034
Table 31: India Multiexperience Development Platforms Market Revenue (Billion) Forecast, by Application 2020 & 2034
Table 32: South Korea Multiexperience Development Platforms Market Revenue (Billion) Forecast, by Application 2020 & 2034
Table 33: Australia Multiexperience Development Platforms Market Revenue (Billion) Forecast, by Application 2020 & 2034
Table 34: Latin America Multiexperience Development Platforms Market Revenue Billion Forecast, by Component 2020 & 2034
Table 35: Latin America Multiexperience Development Platforms Market Revenue Billion Forecast, by Deployment 2020 & 2034
Table 36: Latin America Multiexperience Development Platforms Market Revenue Billion Forecast, by Enterprise Size 2020 & 2034
Table 37: Latin America Multiexperience Development Platforms Market Revenue Billion Forecast, by End Use 2020 & 2034
Table 38: Latin America Multiexperience Development Platforms Market Revenue Billion Forecast, by Country 2020 & 2034
Table 39: Brazil Multiexperience Development Platforms Market Revenue (Billion) Forecast, by Application 2020 & 2034
Table 40: Argentina Multiexperience Development Platforms Market Revenue (Billion) Forecast, by Application 2020 & 2034
Table 41: Colombia Multiexperience Development Platforms Market Revenue (Billion) Forecast, by Application 2020 & 2034
Table 42: Middle East & Africa Multiexperience Development Platforms Market Revenue Billion Forecast, by Component 2020 & 2034
Table 43: Middle East & Africa Multiexperience Development Platforms Market Revenue Billion Forecast, by Deployment 2020 & 2034
Table 44: Middle East & Africa Multiexperience Development Platforms Market Revenue Billion Forecast, by Enterprise Size 2020 & 2034
Table 45: Middle East & Africa Multiexperience Development Platforms Market Revenue Billion Forecast, by End Use 2020 & 2034
Table 46: Middle East & Africa Multiexperience Development Platforms Market Revenue Billion Forecast, by Country 2020 & 2034
Table 47: Saudi Arabia Multiexperience Development Platforms Market Revenue (Billion) Forecast, by Application 2020 & 2034
Table 48: UAE Multiexperience Development Platforms Market Revenue (Billion) Forecast, by Application 2020 & 2034
Table 49: South Africa Multiexperience Development Platforms Market Revenue (Billion) Forecast, by Application 2020 & 2034