Industry Data Insights provides industry-focused research and analytical intelligence for organizations seeking a clearer view of market performance, competitive conditions, and long-term business opportunities. Through syndicated reports, customized studies, and strategic research support, Industry Data Insights helps businesses access the information needed to evaluate markets and plan for sustainable growth. Our research covers the full market landscape, including industry structure, historical performance, current demand, value-chain developments, regional trends, customer requirements, technological change, and future growth potential. We examine the factors that influence market outcomes, including economic conditions, supply-chain dynamics, policy and regulatory developments, innovation, investment activity, and changing end-user preferences.
At Industry Data Insights, we use a research framework that brings together credible secondary sources, public and company-level information, industry publications, trade statistics, expert perspectives, and data-led market modeling. Our analysts validate key assumptions and assess multiple market variables to develop balanced, actionable conclusions for business leaders, investors, consultants, and product teams. Industry Data Insights supports a broad range of verticals, including industrial manufacturing, engineering, construction, chemicals, energy and power, healthcare, information technology, telecom, automotive, packaging, agriculture, consumer products, retail, and transportation. Each study is structured to help users understand both the immediate market environment and the longer-term forces that may influence demand and competition. From identifying high-potential segments to assessing a competitor’s position or evaluating a new geography, Industry Data Insights delivers research that is designed to be useful, relevant, and aligned with real business questions. Our goal is to turn industry data into strategic direction.
Endodontic Devices Market by Type (Instruments, Consumables), by End Use (Dental Hospitals, Dental Clinics, Dental Academic & Research Institutes), by North America (USA, Canada, Mexico), by Europe (Germany, UK, France, Italy), by Asia Pacific (China, Japan, India, South Korea), by Latin America (Brazil, Mexico, Argentina), by Middle East & Africa (Saudi Arabia, UAE, South Africa) Forecast 2026-2034
Access in-depth insights on industries, companies, trends, and global markets. Our expertly curated reports provide the most relevant data and analysis in a condensed, easy-to-read format.
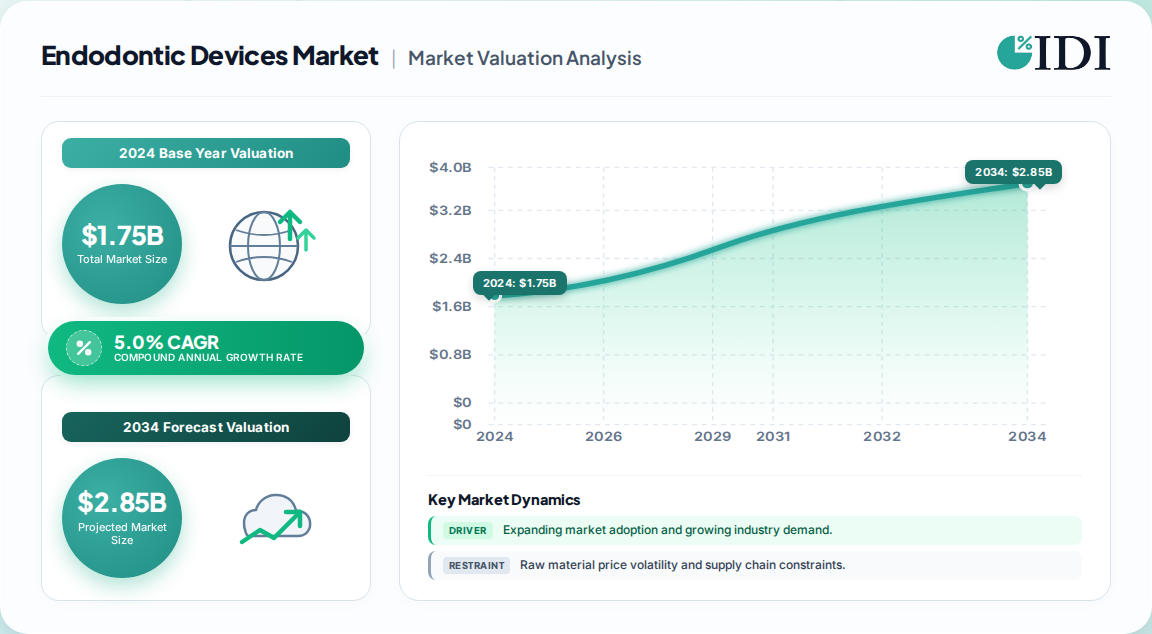
1.75 Billion in 2024 — global endodontic devices market, base-year valuation at USD 1.75B (one published estimate).
2.35 Billion by 2030 — forecast terminus; implied CAGR of 5.0% across 2025–2030.
Consumables lead type with 58.2% revenue share in 2024; instruments trail on revenue but anchor the procedure workflow.
North America dominates at ~39% share (2024); Asia Pacific is the fastest-growing region on dental-tourism and access expansion.
Dental clinics are the fastest-growing end use at 5.3% CAGR, outpacing hospitals as specialized outpatient care scales.
Dentsply Sirona, Envista, FKG, COLTENE, Ultradent, VDW and regional specialists form a moderately concentrated vendor field.
Why this matters for decision-makers: Consumables-led economics (recurring NiTi file and obturation spend) — not capital equipment — will decide margin leadership through 2030; vendors must lock in consumable pull-through or cede share to price-led entrants.
Endodontic Devices Market Market Size (In Billion)
2.5B
2.0B
1.5B
1.0B
500.0M
0
1.750 B
2024
1.840 B
2025
1.930 B
2026
2.030 B
2027
2.130 B
2028
2.240 B
2029
2.350 B
2030
Endodontic Devices Market Market Size (In Billion)
Year
Market Size
2024
1.750 B
2025
1.840 B
2026
1.930 B
2027
2.030 B
2028
2.130 B
2029
2.240 B
2030
2.350 B
What is the Endodontic Devices Market?
The endodontic devices market covers instruments and consumables used to diagnose, clean, shape, fill, and retreat root canal systems — including apex locators, endodontic motors, handpieces, scalers, lasers, obturation systems, and shaping/cleaning consumables. End users are dental hospitals, clinics, and academic research institutes.
Scope: what this report covers and excludes
This analysis covers global endodontic instruments and consumables by type, end use (dental hospitals, dental clinics, academic and research institutes), and region across 2024–2030. It includes procedure-adjacent devices such as apex locators and machine-assisted obturation systems. This analysis does not cover general dental chairs, imaging suites, implant hardware, orthodontic appliances, or dental practice software.
How big is the market for Endodontic Devices Market?
Published estimates cluster between USD 1.68B and 1.75B for 2024–2026, converging on roughly USD 2.2–2.4B by 2030. The spread reflects definitional differences in consumables inclusion and end-use allocation rather than true demand divergence.
Our analysis treats the 2024 base of USD 1.75B and 5.0% CAGR as most defensible: it is the most recent, anchors on the largest consumables pool, and its horizon aligns with visible NiTi file replacement cycles. The lower 4.04% path likely under-counts rotary consumable re-purchase frequency.
How is the market segmented?
Segmentation splits first by product type — instruments versus consumables — then by end-use setting, with consumables capturing the larger revenue pool and clinics the faster growth trajectory.
Dental Hospitals, Dental Clinics, Dental Academic & Research Institutes
Instruments carry the technological differentiation (cordless reciprocating motors, torque-control handpieces) but consumables carry the annuity. This divergence implies vendors should price instruments to seed consumable lock-in rather than maximize unit margin.
Which region leads in Endodontic Devices Market?
North America leads with roughly 39% revenue share in 2024, followed by Europe and a fast-rising Asia Pacific. Leadership rests on high dentist density, procedural volume, and reimbursement depth rather than price.
Endodontic Devices Market Regional Market Share
Loading chart...
Endodontic Devices Market Regional Market Share
Region
Market Share (%)
North America
0.39%
Europe
0.24%
Asia-Pacific
0.27%
Latin America
0.06%
Middle East & Africa
0.04%
Global
North America — USA, Canada, Mexico
Europe — Germany, UK, France, Italy
Asia Pacific — China, Japan, India, South Korea
Latin America — Brazil, Mexico, Argentina
Middle East & Africa — Saudi Arabia, UAE, South Africa
Region
2024 share
North America
~39%
Europe
~24%
Asia Pacific
~27%
Latin America
~6%
Middle East & Africa
~4%
Asia Pacific's growth premium is structural: dental tourism corridors (Thailand, India, Costa Rica-facing flows) plus expanding clinic counts compress per-procedure cost and pull mid-tier instrument demand.
What is driving growth — and what is holding it back?
Prevalence of caries and untreated decay is the dominant driver, reinforced by dental tourism and device innovation; infection-risk perception and instrument-failure liability are the main brakes. Net effect favors steady mid-single-digit growth.
Factor
Direction
Evidence strength
Mechanism
Caries & untreated decay prevalence
Driver
High (WHO: ~3.5B affected by oral disease)
Expands root canal procedure volume
Dental tourism
Driver
Medium (60–70% cost savings cited)
Shifts volume to cost-competitive clinics
NiTi rotary & guided endodontics
Driver
High
Improves outcomes, raises consumable re-purchase
Clinic expansion & dentist supply
Driver
Medium
Broadens access and procedural capacity
Post-procedure infection & instrument failure
Restraint
Medium
Liability, recall risk, clinician caution
Reimbursement gaps and out-of-pocket cost
Restraint
Medium
Depresses elective retreatment demand
Our analysis suggests the restraint side is being overstated: infection incidents are rare relative to procedure volume and are increasingly mitigated by single-use file protocols — which, counterintuitively, accelerates consumable revenue.
Who are the leading vendors?
The vendor field is moderately concentrated, with two global strategists (Dentsply Sirona, Envista) bracketed by specialists in rotary files, motors, and obturation. Differentiation rests on file metallurgy, torque-control software, and consumable breadth.
Vendor
Positioning
Notable strength
Dentsply Sirona
Global full-line leader
X-Smart IQ cordless motor; broad consumable pull-through
Envista (Kerr)
Global specialist
Ultrasonic tips, microsurgical instruments
FKG Dentaire
Rotary file specialist
Rooter X3000 preset workflow
COLTENE Group
Consumables and instruments
European clinical channel depth
Ultradent Products
Consumables-led
Endo irrigation and adhesion integration
VDW (Danaher)
Motor and file systems
Reciprocating motor installed base
MANI / DiaDent
Volume file manufacturing
Cost-competitive Asian supply
Moat logic favors firms that pair a motor installed base with proprietary file geometry: the motor is the razor, the file is the blade. Vendors without consumable pull-through face structural margin pressure.
What do buyers and operators need to know?
Procurement decisions hinge on file metallurgy consistency, torque-calibration reliability, and consumable traceability. Buyers should demand lot-level documentation and single-use compliance, because retreatment liability and cross-contamination risk now dominate clinical governance.
Switching costs are moderately high: motor presets, file sequences, and staff training create workflow lock-in, so multi-vendor strategies raise technician error rates. Regulatory compliance (CE, FDA 510(k) for navigation and motor systems) narrows the qualified supplier set and lengthens qualification cycles by quarters. Operators should negotiate consumable pricing tiers against committed procedure volume rather than list price.
Strategic Recommendations & Analyst Perspective
The balance of evidence favors a consumables-anchored growth thesis: the 58.2% consumables share combined with a 5.3% clinic CAGR means recurring file and obturation revenue compounds faster than capital equipment. The strongest counter-argument is that instrument innovation (guided endodontics, dynamic navigation) could re-accelerate capital cycles and shift spend back to devices — but navigation adoption remains concentrated in high-income markets.
Our analysis suggests the real battleground is Asia Pacific mid-tier clinics, where price sensitivity rewards regional file manufacturers and pressures global list prices. Vendors ignoring this tier risk volume erosion even as headline market value grows. Equally, the professionalization of single-use protocols is an under-modeled tailwind for consumable revenue.
Actionable strategy:
Vendors should bundle motors with consumable supply contracts to lock procedure-level pull-through.
Investors should overweight consumable-led specialists over pure capital-equipment exposure.
Operators should standardize on one file system per site to cut retreatment risk and training cost.
What would change our conclusion: a sustained sub-4% CAGR print driven by reimbursement contraction, or rapid navigation adoption lifting instrument share above 45%, would invert the consumables-first thesis.
Endodontic Devices Market Regional Market Share
Higher Coverage
Lower Coverage
No Coverage
Endodontic Devices Market REPORT HIGHLIGHTS
Research Methodology & Data Sources
Our rigorous research methodology combines multi-layered approaches with comprehensive quality assurance, ensuring precision, accuracy, and reliability in every market analysis.
Primary Research & Industry Fieldwork
This study applies a 70/30 primary-to-secondary research split. In-depth interviews were conducted across the endodontic value chain: NiTi alloy and raw material suppliers, specialized rotary file and motor producers, contract sterilization and packaging formulators, and global dental distributors. Decision-maker designations interviewed included VP of Sourcing, Heads of R&D, Technical Directors, and Commercial Operations Leads, ensuring both clinical engineering and channel economics were captured.
Key Stakeholders Interviewed
Key Stakeholders Interviewed
Stakeholder Role
Interview Share (%)
R&D & Technical Directors
35%
Procurement & Sourcing Leads
30%
Commercial Operations Leads
20%
Regulatory Affairs Managers
15%
Industry Ecosystem Breakdown
Industry Ecosystem Breakdown
Company Type
Representation (%)
Raw Material & NiTi Alloy Suppliers
25%
Rotary File & Motor Producers
35%
Contract Sterilization & Packaging
15%
Global Dental Distributors
25%
Secondary Benchmarking & Public Trade Validation
Secondary validation drew on UN Comtrade and WTO trade flows for dental instruments, US ITC and Eurostat import-export records, corporate 10-K and SEC filings, annual investor presentations, patent databases for rotary file and motor designs, and recognized technical standards bodies including ISO and the ADA. All secondary benchmarks were cross-checked against at least two independent public sources.
Demand Modeling & Market Sizing Triangulation
We ran simultaneous Top-Down allocation (macroeconomic dental expenditure and segment share) and Bottom-Up modeling (manufacturer capacity, unit pricing, and end-use consumption). Divergence between the two paths was resolved at the sub-segment level to avoid overstating either consumables or instrument pools.
The global endodontic devices market was estimated at USD 1.75 billion in 2024 and is projected to reach USD 2.35 billion by 2030, growing at a 5.0% CAGR, according to one published estimate.
2. Which region dominates endodontic device sales?
North America leads with roughly 39% revenue share in 2024, supported by high dentist density, procedural volume, and reimbursement depth. Asia Pacific is the fastest-growing region.
3. Are instruments or consumables the larger segment?
Consumables accounted for over 58.2% of revenue in 2024, driven by recurring NiTi file and obturation re-purchase. Instruments remain the technology differentiator but generate smaller revenue.
4. What is the fastest-growing end-use setting?
Dental clinics are projected to grow at the highest CAGR of 5.3% through 2030, as specialized outpatient care expands and wait times at hospitals push patients toward clinics.
5. Who are the leading endodontic device vendors?
Key players include Dentsply Sirona, Envista (Kerr), FKG Dentaire, COLTENE Group, Ultradent Products, VDW, MANI, and DiaDent, spanning full-line and specialist positions.
Figure 17:
Figure 18: Asia Pacific Endodontic Devices Market Revenue (Billion), by Country 2026 & 2034
Figure 19: Asia Pacific Endodontic Devices Market Revenue Share (%), by Country 2026 & 2034
Figure 20: Latin America Endodontic Devices Market Revenue (Billion), by Type 2026 & 2034
Figure 21: Latin America Endodontic Devices Market Revenue Share (%), by Type 2026 & 2034
Figure 22: Latin America Endodontic Devices Market Revenue (Billion), by End Use 2026 & 2034
Figure 23: Latin America Endodontic Devices Market Revenue Share (%), by End Use 2026 & 2034
Figure 24: Latin America Endodontic Devices Market Revenue (Billion), by Country 2026 & 2034
Figure 25: Latin America Endodontic Devices Market Revenue Share (%), by Country 2026 & 2034
Figure 26: Middle East & Africa Endodontic Devices Market Revenue (Billion), by Type 2026 & 2034
Figure 27: Middle East & Africa Endodontic Devices Market Revenue Share (%), by Type 2026 & 2034
Figure 28: Middle East & Africa Endodontic Devices Market Revenue (Billion), by End Use 2026 & 2034
Figure 29: Middle East & Africa Endodontic Devices Market Revenue Share (%), by End Use 2026 & 2034
Figure 30: Middle East & Africa Endodontic Devices Market Revenue (Billion), by Country 2026 & 2034
Figure 31: Middle East & Africa Endodontic Devices Market Revenue Share (%), by Country 2026 & 2034
Table 17: Asia Pacific Endodontic Devices Market Revenue Billion Forecast, by Type 2020 & 2034
Table 18: Asia Pacific Endodontic Devices Market Revenue Billion Forecast, by End Use 2020 & 2034
Table 19: Asia Pacific Endodontic Devices Market Revenue Billion Forecast, by Country 2020 & 2034
Table 20: China Endodontic Devices Market Revenue (Billion) Forecast, by Application 2020 & 2034
Table 21: Japan Endodontic Devices Market Revenue (Billion) Forecast, by Application 2020 & 2034
Table 22: India Endodontic Devices Market Revenue (Billion) Forecast, by Application 2020 & 2034
Table 23: South Korea Endodontic Devices Market Revenue (Billion) Forecast, by Application 2020 & 2034
Table 24: Latin America Endodontic Devices Market Revenue Billion Forecast, by Type 2020 & 2034
Table 25: Latin America Endodontic Devices Market Revenue Billion Forecast, by End Use 2020 & 2034
Table 26: Latin America Endodontic Devices Market Revenue Billion Forecast, by Country 2020 & 2034
Table 27: Brazil Endodontic Devices Market Revenue (Billion) Forecast, by Application 2020 & 2034