Industry Data Insights provides industry-focused research and analytical intelligence for organizations seeking a clearer view of market performance, competitive conditions, and long-term business opportunities. Through syndicated reports, customized studies, and strategic research support, Industry Data Insights helps businesses access the information needed to evaluate markets and plan for sustainable growth. Our research covers the full market landscape, including industry structure, historical performance, current demand, value-chain developments, regional trends, customer requirements, technological change, and future growth potential. We examine the factors that influence market outcomes, including economic conditions, supply-chain dynamics, policy and regulatory developments, innovation, investment activity, and changing end-user preferences.
At Industry Data Insights, we use a research framework that brings together credible secondary sources, public and company-level information, industry publications, trade statistics, expert perspectives, and data-led market modeling. Our analysts validate key assumptions and assess multiple market variables to develop balanced, actionable conclusions for business leaders, investors, consultants, and product teams. Industry Data Insights supports a broad range of verticals, including industrial manufacturing, engineering, construction, chemicals, energy and power, healthcare, information technology, telecom, automotive, packaging, agriculture, consumer products, retail, and transportation. Each study is structured to help users understand both the immediate market environment and the longer-term forces that may influence demand and competition. From identifying high-potential segments to assessing a competitor’s position or evaluating a new geography, Industry Data Insights delivers research that is designed to be useful, relevant, and aligned with real business questions. Our goal is to turn industry data into strategic direction.
Middle East Coiled Tubing Market Report by Service (Well Intervention & Production, Drilling, Perforating, Fracturing, Milling, Nitrogen, Engineering Services), by Operation (Circulation, Pumping, Logging, Perforation), by Application (Onshore, Offshore), by Middle East (Saudi Arabia, UAE, Kuwait, Qatar, Oman, Rest of Middle East) Forecast 2026-2034
Middle East Coiled Tubing Market Report 2025
Discover the Latest Market Insight Reports
Access in-depth insights on industries, companies, trends, and global markets. Our expertly curated reports provide the most relevant data and analysis in a condensed, easy-to-read format.
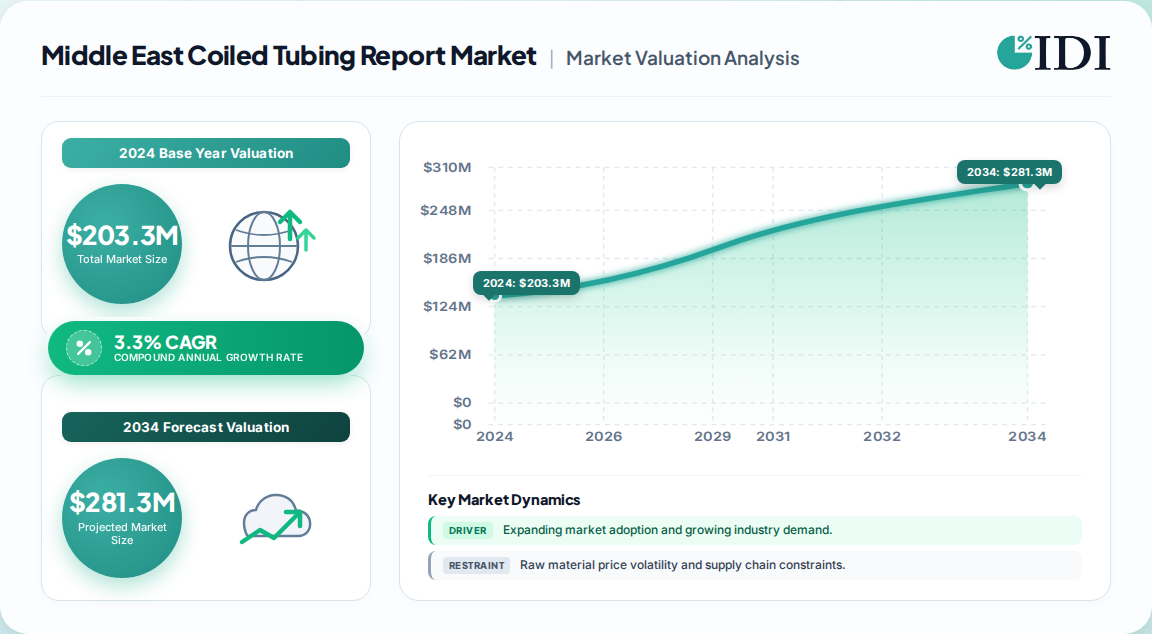
203.3 Million — the Middle East coiled tubing market size in 2024, forecast to reach 279.7 Million by 2033 at a 3.3% CAGR.
Well intervention & production is the dominant service, holding 66.2% of 2024 revenue; drilling is the fastest-growing service line.
Saudi Arabia leads with 48.7% regional revenue share in 2024, followed by the UAE and Kuwait.
Logging is the largest operation at 21.8% share; offshore is the fastest-growing application at a 4.2% CAGR.
Schlumberger, Baker Hughes, Halliburton, Weatherford and Oceaneering anchor a moderately fragmented competitive landscape.
Why this matters for decision-makers: Vendors must pivot from generic intervention toward fiber-optic, automated and offshore-capable coiled tubing packages, or face margin compression as mature-field work becomes commoditized.
Middle East Coiled Tubing Market Report Market Size (In Million)
250.0M
200.0M
150.0M
100.0M
50.0M
0
203.0 M
2024
210.0 M
2025
217.0 M
2026
224.0 M
2027
232.0 M
2028
239.0 M
2029
247.0 M
2030
Middle East Coiled Tubing Market Report Market Size (In Million)
Year
Market Size
2024
203.0 M
2025
210.0 M
2026
217.0 M
2027
224.0 M
2028
232.0 M
2029
239.0 M
2030
247.0 M
What is the Middle East Coiled Tubing Market Report?
The Middle East Coiled Tubing Market Report is an executive-grade analysis of coiled tubing services, equipment and operations across GCC, North African and Levant oil and gas assets. It sizes the market, segments by service, operation and application, and profiles the vendors, procurement risks and growth drivers shaping 2025–2033 capital allocation.
Scope: what this report covers and excludes
This report covers coiled tubing services and equipment deployed in onshore and offshore oil and gas fields across the Middle East, segmented by service (well intervention and production, drilling, perforating, fracturing, milling, nitrogen and engineering), by operation (circulation, pumping, logging, perforation) and by country. This analysis does not cover wireline, hydraulic workover, conventional rotary drilling or global markets outside the Middle East; adjacent Middle East oilfield services categories are referenced only as competitive substitutes.
How big is the market for Middle East Coiled Tubing Market Report?
The Middle East coiled tubing market was estimated at 203.3 Million in 2024 and is projected to reach 279.7 Million by 2033, at a 3.3% CAGR — a moderate but durable growth path anchored in mature-field intervention and offshore expansion. Competing published estimates differ in scope and horizon, as the table below shows.
Estimate
Base year
Horizon
CAGR
Definition / scope
Attribution
203.3 Million
2024
2033
3.3%
Middle East coiled tubing services and equipment, onshore and offshore
One published estimate
Greater than 4% CAGR
2024
2030
>4%
Middle East & Africa coiled tubing, services-led
A competing analysis
3.54 Billion global / 2025
2025
2034
7.36%
Global coiled tubing, all end-uses
A global benchmark analysis
The Middle East-specific figure is the most defensible for regional buyers because it isolates the region and the services scope. Our analysis suggests the wider "Middle East & Africa >4%" figure embeds African frontier activity and a different service definition; the global 7.36% benchmark reflects North American shale intensity that does not transfer to Gulf asset bases. Buyers should treat the 3.3% regional CAGR as the planning base and stress-test upside from offshore and unconventional gas.
How is the market segmented?
The market is segmented by service, operation and application, with well intervention and production dominating revenue while drilling and offshore grow fastest.
Our analysis suggests the service mix is structurally defensive: intervention work is recurring and tied to production targets, whereas drilling-linked demand is more cyclical. That makes the intervention-heavy base a buffer against oil-price swings, but it also caps pricing power unless vendors bundle diagnostic and digital tools.
Which country leads in Middle East Coiled Tubing Market Report?
Saudi Arabia leads the Middle East coiled tubing market with 48.7% of regional revenue in 2024, driven by mature onshore fields, the Jafurah unconventional gas program and expanding horizontal well laterals. The UAE and Kuwait follow, with Qatar and Oman gaining on offshore and EOR spending.
Parent
Children
Middle East
Saudi Arabia, UAE, Kuwait, Qatar, Oman, Rest of Middle East
Country
2024 share
Saudi Arabia
48.7%
UAE
16.5%
Kuwait
11.8%
Qatar
8.9%
Oman
7.4%
Rest of Middle East
6.7%
This divergence implies concentration risk: nearly half of regional demand sits in one national oil company's work program. Service providers with Saudi framework agreements hold a structural advantage, but buyers in smaller markets should expect mobilization premiums and longer lead times.
What is driving growth — and what is holding it back?
Growth is driven by mature-field intervention demand, enhanced oil recovery and offshore expansion; it is restrained by oil-price volatility, high maintenance costs and skilled-labor scarcity.
Factor
Direction
Evidence strength
Mechanism
Mature field redevelopment
Driver
High
Scale removal, acidizing and re-perforation sustain output at aging reservoirs
Delays discretionary intervention and CAPEX decisions
High maintenance and logistics costs
Restraint
Medium
Offshore mobilization and equipment upkeep erode margins
Skilled labor scarcity
Restraint
Medium
Advanced CT units require certified crews
The balance favors steady, not explosive, growth. Our analysis suggests the restraint impact is asymmetric: price downturns delay projects but do not eliminate mature-field work, because production targets are national policy in the GCC. That gives the market a floor that global benchmarks miss.
Who are the leading vendors?
Schlumberger, Baker Hughes, Halliburton, Weatherford and Oceaneering lead a moderately fragmented Middle East coiled tubing market, differentiated by integrated service breadth, offshore capability and national oil company relationships.
Vendor
Position
Differentiation
Schlumberger
Global leader
Integrated intervention, fiber-optic diagnostics
Baker Hughes
Global leader
Offshore capacity, tubular running integration
Halliburton
Global leader
Intervention and plug-and-abandonment scale
Weatherford
Specialist
Coiled tubing equipment and tools
Oceaneering
Niche
Offshore and subsea intervention
Competitive moats rest on framework agreements and crew depth rather than technology alone. Our analysis suggests national energy service champions and regional cementing and stimulation providers increasingly win scope adjacent to coiled tubing, compressing margins for pure-play specialists.
What do buyers and operators need to know?
Buyers should prioritize proven offshore mobilization capability, certified crews and real-time downhole diagnostics when selecting vendors, because intervention delays translate directly into deferred production. Procurement risk is concentrated in single-country contract exposure and equipment lead times, while switching costs are high due to crew familiarity and tool-string compatibility. Regulatory compliance centers on HSE standards, sour-service qualification and national content requirements in Saudi Arabia and the UAE. Our analysis suggests multi-year framework agreements with performance-linked KPIs outperform spot contracting in this market, but buyers should retain competitive tension through dual-vendor awards.
Strategic Recommendations & Analyst Perspective
The balance of evidence favors a moderate-growth, intervention-led market through 2033, with offshore and unconventional gas as the credible upside. The strongest counter-argument is that a sustained oil-price slump could defer the Jafurah-linked and offshore programs that underpin faster scenarios; we view this as a timing risk rather than a structural break, because GCC production targets are policy-driven. This divergence from global benchmarks implies vendors should not import North American shale economics into Gulf planning.
Vendors: Prioritize fiber-optic and automated coiled tubing packages for mature Saudi and UAE fields to defend pricing as basic intervention commoditizes.
Operators: Lock multi-year framework agreements with dual-vendor awards to secure offshore-capable crews and mitigate concentration risk.
Investors: Favor service providers with Saudi framework positions and offshore logistics depth over pure onshore specialists.
Evidence that would change this conclusion: a sustained sub-USD 60 crude environment combined with delayed Jafurah ramp-up, or a step-change in wireline and hydraulic workover substitution, would push the market toward the low end of the 3.3% trajectory.
Middle East Coiled Tubing Market Report Regional Market Share
Loading chart...
Middle East Coiled Tubing Market Report Regional Market Share
Region
Market Share (%)
Middle East & Africa
0.62%
Asia-Pacific
0.21%
Europe
0.09%
North America
0.06%
South America
0.02%
Middle East Coiled Tubing Market Report Regional Market Share
Higher Coverage
Lower Coverage
No Coverage
Middle East Coiled Tubing Market Report REPORT HIGHLIGHTS
Research Methodology & Data Sources
Our rigorous research methodology combines multi-layered approaches with comprehensive quality assurance, ensuring precision, accuracy, and reliability in every market analysis.
Primary Research & Industry Fieldwork
Our research applies a 70/30 primary-to-secondary split. In-depth interviews were conducted across the value chain with coiled tubing equipment manufacturers, service providers, national oil company well engineering teams, chemical and stimulation suppliers, and offshore logistics contractors. Decision-makers interviewed include VP-level Sourcing, Heads of Well Intervention R&D, Technical Directors and Commercial Operations Leads, ensuring operational and procurement perspectives are both captured.
Key Stakeholders Interviewed
Key Stakeholders Interviewed
Stakeholder Role
Interview Share (%)
VP Sourcing & Procurement
35%
Well Intervention R&D Heads
30%
Technical Directors
20%
Commercial Operations Leads
15%
Industry Ecosystem Breakdown
Industry Ecosystem Breakdown
Company Type
Representation (%)
Coiled Tubing Service Providers
45%
Equipment Manufacturers
30%
National Oil Company Well Teams
15%
Offshore Logistics Contractors
10%
Secondary Benchmarking & Public Trade Validation
We triangulate against UN Comtrade and WTO trade flows, US ITC and Eurostat datasets, corporate 10-K and annual investor filings, patent databases, and recognized technical standards from API and ISO. These sources validate equipment flows, service intensity and safety qualification requirements.
Demand Modeling & Market Sizing Triangulation
Simultaneous top-down allocation from regional upstream CAPEX and bottom-up modeling of unit capacity, pricing and end-use consumption are reconciled to produce a single base-year valuation and compound forecast.
American Petroleum Institute (API) standards and technical publications
ISO 13628 and related well intervention standards
UN Comtrade and WTO oilfield equipment trade statistics
National oil company annual reports and investor disclosures
Aspects
Details
Study Period
2020-2034
Base Year
2025
Estimated Year
2026
Forecast Period
2026-2034
Historical Period
2020-2025
Growth Rate
CAGR of 3.3% from 2020-2034
Segmentation
By Service
Well Intervention & Production
Drilling
Perforating
Fracturing
Milling
Nitrogen
Engineering Services
By Operation
Circulation
Pumping
Logging
Perforation
By Application
Onshore
Offshore
By Geography
Middle East
Saudi Arabia
UAE
Kuwait
Qatar
Oman
Rest of Middle East
Table of Contents
1. Middle East Coiled Tubing Market Report Introduction
1.1. Research Scope
1.2. Market Segmentation
1.3. Research Objective
1.4. Definitions and Assumptions
2. Middle East Coiled Tubing Market Report Executive Summary
2.1. Market Snapshot
3. Middle East Coiled Tubing Market Report Dynamics
3.1. Introduction
3.2. Market Drivers
3.3. Market Restrains
3.4. Market Trends
4. Middle East Coiled Tubing Market Report Factor Analysis
4.1. Porters Five Forces
4.1.1. Bargaining Power of Suppliers
4.1.2. Bargaining Power of Buyers
4.1.3. Threat of New Entrants
4.1.4. Threat of Substitutes
4.1.5. Competitive Rivalry
4.2. PESTEL analysis
4.3. BCG Analysis
4.3.1. Stars (High Growth, High Market Share)
4.3.2. Cash Cows (Low Growth, High Market Share)
4.3.3. Question Mark (High Growth, Low Market Share)
4.3.4. Dogs (Low Growth, Low Market Share)
4.4. Ansoff Matrix Analysis
4.5. Supply Chain Analysis
4.6. Regulatory Landscape
4.7. Current Market Potential and Opportunity Assessment (TAM–SAM–SOM Framework)
4.8. IDI Analyst Note
5. Middle East Coiled Tubing Market Report Analysis, Insights and Forecast, 2020-2034
5.1. Analysis, Insights and Forecast - by Service
5.1.1. Well Intervention & Production
5.1.2. Drilling
5.1.3. Perforating
5.1.4. Fracturing
5.1.5. Milling
5.1.6. Nitrogen
5.1.7. Engineering Services
5.2. Analysis, Insights and Forecast - by Operation
5.2.1. Circulation
5.2.2. Pumping
5.2.3. Logging
5.2.4. Perforation
5.3. Analysis, Insights and Forecast - by Application
5.3.1. Onshore
5.3.2. Offshore
5.4. Analysis, Insights and Forecast - by Region
5.4.1. Middle East
6. Middle East Coiled Tubing Market Report Competitive Analysis
6.1. Company Profiles
6.2. Market Entropy
6.2.1. Company's Key Areas Served
6.2.2. Recent Developments
6.3. Company Market Share Analysis, 2026
6.3.1. Top 5 Companies Market Share Analysis
6.3.2. Top 3 Companies Market Share Analysis
6.4. List of Potential Customers
7. Middle East Coiled Tubing Market Report Research Methodology
List of Figures
Figure 1: Middle East Coiled Tubing Market Report Revenue Breakdown (Million, %) by Product 2026 & 2034
Figure 2: Middle East Coiled Tubing Market Report Value Share (%), by Service 2026 & 2034
Figure 3: Middle East Coiled Tubing Market Report Value Share (%), by Operation 2026 & 2034
Figure 4: Middle East Coiled Tubing Market Report Value Share (%), by Application 2026 & 2034
Figure 5: Middle East Coiled Tubing Market Report Share (%) by Company 2026
List of Tables
Table 1: Middle East Coiled Tubing Market Report Revenue Million Forecast, by Service 2020 & 2034
Table 2: Middle East Coiled Tubing Market Report Revenue Million Forecast, by Operation 2020 & 2034
Table 3: Middle East Coiled Tubing Market Report Revenue Million Forecast, by Application 2020 & 2034
Table 4: Middle East Coiled Tubing Market Report Revenue Million Forecast, by Region 2020 & 2034
Table 5: Middle East Middle East Coiled Tubing Market Report Revenue Million Forecast, by Service 2020 & 2034
Table 6: Middle East Middle East Coiled Tubing Market Report Revenue Million Forecast, by Operation 2020 & 2034
Table 7: Middle East Middle East Coiled Tubing Market Report Revenue Million Forecast, by Application 2020 & 2034
Table 8: Middle East Middle East Coiled Tubing Market Report Revenue Million Forecast, by Country 2020 & 2034
Table 9: Saudi Arabia Middle East Coiled Tubing Market Report Revenue (Million) Forecast, by Application 2020 & 2034
Table 10: UAE Middle East Coiled Tubing Market Report Revenue (Million) Forecast, by Application 2020 & 2034
Table 11: Kuwait Middle East Coiled Tubing Market Report Revenue (Million) Forecast, by Application 2020 & 2034
Table 12: Qatar Middle East Coiled Tubing Market Report Revenue (Million) Forecast, by Application 2020 & 2034
Table 13: Oman Middle East Coiled Tubing Market Report Revenue (Million) Forecast, by Application 2020 & 2034
Table 14: Rest of Middle East Middle East Coiled Tubing Market Report Revenue (Million) Forecast, by Application 2020 & 2034
Frequently Asked Questions
1. What is the Middle East coiled tubing market size?
The market was estimated at 203.3 Million in 2024 and is projected to reach 279.7 Million by 2033, reflecting steady intervention-led demand across GCC oil and gas assets.
2. What is the Middle East coiled tubing market growth rate?
The market is forecast to grow at a 3.3% CAGR from 2025 to 2033, with offshore application expanding faster at 4.2% as subsea intervention increases.
3. Which country dominates the Middle East coiled tubing market?
Saudi Arabia dominates with a 48.7% revenue share in 2024, supported by mature onshore fields, the Jafurah gas program and expanding horizontal well laterals.
4. Which segment leads the Middle East coiled tubing market?
Well intervention and production leads with 66.2% of 2024 revenue, while drilling is the fastest-growing service line as coiled tubing drilling adoption rises.
5. Who are the key players in the Middle East coiled tubing market?
Schlumberger, Baker Hughes, Halliburton, Weatherford and Oceaneering lead a moderately fragmented market, differentiated by integrated service breadth and offshore capability.