Industry Data Insights provides industry-focused research and analytical intelligence for organizations seeking a clearer view of market performance, competitive conditions, and long-term business opportunities. Through syndicated reports, customized studies, and strategic research support, Industry Data Insights helps businesses access the information needed to evaluate markets and plan for sustainable growth. Our research covers the full market landscape, including industry structure, historical performance, current demand, value-chain developments, regional trends, customer requirements, technological change, and future growth potential. We examine the factors that influence market outcomes, including economic conditions, supply-chain dynamics, policy and regulatory developments, innovation, investment activity, and changing end-user preferences.
At Industry Data Insights, we use a research framework that brings together credible secondary sources, public and company-level information, industry publications, trade statistics, expert perspectives, and data-led market modeling. Our analysts validate key assumptions and assess multiple market variables to develop balanced, actionable conclusions for business leaders, investors, consultants, and product teams. Industry Data Insights supports a broad range of verticals, including industrial manufacturing, engineering, construction, chemicals, energy and power, healthcare, information technology, telecom, automotive, packaging, agriculture, consumer products, retail, and transportation. Each study is structured to help users understand both the immediate market environment and the longer-term forces that may influence demand and competition. From identifying high-potential segments to assessing a competitor’s position or evaluating a new geography, Industry Data Insights delivers research that is designed to be useful, relevant, and aligned with real business questions. Our goal is to turn industry data into strategic direction.
Network Repeaters Market Report by Product Type (Wi-Fi Repeaters, Cellular Repeaters, Signal Repeaters, Bluetooth Repeaters, Optical Repeaters, Others), by Technology (Analog, Digital, 2G/3G/4G/LTE, 5G NR, Others), by Deployment (Indoor, Outdoor, Mobile), by Frequency Band (Low Band, Mid Band, High Band, Others), by End Use (Service Providers, Government & Public Safety, Enterprises & Corporates, Education, Healthcare, Others), by North America (USA, Canada, Mexico), by Europe (Germany, UK, France, Italy), by Asia Pacific (China, Japan, India, South Korea, Australia), by Latin America (Brazil, Mexico, Argentina), by Middle East & Africa (Saudi Arabia, UAE, South Africa) Forecast 2026-2034
Access in-depth insights on industries, companies, trends, and global markets. Our expertly curated reports provide the most relevant data and analysis in a condensed, easy-to-read format.
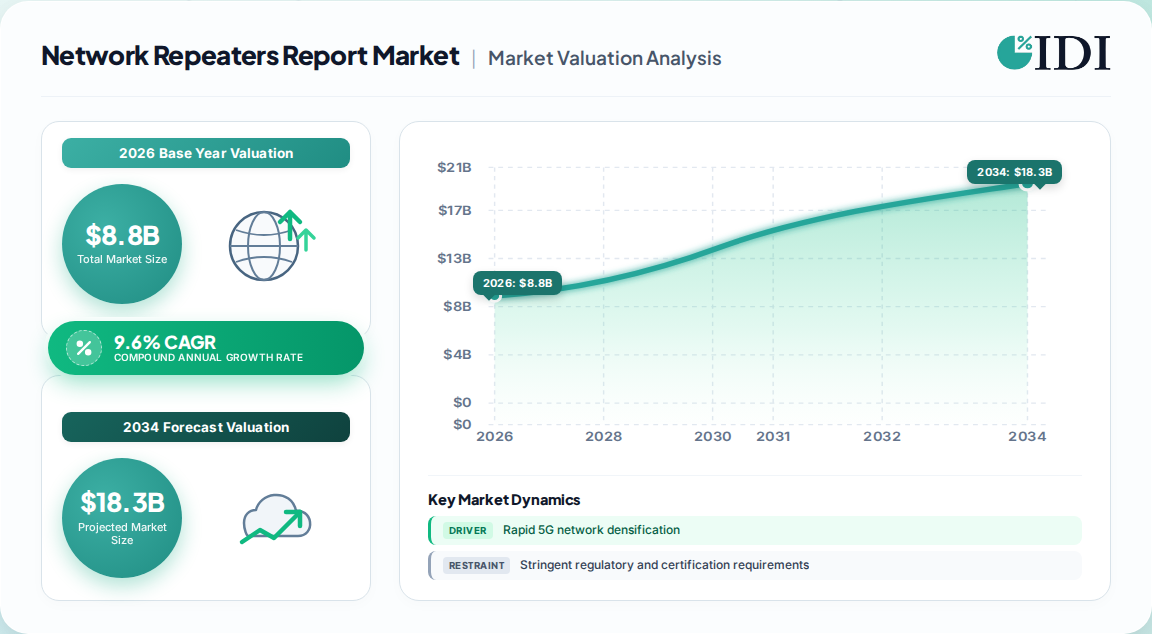
The global Network Repeaters Market Report sizes the market at USD 8.8 billion in 2026, with a 9.6% CAGR taking it to USD 16.8 billion by 2033.
Growth is powered by 5G densification, soaring mobile data traffic, private 5G networks and smart-city build-outs that leave fewer coverage gaps.
Indoor repeaters hold the largest deployment share (over 52%), while 5G NR repeaters are the fastest-growing technology at a 22.4% CAGR.
North America leads with roughly 30% revenue share; Asia-Pacific is the fastest-growing region, compounding at 11.3% through 2033.
CommScope, Huawei, Nokia and Cisco are among the ten leading suppliers profiled in the competitive landscape.
Stringent FCC/CE certification and signal-interference risks remain the key constraints on faster adoption, particularly for smaller vendors.
Why this matters for decision-makers: Vendors that do not pivot toward digital, multi-band 5G NR repeaters will face margin compression as analog, single-band units commoditize.
Network Repeaters Market Report Market Size (In Billion)
15.0B
10.0B
5.0B
0
8.150 B
2025
8.800 B
2026
9.640 B
2027
10.57 B
2028
11.58 B
2029
12.69 B
2030
13.91 B
2031
Network Repeaters Market Report Market Size (In Billion)
Year
Market Size
2025
8.150 B
2026
8.800 B
2027
9.640 B
2028
10.57 B
2029
11.58 B
2030
12.69 B
2031
13.91 B
What is the Network Repeaters Market Report?
This report is a decision-ready analysis of the global market for devices that receive weak network signals and retransmit them at full strength across cellular, Wi-Fi, optical and public-safety networks. It covers market size, segmentation, regional demand, vendor strategy, procurement criteria and forecasts through 2033.
Scope: what this report covers and excludes
The analysis is global, covering product types (Wi-Fi, cellular, signal, Bluetooth, optical and others), deployment modes (indoor, outdoor, mobile), technologies (analog, digital, 2G–5G NR), frequency bands, end users and all major regions. This analysis does not cover base-station equipment, small cells with independent baseband processing, DAS headend equipment, or consumer-grade Wi-Fi mesh devices.
How big is the market for Network Repeaters Market Report?
Multiple published estimates converge on a roughly 9.6% CAGR from 2026 to 2033, but base-year values and horizons differ — a definitional gap that materially affects sizing.
Estimate
Base year
Horizon
CAGR
Definition / scope
Attribution
USD 8.9 Bn
2026
2033
9.6%
Broad network repeaters incl. Wi-Fi, optical
One published estimate
USD 8.8 Bn
2026
2033
9.6%
Network repeaters by type, technology, deployment
A competing analysis
USD 8.15 Bn
2025
2033
9.6%
Network repeaters, 5G and coverage enhancement
Public press release
USD 3.92 Bn
2026
2036
8.9%
Repeater market excl. base stations and DAS
An alternative research benchmark
Our analysis suggests the USD 8.8 billion (2026) figure is the most defensible for the broad network-repeaters definition, because it sits between the narrowest and broadest scopes and aligns with the 9.6% consensus growth path.
How is the market segmented?
Segmentation spans product type, technology, deployment, frequency band and end user — with Wi-Fi and cellular repeaters dominating revenue and 5G NR the fastest-growing niche.
Service Providers, Government & Public Safety, Enterprises, Education, Healthcare, Others
Cellular repeaters lead the product-type category at over 35% share, while Wi-Fi repeaters command a comparable or larger share on broader definitions. Digital repeaters lead technology at over 30% share. This tells buyers that the revenue center of gravity is digital, cellular-capable equipment, not legacy analog boosters.
Which region leads in Network Repeaters Market Report?
North America leads the global network repeaters market with roughly 30% revenue share, underpinned by advanced 5G rollouts, federal broadband funding and mandatory in-building public-safety coverage rules. Asia-Pacific is the fastest-growing region at an 11.3% CAGR.
Asia-Pacific: China, Japan, India, South Korea, Australia
Latin America: Brazil, Mexico, Argentina
Middle East & Africa: Saudi Arabia, UAE, South Africa
Our analysis suggests the North America–Asia-Pacific split is shifting. US leadership rests on regulatory-mandated in-building coverage, while Asia-Pacific growth is volume-led via China's 5G densification and India's BharatNet program. Vendors with North American compliance expertise have a durable near-term moat; vendors with Asia-Pacific cost structures will win on scale.
What is driving growth — and what is holding it back?
5G densification and rising mobile data traffic are the primary growth engines, while regulatory certification and interference risks cap the pace of adoption.
FCC rules force coverage upgrades in public venues
IoT/private 5G expansion
Driver
Medium
Creates connectivity demand in coverage-deficient sites
Regulatory certification (FCC, CE, TRAI)
Restraint
High
Adds cost and time-to-market, especially for smaller players
Signal interference and compatibility
Restraint
Medium
Analog units and legacy gear conflict with 5G NR / HetNet
The balance favors growth: demand drivers are structural and regulation-backed, whereas restraints are largely addressable through digital product design and compliance investment. The second-order effect is consolidation — vendors that cannot fund certification and 5G R&D will exit or be acquired.
Who are the leading vendors?
The competitive landscape is led by CommScope, Huawei, Nokia and Cisco, alongside specialists such as Ericsson, SOLiD, Comba Telecom and Amphenol.
Company
Positioning
Differentiation
CommScope
Broad in-building coverage
End-to-end DAS and repeater portfolio
Huawei
5G infrastructure scale
Integrated 5G NR and densification leadership
Nokia
Operator-grade radio
Standards influence and global operator relationships
Cisco
Enterprise/Wi-Fi networking
Installed base and cloud management
Ericsson
Macro and small-cell ecosystem
5G technology leadership
SOLiD, Comba Telecom
In-building specialists
Cost-effective cellular repeater systems
Competitive moats rest on certification breadth, operator relationships and digital/AI-enabled remote management, not on unit hardware alone. Our analysis suggests that vendors lacking multi-band 5G NR portfolios will be squeezed into price-sensitive, lower-margin segments.
What do buyers and operators need to know?
Buyers should prioritize supported frequency bands, 5G NR compatibility and digital signal processing over headline gain figures, because improperly specified repeaters can degrade rather than improve network quality. Procurement risk concentrates in regulatory compliance — unauthorized deployment causes interference and legal exposure in most jurisdictions.
Switching costs are moderate: indoor multi-operator systems are installed infrastructure with multi-year lifecycles, so vendor selection is sticky once deployed. Operators should build certification and spectrum-coordination requirements into RFQs and demand AI-enabled remote monitoring to reduce field-maintenance costs. Buyers in public-safety and healthcare environments should treat coverage as mission-critical and verify regulatory mandates before purchase.
Strategic Recommendations & Analyst Perspective
The balance of evidence favors accelerated investment in digital, multi-band 5G NR repeaters, with the 5G NR segment compounding at 22.4% — more than double the overall market. The strongest counter-argument is that analog repeaters still hold roughly half of some narrower market definitions, and price-sensitive emerging markets will sustain demand for lower-cost units longer than headline growth suggests.
Our judgment: the market will bifurcate. Premium vendors win on 5G, public-safety and enterprise in-building contracts where compliance and signal integrity are non-negotiable; volume vendors win on rural and residential coverage in Asia-Pacific and Latin America. Investors should watch FCC spectrum auctions and 5G population-coverage saturation in mature markets such as Germany, where filled coverage gaps reduce incremental repeater demand.
Actionable strategy:
Vendors should prioritize 5G NR and multi-band digital portfolios to capture the fastest-growing, highest-margin segments.
Operators should embed certification and interference-mitigation requirements into procurement to avoid regulatory and quality risk.
Investors should favor suppliers with North American compliance depth and Asia-Pacific scale exposure.
The evidence that would change our conclusion: a sustained slowdown in 5G capex or a regulatory relaxation that commoditizes certification would shift value toward low-cost volume players.
Our rigorous research methodology combines multi-layered approaches with comprehensive quality assurance, ensuring precision, accuracy, and reliability in every market analysis.
Primary Research & Industry Fieldwork
Our analysis rests on a 70/30 primary-to-secondary research split. We conducted in-depth interviews with stakeholders across the repeater value chain, including component suppliers, repeater OEMs, systems integrators and global distributors. Interviewees included VP-level sourcing leads, heads of RF R&D, technical directors and commercial operations managers, ensuring both technical and commercial decision gates were captured.
Key Stakeholders Interviewed
Key Stakeholders Interviewed
Stakeholder Role
Interview Share (%)
VP Sourcing & Procurement Leads
40%
RF R&D & Technical Directors
35%
Commercial Operations Managers
25%
Industry Ecosystem Breakdown
Industry Ecosystem Breakdown
Company Type
Representation (%)
Component & RF Suppliers
40%
Repeater OEMs & Manufacturers
35%
Systems Integrators & Distributors
25%
Secondary Benchmarking & Public Trade Validation
We validated inputs against official multilateral and standards sources: UN Comtrade and WTO trade statistics, US ITC and Eurostat data, corporate 10-K and SEC filings, patent databases, and technical documentation from the IEEE and 3GPP. These sources anchored baseline values and flagged definitional inconsistencies across published estimates.
Demand Modeling & Market Sizing Triangulation
We ran simultaneous top-down (macroeconomic and end-use segment allocation) and bottom-up (manufacturer capacity, product pricing and end-use consumption) models, reconciling outputs to a consensus base-year value and growth path.
Data Triangulation & Validation Matrix
Dimension
Analytical Scope
Methodology Applied
Validation Level
Base-Year Market Size
Value in USD for base year
Bottom-up production & revenue triangulation
High
Forecast Horizon
Multi-year compound projection
Historical CAGR, regression & demand elasticity
High
Regional Distribution
Regional share breakdown
Cross-border trade flow & regional consumption
High
Competitive Landscape
Leading market players
Annual reports, capacity mapping & filings
High
Sources Referenced
International Telecommunication Union (ITU) connectivity statistics
GSMA mobile connection forecasts
Federal Communications Commission (FCC) equipment rules
Europe Network Repeaters Market Report Revenue Billion Forecast, by Product Type 2020 & 2034
Frequently Asked Questions
1. What is the network repeaters market size in 2026?
The global network repeaters market is estimated at USD 8.8 billion in 2026, projected to reach USD 16.8 billion by 2033 at a 9.6% CAGR. Figures vary by definition and source scope.
2. Which region leads the network repeaters market?
North America leads with roughly 30% revenue share, driven by 5G rollouts and in-building public-safety mandates. Asia-Pacific is the fastest-growing region at an 11.3% CAGR.
3. Which segment is growing fastest?
5G NR repeaters are the fastest-growing technology segment at a 22.4% CAGR, fueled by global 5G densification and private enterprise 5G deployments.
4. What are the main restraints on market growth?
Stringent regulatory certification (FCC, CE, TRAI) and signal-interference or compatibility challenges are the primary restraints, raising costs and slowing time-to-market.
11.3. Company Market Share Analysis, 2026
11.3.1. Top 5 Companies Market Share Analysis
11.3.2. Top 3 Companies Market Share Analysis
11.4. List of Potential Customers
Figure 16:
Figure 17: Europe Network Repeaters Market Report Revenue Share (%), by Technology 2026 & 2034
Figure 18: Europe Network Repeaters Market Report Revenue (Billion), by Deployment 2026 & 2034
Figure 19: Europe Network Repeaters Market Report Revenue Share (%), by Deployment 2026 & 2034
Figure 20: Europe Network Repeaters Market Report Revenue (Billion), by Frequency Band 2026 & 2034
Figure 21: Europe Network Repeaters Market Report Revenue Share (%), by Frequency Band 2026 & 2034
Figure 22: Europe Network Repeaters Market Report Revenue (Billion), by End Use 2026 & 2034
Figure 23: Europe Network Repeaters Market Report Revenue Share (%), by End Use 2026 & 2034
Figure 24: Europe Network Repeaters Market Report Revenue (Billion), by Country 2026 & 2034
Figure 25: Europe Network Repeaters Market Report Revenue Share (%), by Country 2026 & 2034
Figure 26: Asia Pacific Network Repeaters Market Report Revenue (Billion), by Product Type 2026 & 2034
Figure 27: Asia Pacific Network Repeaters Market Report Revenue Share (%), by Product Type 2026 & 2034
Figure 28: Asia Pacific Network Repeaters Market Report Revenue (Billion), by Technology 2026 & 2034
Figure 29: Asia Pacific Network Repeaters Market Report Revenue Share (%), by Technology 2026 & 2034
Figure 30: Asia Pacific Network Repeaters Market Report Revenue (Billion), by Deployment 2026 & 2034
Figure 31: Asia Pacific Network Repeaters Market Report Revenue Share (%), by Deployment 2026 & 2034
Figure 32: Asia Pacific Network Repeaters Market Report Revenue (Billion), by Frequency Band 2026 & 2034
Figure 33: Asia Pacific Network Repeaters Market Report Revenue Share (%), by Frequency Band 2026 & 2034
Figure 34: Asia Pacific Network Repeaters Market Report Revenue (Billion), by End Use 2026 & 2034
Figure 35: Asia Pacific Network Repeaters Market Report Revenue Share (%), by End Use 2026 & 2034
Figure 36: Asia Pacific Network Repeaters Market Report Revenue (Billion), by Country 2026 & 2034
Figure 37: Asia Pacific Network Repeaters Market Report Revenue Share (%), by Country 2026 & 2034
Figure 38: Latin America Network Repeaters Market Report Revenue (Billion), by Product Type 2026 & 2034
Figure 39: Latin America Network Repeaters Market Report Revenue Share (%), by Product Type 2026 & 2034
Figure 40: Latin America Network Repeaters Market Report Revenue (Billion), by Technology 2026 & 2034
Figure 41: Latin America Network Repeaters Market Report Revenue Share (%), by Technology 2026 & 2034
Figure 42: Latin America Network Repeaters Market Report Revenue (Billion), by Deployment 2026 & 2034
Figure 43: Latin America Network Repeaters Market Report Revenue Share (%), by Deployment 2026 & 2034
Figure 44: Latin America Network Repeaters Market Report Revenue (Billion), by Frequency Band 2026 & 2034
Figure 45: Latin America Network Repeaters Market Report Revenue Share (%), by Frequency Band 2026 & 2034
Figure 46: Latin America Network Repeaters Market Report Revenue (Billion), by End Use 2026 & 2034
Figure 47: Latin America Network Repeaters Market Report Revenue Share (%), by End Use 2026 & 2034
Figure 48: Latin America Network Repeaters Market Report Revenue (Billion), by Country 2026 & 2034
Figure 49: Latin America Network Repeaters Market Report Revenue Share (%), by Country 2026 & 2034
Figure 50: Middle East & Africa Network Repeaters Market Report Revenue (Billion), by Product Type 2026 & 2034
Figure 51: Middle East & Africa Network Repeaters Market Report Revenue Share (%), by Product Type 2026 & 2034
Figure 52: Middle East & Africa Network Repeaters Market Report Revenue (Billion), by Technology 2026 & 2034
Figure 53: Middle East & Africa Network Repeaters Market Report Revenue Share (%), by Technology 2026 & 2034
Figure 54: Middle East & Africa Network Repeaters Market Report Revenue (Billion), by Deployment 2026 & 2034
Figure 55: Middle East & Africa Network Repeaters Market Report Revenue Share (%), by Deployment 2026 & 2034
Figure 56: Middle East & Africa Network Repeaters Market Report Revenue (Billion), by Frequency Band 2026 & 2034
Figure 57: Middle East & Africa Network Repeaters Market Report Revenue Share (%), by Frequency Band 2026 & 2034
Figure 58: Middle East & Africa Network Repeaters Market Report Revenue (Billion), by End Use 2026 & 2034
Figure 59: Middle East & Africa Network Repeaters Market Report Revenue Share (%), by End Use 2026 & 2034
Figure 60: Middle East & Africa Network Repeaters Market Report Revenue (Billion), by Country 2026 & 2034
Figure 61: Middle East & Africa Network Repeaters Market Report Revenue Share (%), by Country 2026 & 2034
Table 16:
Table 17: Europe Network Repeaters Market Report Revenue Billion Forecast, by Technology 2020 & 2034
Table 18: Europe Network Repeaters Market Report Revenue Billion Forecast, by Deployment 2020 & 2034
Table 19: Europe Network Repeaters Market Report Revenue Billion Forecast, by Frequency Band 2020 & 2034
Table 20: Europe Network Repeaters Market Report Revenue Billion Forecast, by End Use 2020 & 2034
Table 21: Europe Network Repeaters Market Report Revenue Billion Forecast, by Country 2020 & 2034