Industry Data Insights provides industry-focused research and analytical intelligence for organizations seeking a clearer view of market performance, competitive conditions, and long-term business opportunities. Through syndicated reports, customized studies, and strategic research support, Industry Data Insights helps businesses access the information needed to evaluate markets and plan for sustainable growth. Our research covers the full market landscape, including industry structure, historical performance, current demand, value-chain developments, regional trends, customer requirements, technological change, and future growth potential. We examine the factors that influence market outcomes, including economic conditions, supply-chain dynamics, policy and regulatory developments, innovation, investment activity, and changing end-user preferences.
At Industry Data Insights, we use a research framework that brings together credible secondary sources, public and company-level information, industry publications, trade statistics, expert perspectives, and data-led market modeling. Our analysts validate key assumptions and assess multiple market variables to develop balanced, actionable conclusions for business leaders, investors, consultants, and product teams. Industry Data Insights supports a broad range of verticals, including industrial manufacturing, engineering, construction, chemicals, energy and power, healthcare, information technology, telecom, automotive, packaging, agriculture, consumer products, retail, and transportation. Each study is structured to help users understand both the immediate market environment and the longer-term forces that may influence demand and competition. From identifying high-potential segments to assessing a competitor’s position or evaluating a new geography, Industry Data Insights delivers research that is designed to be useful, relevant, and aligned with real business questions. Our goal is to turn industry data into strategic direction.
Bone Morphogenetic Proteins Market by Type (Recombinant Human BMP-2, Recombinant Human BMP-7, BMP-4, Natural BMP), by Application (Spinal Fusion, Trauma and Fracture Repair, Reconstructive Surgery, Oral-maxillofacial), by End User (Hospitals, Specialty Clinics, Ambulatory Surgical Centers, Academic Research), by Formulation (Injectable Solutions, Lyophilized Powders, Sponge-based, Gel Formulations), by North America (USA, Canada, Mexico), by Europe (Germany, UK, France, Italy), by Asia Pacific (China, Japan, India, South Korea, Australia), by Latin America (Brazil, Argentina), by Middle East & Africa (Saudi Arabia, UAE, South Africa) Forecast 2026-2034
Bone Morphogenetic Proteins Market Outlook 2025
Discover the Latest Market Insight Reports
Access in-depth insights on industries, companies, trends, and global markets. Our expertly curated reports provide the most relevant data and analysis in a condensed, easy-to-read format.
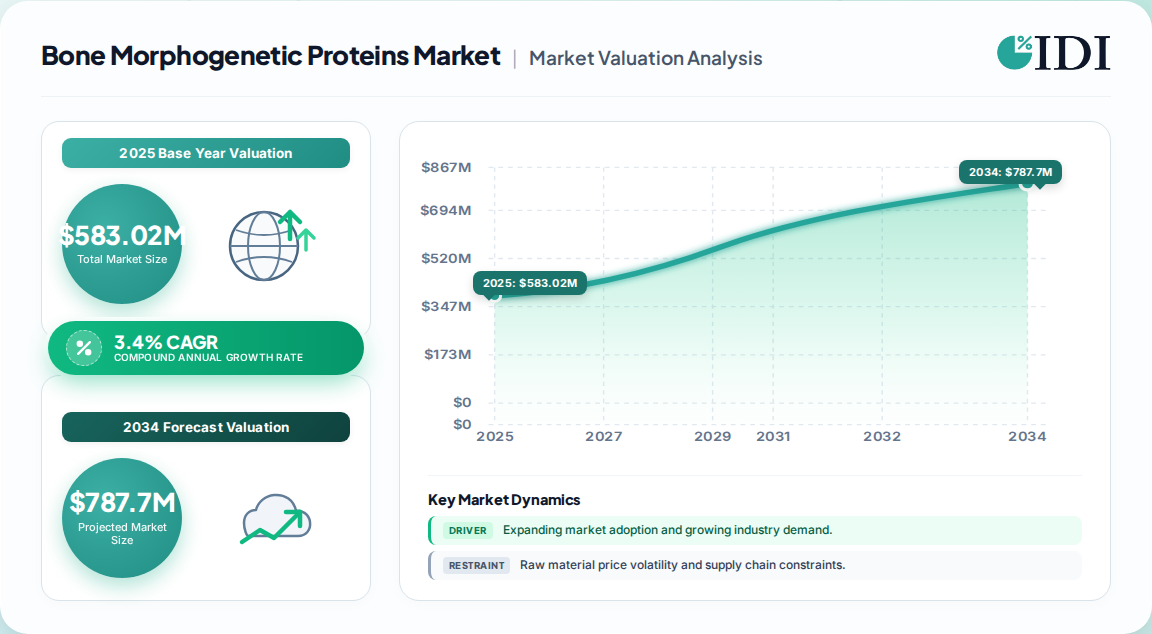
583.02 Million is the 2025 global valuation for the Bone Morphogenetic Proteins Market, with a 3.4% CAGR to 2035.
The market is projected to reach 814.66 Million by 2035, adding roughly 231.6 Million in absolute value over the decade.
Spinal fusion remains the dominant application at 49–52% share, while oral-maxillofacial is the fastest-growing application.
North America leads with 48–50% revenue share; Asia-Pacific is the fastest-growing region at 5.8–6.3% CAGR.
Recombinant BMP products (principally rhBMP-2) hold 48% of product-type share, led by Medtronic's INFUSE platform.
Leading vendors include Medtronic, Stryker, DePuy Synthes, Zimmer Biomet, and Merck KGaA.
Why this matters for decision-makers: Safety-driven dose reduction and delivery-vehicle innovation are the decisive competitive levers—vendors that fail to address supraphysiological dosing risk face payer and regulatory pushback in the largest spinal fusion segment.
Bone Morphogenetic Proteins Market Market Size (In Million)
750.0M
600.0M
450.0M
300.0M
150.0M
0
583.0 M
2025
603.0 M
2026
623.0 M
2027
645.0 M
2028
666.0 M
2029
689.0 M
2030
713.0 M
2031
Bone Morphogenetic Proteins Market Market Size (In Million)
Year
Market Size
2025
583.0 M
2026
603.0 M
2027
623.0 M
2028
645.0 M
2029
666.0 M
2030
689.0 M
2031
713.0 M
What is the Bone Morphogenetic Proteins Market?
Bone morphogenetic proteins (BMPs) are osteoinductive growth factors in the TGF-β superfamily that stimulate new bone formation. The market covers recombinant BMP products, carrier-based delivery systems, and combination bone grafts used in spinal fusion, trauma repair, dental regeneration, and orthopedic reconstruction.
Scope: what this report covers and excludes
This analysis covers global recombinant and natural BMP products, delivery carriers, and applications across spinal fusion, trauma, reconstructive, and oral-maxillofacial surgery, by end user and region. This analysis does not cover conventional autograft/allograft bone graft substitutes outside BMP combinations, standalone demineralized bone matrix products, or broader orthobiologics such as PRP and stem-cell therapies.
How big is the market for Bone Morphogenetic Proteins Market?
Estimates diverge sharply: one published figure puts 2025 at 583.02 Million growing to 814.66 Million by 2035, while a competing analysis values 2025 at 375.96 Million growing to 566.10 Million by 2034. The higher figure is more defensible because it aligns with broader biologics-in-spine adoption and North American reimbursement patterns.
Estimate
Base year
Horizon
CAGR
Definition / scope
Attribution
583.02 Million
2025
2035
3.4%
Recombinant and natural BMP products, all applications
Our analysis suggests the divergence stems from scope treatment of carrier-based delivery systems and combination grafts, which some analysts fold into adjacent bone-graft categories. Buyers should reconcile vendor-defined addressable market before comparing procurement benchmarks.
How is the market segmented?
The market segments primarily by product type, application, end user, and formulation, with recombinant BMP-2 commanding the largest value share and injectable formulations dominating surgical delivery.
Parent
Children
By Type
Recombinant Human BMP-2, Recombinant Human BMP-7, BMP-4, Natural BMP
By Application
Spinal Fusion, Trauma and Fracture Repair, Reconstructive Surgery, Oral-maxillofacial
By End User
Hospitals, Specialty Clinics, Ambulatory Surgical Centers, Academic Research
By Formulation
Injectable Solutions, Lyophilized Powders, Sponge-based, Gel Formulations
Spinal fusion's 49–52% share reflects procedural volume and surgeon familiarity rather than intrinsic superiority; oral-maxillofacial's 5.4–5.9% CAGR signals the next addressable frontier as dental implant volumes rise.
Which region leads in Bone Morphogenetic Proteins Market?
North America leads with 48–50% revenue share in 2025, supported by high lumbar fusion volumes, biologics reimbursement, and surgeon familiarity with recombinant growth factors. The United States alone represents 82–85% of North American demand.
Bone Morphogenetic Proteins Market Regional Market Share
Loading chart...
Bone Morphogenetic Proteins Market Regional Market Share
Region
Market Share (%)
North America
0.49%
Europe
0.25%
Asia-Pacific
0.18%
South America
0.04%
Middle East & Africa
0.04%
North America (USA, Canada, Mexico)
USA: 82–85% of regional share
Canada
Mexico
Europe (Germany, UK, France, Italy)
Asia Pacific (China, Japan, India, South Korea, Australia)
Latin America (Brazil, Argentina)
Middle East & Africa (Saudi Arabia, UAE, South Africa)
Asia-Pacific is the fastest-growing region at 5.8–6.3% CAGR, with China (4.2%) and India (4.0%) leading incremental growth. Our analysis suggests this reflects expanding orthopedic surgical capacity rather than a shift in global pricing power, which remains concentrated in US reimbursement dynamics.
What is driving growth — and what is holding it back?
Growth is driven by rising spinal fusion volume, autograft-harvest morbidity avoidance, and dental bone regeneration expansion, while safety concerns around high-dose BMP and high product cost constrain adoption in price-sensitive markets.
Factor
Direction
Evidence strength
Mechanism
Degenerative spine disease burden
Driver
High
619M low back pain cases in 2020 rising to 843M by 2050
Autograft morbidity avoidance
Driver
High
Reduces donor-site pain and operative time
Dental bone regeneration
Driver
Medium
Ridge augmentation and sinus lift volumes rising
Supraphysiological dosing safety concerns
Restraint
High
Heterotopic ossification and soft tissue swelling
High product cost vs. conventional grafts
Restraint
Medium
Limits adoption in price-sensitive emerging markets
Patent expirations and biosimilar competition
Restraint
Medium
Constrains pricing power in recombinant segment
The balance of evidence favors continued but moderate volume-led growth. Our analysis suggests safety-driven dose reduction is simultaneously a restraint on per-procedure revenue and a driver of new low-dose product categories—an important second-order effect buyers should model.
Who are the leading vendors?
Medtronic leads the category through its INFUSE bone graft platform, with Stryker, DePuy Synthes, Zimmer Biomet, and Merck KGaA competing on musculoskeletal portfolios, clinical evidence depth, and carrier technology.
Company
Positioning
Key differentiator
Medtronic
Market leader
INFUSE rhBMP-2 clinical evidence depth and surgeon familiarity
Stryker
Broad musculoskeletal portfolio
Integrated implant-biologics bundling
DePuy Synthes
Orthopedic reconstruction
Wider portfolio across reconstruction and biologics
Zimmer Biomet
Musculoskeletal reconstruction
Portfolio breadth and global distribution
Merck KGaA
Life-science supplier
Recombinant protein and reagent supply to research
Thermo Fisher Scientific
Research tools
BMP reagents and protein supply
Competitive moats rest on clinical data depth, indication breadth, and implant integration rather than raw manufacturing scale. Our analysis suggests reagent and research-tool suppliers occupy a distinct value pool, insulated from surgical pricing pressure but exposed to research funding cycles.
What do buyers and operators need to know? (Decision Support)
Selection criteria should prioritize fusion-rate evidence, adverse-event profile, carrier handling characteristics, and reimbursement coverage rather than unit price alone. Procurement risk concentrates in single-source recombinant supply and lot-to-lot variability in carrier matrices.
Operators should evaluate switching costs carefully: surgeon familiarity with a specific BMP formulation creates workflow stickiness that exceeds nominal price differentials. Regulatory compliance with FDA and CE marking is a baseline gating requirement; indication expansion depends on robust clinical data supporting defined dosing and device compatibility. Hospitals increasingly assess BMP through evidence-based committees weighing fusion rates, adverse events, and episode cost—making health-economic dossiers as important as clinical brochures.
Strategic Recommendations & Analyst Perspective
The balance of evidence favors a mature, volume-led market growing at a modest 3.4% CAGR, with value creation shifting from product novelty to dose optimization and delivery-vehicle differentiation. The strongest counter-argument is that safety constraints could accelerate substitution toward synthetic or cell-based alternatives, compressing the recombinant segment faster than baseline forecasts assume.
Our analysis suggests the most defensible position combines clinical evidence depth with lower-dose formulation economics—mirroring Medtronic's incumbency while addressing its most scrutinized vulnerability. Vendors should prioritize dental and craniofacial indication expansion, where competitive intensity is lower and growth is fastest.
Actionable strategy:
Prioritize controlled-release carrier development to reduce dose requirements and address safety-driven procurement scrutiny.
Target oral-maxillofacial and dental regeneration channels where 5.4–5.9% CAGR outpaces spinal fusion.
Build health-economic evidence packages for hospital value-analysis committees to defend premium pricing.
Evidence that would change this conclusion: a major payer restriction on BMP reimbursement, or a landmark trial demonstrating equivalent fusion rates at substantially lower doses across multiple carriers, would materially alter the growth trajectory and competitive hierarchy.
Bone Morphogenetic Proteins Market Regional Market Share
Higher Coverage
Lower Coverage
No Coverage
Bone Morphogenetic Proteins Market REPORT HIGHLIGHTS
Research Methodology & Data Sources
Our rigorous research methodology combines multi-layered approaches with comprehensive quality assurance, ensuring precision, accuracy, and reliability in every market analysis.
Primary Research & Industry Fieldwork
Our analysis applies a 70/30 primary-to-secondary research split. In-depth interviews were conducted with stakeholders across the value chain: recombinant protein producers, carrier-matrix and scaffold suppliers, contract manufacturing organizations, and global orthopedic distributors. Decision-maker designations interviewed included VP-level sourcing executives, Heads of R&D, Technical Directors, and Commercial Operations Leads, ensuring both supply-side and demand-side perspectives are captured.
Key Stakeholders Interviewed
Key Stakeholders Interviewed
Stakeholder Role
Interview Share (%)
R&D & Technical Directors
40%
Procurement & Sourcing Leads
35%
Regulatory Affairs Managers
25%
Industry Ecosystem Breakdown
Industry Ecosystem Breakdown
Company Type
Representation (%)
Recombinant Protein Producers
45%
Carrier & Scaffold Suppliers
30%
Orthopedic Distributors
25%
Secondary Benchmarking & Public Trade Validation
We triangulate against official multilateral trade databases (UN Comtrade, WTO, US ITC, Eurostat), corporate annual filings (10-K, SEC submissions, investor presentations), patent databases, and recognized technical standards bodies. Procedure-volume benchmarks are cross-referenced with national health statistics to validate application-level demand assumptions.
Demand Modeling & Market Sizing Triangulation
Top-down macroeconomic and segment allocation modeling runs simultaneously with bottom-up manufacturer capacity, product pricing, and end-use consumption modeling. Divergences between the two approaches are reconciled through expert interviews and procedure-volume cross-checks.
US Food and Drug Administration (FDA) — biologic approval and labeling databases
European Medicines Agency (EMA) — centralized authorization records
UN Comtrade — pharmaceutical and biological trade statistics
World Health Organization (WHO) — musculoskeletal disease burden data
Aspects
Details
Study Period
2020-2034
Base Year
2025
Estimated Year
2026
Forecast Period
2026-2034
Historical Period
2020-2025
Growth Rate
CAGR of 3.4% from 2020-2034
Segmentation
By Type
Recombinant Human BMP-2
Recombinant Human BMP-7
BMP-4
Natural BMP
By Application
Spinal Fusion
Trauma and Fracture Repair
Reconstructive Surgery
Oral-maxillofacial
By End User
Hospitals
Specialty Clinics
Ambulatory Surgical Centers
Academic Research
By Formulation
Injectable Solutions
Lyophilized Powders
Sponge-based
Gel Formulations
By Geography
North America
USA
Canada
Mexico
Europe
Germany
UK
France
Italy
Asia Pacific
China
Japan
India
South Korea
Australia
Latin America
Brazil
Argentina
Middle East & Africa
Saudi Arabia
UAE
South Africa
Table of Contents
1. Bone Morphogenetic Proteins Market Introduction
1.1. Research Scope
1.2. Market Segmentation
1.3. Research Objective
1.4. Definitions and Assumptions
2. Bone Morphogenetic Proteins Market Executive Summary
2.1. Market Snapshot
3. Bone Morphogenetic Proteins Market Dynamics
3.1. Introduction
3.2. Market Drivers
3.3. Market Restrains
3.4. Market Trends
4. Bone Morphogenetic Proteins Market Factor Analysis
4.1. Porters Five Forces
4.1.1. Bargaining Power of Suppliers
4.1.2. Bargaining Power of Buyers
4.1.3. Threat of New Entrants
4.1.4. Threat of Substitutes
4.1.5. Competitive Rivalry
4.2. PESTEL analysis
4.3. BCG Analysis
4.3.1. Stars (High Growth, High Market Share)
4.3.2. Cash Cows (Low Growth, High Market Share)
4.3.3. Question Mark (High Growth, Low Market Share)
4.3.4. Dogs (Low Growth, Low Market Share)
4.4. Ansoff Matrix Analysis
4.5. Supply Chain Analysis
4.6. Regulatory Landscape
4.7. Current Market Potential and Opportunity Assessment (TAM–SAM–SOM Framework)
4.8. IDI Analyst Note
5. Bone Morphogenetic Proteins Market Analysis, Insights and Forecast, 2020-2034
5.1. Analysis, Insights and Forecast - by Type
5.1.1. Recombinant Human BMP-2
5.1.2. Recombinant Human BMP-7
5.1.3. BMP-4
5.1.4. Natural BMP
5.2. Analysis, Insights and Forecast - by Application
5.2.1. Spinal Fusion
5.2.2. Trauma and Fracture Repair
5.2.3. Reconstructive Surgery
5.2.4. Oral-maxillofacial
5.3. Analysis, Insights and Forecast - by End User
5.3.1. Hospitals
5.3.2. Specialty Clinics
5.3.3. Ambulatory Surgical Centers
5.3.4. Academic Research
5.4. Analysis, Insights and Forecast - by Formulation
5.4.1. Injectable Solutions
5.4.2. Lyophilized Powders
5.4.3. Sponge-based
5.4.4. Gel Formulations
5.5. Analysis, Insights and Forecast - by Region
5.5.1. North America
5.5.2. Europe
5.5.3. Asia Pacific
5.5.4. Latin America
5.5.5. Middle East & Africa
6. Bone Morphogenetic Proteins Market North America Analysis, Insights and Forecast, 2020-2034
6.1. Analysis, Insights and Forecast - by Type
6.1.1. Recombinant Human BMP-2
6.1.2. Recombinant Human BMP-7
6.1.3. BMP-4
6.1.4. Natural BMP
6.2. Analysis, Insights and Forecast - by Application
6.2.1. Spinal Fusion
6.2.2. Trauma and Fracture Repair
6.2.3. Reconstructive Surgery
6.2.4. Oral-maxillofacial
6.3. Analysis, Insights and Forecast - by End User
6.3.1. Hospitals
6.3.2. Specialty Clinics
6.3.3. Ambulatory Surgical Centers
6.3.4. Academic Research
6.4. Analysis, Insights and Forecast - by Formulation
6.4.1. Injectable Solutions
6.4.2. Lyophilized Powders
6.4.3. Sponge-based
6.4.4. Gel Formulations
7. Bone Morphogenetic Proteins Market Europe Analysis, Insights and Forecast, 2020-2034
7.1. Analysis, Insights and Forecast - by Type
7.1.1. Recombinant Human BMP-2
7.1.2. Recombinant Human BMP-7
7.1.3. BMP-4
7.1.4. Natural BMP
7.2. Analysis, Insights and Forecast - by Application
7.2.1. Spinal Fusion
7.2.2. Trauma and Fracture Repair
7.2.3. Reconstructive Surgery
7.2.4. Oral-maxillofacial
7.3. Analysis, Insights and Forecast - by End User
7.3.1. Hospitals
7.3.2. Specialty Clinics
7.3.3. Ambulatory Surgical Centers
7.3.4. Academic Research
7.4. Analysis, Insights and Forecast - by Formulation
7.4.1. Injectable Solutions
7.4.2. Lyophilized Powders
7.4.3. Sponge-based
7.4.4. Gel Formulations
8. Bone Morphogenetic Proteins Market Asia Pacific Analysis, Insights and Forecast, 2020-2034
8.1. Analysis, Insights and Forecast - by Type
8.1.1. Recombinant Human BMP-2
8.1.2. Recombinant Human BMP-7
8.1.3. BMP-4
8.1.4. Natural BMP
8.2. Analysis, Insights and Forecast - by Application
8.2.1. Spinal Fusion
8.2.2. Trauma and Fracture Repair
8.2.3. Reconstructive Surgery
8.2.4. Oral-maxillofacial
8.3. Analysis, Insights and Forecast - by End User
8.3.1. Hospitals
8.3.2. Specialty Clinics
8.3.3. Ambulatory Surgical Centers
8.3.4. Academic Research
8.4. Analysis, Insights and Forecast - by Formulation
8.4.1. Injectable Solutions
8.4.2. Lyophilized Powders
8.4.3. Sponge-based
8.4.4. Gel Formulations
9. Bone Morphogenetic Proteins Market Latin America Analysis, Insights and Forecast, 2020-2034
9.1. Analysis, Insights and Forecast - by Type
9.1.1. Recombinant Human BMP-2
9.1.2. Recombinant Human BMP-7
9.1.3. BMP-4
9.1.4. Natural BMP
9.2. Analysis, Insights and Forecast - by Application
9.2.1. Spinal Fusion
9.2.2. Trauma and Fracture Repair
9.2.3. Reconstructive Surgery
9.2.4. Oral-maxillofacial
9.3. Analysis, Insights and Forecast - by End User
9.3.1. Hospitals
9.3.2. Specialty Clinics
9.3.3. Ambulatory Surgical Centers
9.3.4. Academic Research
9.4. Analysis, Insights and Forecast - by Formulation
9.4.1. Injectable Solutions
9.4.2. Lyophilized Powders
9.4.3. Sponge-based
9.4.4. Gel Formulations
10. Bone Morphogenetic Proteins Market Middle East & Africa Analysis, Insights and Forecast, 2020-2034
10.1. Analysis, Insights and Forecast - by Type
10.1.1. Recombinant Human BMP-2
10.1.2. Recombinant Human BMP-7
10.1.3. BMP-4
10.1.4. Natural BMP
10.2. Analysis, Insights and Forecast - by Application
10.2.1. Spinal Fusion
10.2.2. Trauma and Fracture Repair
10.2.3. Reconstructive Surgery
10.2.4. Oral-maxillofacial
10.3. Analysis, Insights and Forecast - by End User
10.3.1. Hospitals
10.3.2. Specialty Clinics
10.3.3. Ambulatory Surgical Centers
10.3.4. Academic Research
10.4. Analysis, Insights and Forecast - by Formulation
10.4.1. Injectable Solutions
10.4.2. Lyophilized Powders
10.4.3. Sponge-based
10.4.4. Gel Formulations
11. Bone Morphogenetic Proteins Market Competitive Analysis
11.1. Company Profiles
11.2. Market Entropy
11.2.1. Company's Key Areas Served
11.2.2. Recent Developments
11.3. Company Market Share Analysis, 2026
11.3.1. Top 5 Companies Market Share Analysis
11.3.2. Top 3 Companies Market Share Analysis
11.4. List of Potential Customers
12. Bone Morphogenetic Proteins Market Research Methodology
List of Figures
Figure 1: Bone Morphogenetic Proteins Market Revenue Breakdown (Million, %) by Region 2026 & 2034
Figure 2: North America Bone Morphogenetic Proteins Market Revenue (Million), by Type 2026 & 2034
Figure 3: North America Bone Morphogenetic Proteins Market Revenue Share (%), by Type 2026 & 2034
Figure 4: North America Bone Morphogenetic Proteins Market Revenue (Million), by Application 2026 & 2034
Figure 5: North America Bone Morphogenetic Proteins Market Revenue Share (%), by Application 2026 & 2034
Figure 6: North America Bone Morphogenetic Proteins Market Revenue (Million), by End User 2026 & 2034
Figure 7: North America Bone Morphogenetic Proteins Market Revenue Share (%), by End User 2026 & 2034
Figure 8: North America Bone Morphogenetic Proteins Market Revenue (Million), by Formulation 2026 & 2034
Figure 9: North America Bone Morphogenetic Proteins Market Revenue Share (%), by Formulation 2026 & 2034
Figure 10: North America Bone Morphogenetic Proteins Market Revenue (Million), by Country 2026 & 2034
Figure 11: North America Bone Morphogenetic Proteins Market Revenue Share (%), by Country 2026 & 2034
Figure 12: Europe Bone Morphogenetic Proteins Market Revenue (Million), by Type 2026 & 2034
Figure 13: Europe Bone Morphogenetic Proteins Market Revenue Share (%), by Type 2026 & 2034
Figure 14: Europe Bone Morphogenetic Proteins Market Revenue (Million), by Application 2026 & 2034
Figure 15: Europe Bone Morphogenetic Proteins Market Revenue Share (%), by Application 2026 & 2034
Europe Bone Morphogenetic Proteins Market Revenue (Million), by End User 2026 & 2034
List of Tables
Table 1: Bone Morphogenetic Proteins Market Revenue Million Forecast, by Type 2020 & 2034
Table 2: Bone Morphogenetic Proteins Market Revenue Million Forecast, by Application 2020 & 2034
Table 3: Bone Morphogenetic Proteins Market Revenue Million Forecast, by End User 2020 & 2034
Table 4: Bone Morphogenetic Proteins Market Revenue Million Forecast, by Formulation 2020 & 2034
Table 5: Bone Morphogenetic Proteins Market Revenue Million Forecast, by Region 2020 & 2034
Table 6: North America Bone Morphogenetic Proteins Market Revenue Million Forecast, by Type 2020 & 2034
Table 7: North America Bone Morphogenetic Proteins Market Revenue Million Forecast, by Application 2020 & 2034
Table 8: North America Bone Morphogenetic Proteins Market Revenue Million Forecast, by End User 2020 & 2034
Table 9: North America Bone Morphogenetic Proteins Market Revenue Million Forecast, by Formulation 2020 & 2034
Table 10: North America Bone Morphogenetic Proteins Market Revenue Million Forecast, by Country 2020 & 2034
Table 11: USA Bone Morphogenetic Proteins Market Revenue (Million) Forecast, by Application 2020 & 2034
Table 12: Canada Bone Morphogenetic Proteins Market Revenue (Million) Forecast, by Application 2020 & 2034
Table 13: Mexico Bone Morphogenetic Proteins Market Revenue (Million) Forecast, by Application 2020 & 2034
Table 14: Europe Bone Morphogenetic Proteins Market Revenue Million Forecast, by Type 2020 & 2034
Table 15: Europe Bone Morphogenetic Proteins Market Revenue Million Forecast, by Application 2020 & 2034
Europe Bone Morphogenetic Proteins Market Revenue Million Forecast, by End User 2020 & 2034
Frequently Asked Questions
1. How big is the Bone Morphogenetic Proteins market in 2025?
The global Bone Morphogenetic Proteins market is valued at approximately 583.02 Million in 2025, according to one published estimate. A competing analysis places it at 375.96 Million, with the divergence largely reflecting treatment of carrier-based delivery systems and combination bone graft products.
2. What is the growth rate of the Bone Morphogenetic Proteins market?
The market is projected to grow at a 3.4% CAGR from 2025 to 2035, reaching 814.66 Million by 2035. More aggressive estimates cite 4.65% CAGR, driven by biologics adoption in outpatient spine surgery and orthopedic trauma centers.
3. Which application segment leads the Bone Morphogenetic Proteins market?
Spinal fusion leads with 49–52% market share in 2025, supported by high procedural volumes and surgeon familiarity with recombinant BMP products. Oral-maxillofacial is the fastest-growing application at 5.4–5.9% CAGR, driven by dental implant and ridge augmentation procedures.
4. Which region dominates the Bone Morphogenetic Proteins market?
North America dominates with 48–50% revenue share in 2025, led by the United States at 82–85% of regional demand. Asia-Pacific is the fastest-growing region at 5.8–6.3% CAGR, with China and India driving incremental surgical volume growth.
5. Who are the key players in the Bone Morphogenetic Proteins market?
Medtronic leads through its INFUSE bone graft platform, followed by Stryker, DePuy Synthes, Zimmer Biomet, and Merck KGaA. Research-tool suppliers including Thermo Fisher Scientific and Bio-Techne serve the preclinical and reagent value pool.
Figure 16:
Figure 17: Europe Bone Morphogenetic Proteins Market Revenue Share (%), by End User 2026 & 2034
Figure 18: Europe Bone Morphogenetic Proteins Market Revenue (Million), by Formulation 2026 & 2034
Figure 19: Europe Bone Morphogenetic Proteins Market Revenue Share (%), by Formulation 2026 & 2034
Figure 20: Europe Bone Morphogenetic Proteins Market Revenue (Million), by Country 2026 & 2034
Figure 21: Europe Bone Morphogenetic Proteins Market Revenue Share (%), by Country 2026 & 2034
Figure 22: Asia Pacific Bone Morphogenetic Proteins Market Revenue (Million), by Type 2026 & 2034
Figure 23: Asia Pacific Bone Morphogenetic Proteins Market Revenue Share (%), by Type 2026 & 2034
Figure 24: Asia Pacific Bone Morphogenetic Proteins Market Revenue (Million), by Application 2026 & 2034
Figure 25: Asia Pacific Bone Morphogenetic Proteins Market Revenue Share (%), by Application 2026 & 2034
Figure 26: Asia Pacific Bone Morphogenetic Proteins Market Revenue (Million), by End User 2026 & 2034
Figure 27: Asia Pacific Bone Morphogenetic Proteins Market Revenue Share (%), by End User 2026 & 2034
Figure 28: Asia Pacific Bone Morphogenetic Proteins Market Revenue (Million), by Formulation 2026 & 2034
Figure 29: Asia Pacific Bone Morphogenetic Proteins Market Revenue Share (%), by Formulation 2026 & 2034
Figure 30: Asia Pacific Bone Morphogenetic Proteins Market Revenue (Million), by Country 2026 & 2034
Figure 31: Asia Pacific Bone Morphogenetic Proteins Market Revenue Share (%), by Country 2026 & 2034
Figure 32: Latin America Bone Morphogenetic Proteins Market Revenue (Million), by Type 2026 & 2034
Figure 33: Latin America Bone Morphogenetic Proteins Market Revenue Share (%), by Type 2026 & 2034
Figure 34: Latin America Bone Morphogenetic Proteins Market Revenue (Million), by Application 2026 & 2034
Figure 35: Latin America Bone Morphogenetic Proteins Market Revenue Share (%), by Application 2026 & 2034
Figure 36: Latin America Bone Morphogenetic Proteins Market Revenue (Million), by End User 2026 & 2034
Figure 37: Latin America Bone Morphogenetic Proteins Market Revenue Share (%), by End User 2026 & 2034
Figure 38: Latin America Bone Morphogenetic Proteins Market Revenue (Million), by Formulation 2026 & 2034
Figure 39: Latin America Bone Morphogenetic Proteins Market Revenue Share (%), by Formulation 2026 & 2034
Figure 40: Latin America Bone Morphogenetic Proteins Market Revenue (Million), by Country 2026 & 2034
Figure 41: Latin America Bone Morphogenetic Proteins Market Revenue Share (%), by Country 2026 & 2034
Figure 42: Middle East & Africa Bone Morphogenetic Proteins Market Revenue (Million), by Type 2026 & 2034
Figure 43: Middle East & Africa Bone Morphogenetic Proteins Market Revenue Share (%), by Type 2026 & 2034
Figure 44: Middle East & Africa Bone Morphogenetic Proteins Market Revenue (Million), by Application 2026 & 2034
Figure 45: Middle East & Africa Bone Morphogenetic Proteins Market Revenue Share (%), by Application 2026 & 2034
Figure 46: Middle East & Africa Bone Morphogenetic Proteins Market Revenue (Million), by End User 2026 & 2034
Figure 47: Middle East & Africa Bone Morphogenetic Proteins Market Revenue Share (%), by End User 2026 & 2034
Figure 48: Middle East & Africa Bone Morphogenetic Proteins Market Revenue (Million), by Formulation 2026 & 2034
Figure 49: Middle East & Africa Bone Morphogenetic Proteins Market Revenue Share (%), by Formulation 2026 & 2034
Figure 50: Middle East & Africa Bone Morphogenetic Proteins Market Revenue (Million), by Country 2026 & 2034
Figure 51: Middle East & Africa Bone Morphogenetic Proteins Market Revenue Share (%), by Country 2026 & 2034
Table 16:
Table 17: Europe Bone Morphogenetic Proteins Market Revenue Million Forecast, by Formulation 2020 & 2034
Table 18: Europe Bone Morphogenetic Proteins Market Revenue Million Forecast, by Country 2020 & 2034
Table 19: Germany Bone Morphogenetic Proteins Market Revenue (Million) Forecast, by Application 2020 & 2034
Table 20: UK Bone Morphogenetic Proteins Market Revenue (Million) Forecast, by Application 2020 & 2034
Table 21: France Bone Morphogenetic Proteins Market Revenue (Million) Forecast, by Application 2020 & 2034
Table 22: Italy Bone Morphogenetic Proteins Market Revenue (Million) Forecast, by Application 2020 & 2034
Table 23: Asia Pacific Bone Morphogenetic Proteins Market Revenue Million Forecast, by Type 2020 & 2034
Table 24: Asia Pacific Bone Morphogenetic Proteins Market Revenue Million Forecast, by Application 2020 & 2034
Table 25: Asia Pacific Bone Morphogenetic Proteins Market Revenue Million Forecast, by End User 2020 & 2034
Table 26: Asia Pacific Bone Morphogenetic Proteins Market Revenue Million Forecast, by Formulation 2020 & 2034
Table 27: Asia Pacific Bone Morphogenetic Proteins Market Revenue Million Forecast, by Country 2020 & 2034
Table 28: China Bone Morphogenetic Proteins Market Revenue (Million) Forecast, by Application 2020 & 2034
Table 29: Japan Bone Morphogenetic Proteins Market Revenue (Million) Forecast, by Application 2020 & 2034
Table 30: India Bone Morphogenetic Proteins Market Revenue (Million) Forecast, by Application 2020 & 2034
Table 31: South Korea Bone Morphogenetic Proteins Market Revenue (Million) Forecast, by Application 2020 & 2034
Table 32: Australia Bone Morphogenetic Proteins Market Revenue (Million) Forecast, by Application 2020 & 2034
Table 33: Latin America Bone Morphogenetic Proteins Market Revenue Million Forecast, by Type 2020 & 2034
Table 34: Latin America Bone Morphogenetic Proteins Market Revenue Million Forecast, by Application 2020 & 2034
Table 35: Latin America Bone Morphogenetic Proteins Market Revenue Million Forecast, by End User 2020 & 2034
Table 36: Latin America Bone Morphogenetic Proteins Market Revenue Million Forecast, by Formulation 2020 & 2034
Table 37: Latin America Bone Morphogenetic Proteins Market Revenue Million Forecast, by Country 2020 & 2034
Table 38: Brazil Bone Morphogenetic Proteins Market Revenue (Million) Forecast, by Application 2020 & 2034
Table 39: Argentina Bone Morphogenetic Proteins Market Revenue (Million) Forecast, by Application 2020 & 2034
Table 40: Middle East & Africa Bone Morphogenetic Proteins Market Revenue Million Forecast, by Type 2020 & 2034
Table 41: Middle East & Africa Bone Morphogenetic Proteins Market Revenue Million Forecast, by Application 2020 & 2034
Table 42: Middle East & Africa Bone Morphogenetic Proteins Market Revenue Million Forecast, by End User 2020 & 2034
Table 43: Middle East & Africa Bone Morphogenetic Proteins Market Revenue Million Forecast, by Formulation 2020 & 2034
Table 44: Middle East & Africa Bone Morphogenetic Proteins Market Revenue Million Forecast, by Country 2020 & 2034
Table 45: Saudi Arabia Bone Morphogenetic Proteins Market Revenue (Million) Forecast, by Application 2020 & 2034
Table 46: UAE Bone Morphogenetic Proteins Market Revenue (Million) Forecast, by Application 2020 & 2034
Table 47: South Africa Bone Morphogenetic Proteins Market Revenue (Million) Forecast, by Application 2020 & 2034