Industry Data Insights provides industry-focused research and analytical intelligence for organizations seeking a clearer view of market performance, competitive conditions, and long-term business opportunities. Through syndicated reports, customized studies, and strategic research support, Industry Data Insights helps businesses access the information needed to evaluate markets and plan for sustainable growth. Our research covers the full market landscape, including industry structure, historical performance, current demand, value-chain developments, regional trends, customer requirements, technological change, and future growth potential. We examine the factors that influence market outcomes, including economic conditions, supply-chain dynamics, policy and regulatory developments, innovation, investment activity, and changing end-user preferences.
At Industry Data Insights, we use a research framework that brings together credible secondary sources, public and company-level information, industry publications, trade statistics, expert perspectives, and data-led market modeling. Our analysts validate key assumptions and assess multiple market variables to develop balanced, actionable conclusions for business leaders, investors, consultants, and product teams. Industry Data Insights supports a broad range of verticals, including industrial manufacturing, engineering, construction, chemicals, energy and power, healthcare, information technology, telecom, automotive, packaging, agriculture, consumer products, retail, and transportation. Each study is structured to help users understand both the immediate market environment and the longer-term forces that may influence demand and competition. From identifying high-potential segments to assessing a competitor’s position or evaluating a new geography, Industry Data Insights delivers research that is designed to be useful, relevant, and aligned with real business questions. Our goal is to turn industry data into strategic direction.
Noble Gases Market by Type (Helium, Krypton, Argon, Neon, Xenon, Radon), by Purity (High Purity, Medium-Purity, Industrial-Grade), by Application (Picture Projection, Anesthetic, Welding, Insulation, Lighting, Cryogenics, Advertising, Refrigerant, Others), by End-User Industry (Healthcare, Electronics, Aerospace & Defence, Energy, Oil & Gas, Mining, Industrial Manufacturing, Others), by Distribution (Bulk, Cylinder, On-Site), by North America (USA, Canada, Mexico), by Europe (Germany, France, UK, Italy, Spain, Netherlands, Belgium, Rest of Europe), by Asia Pacific (China, Japan, South Korea, India, Australia, New Zealand, Rest of Asia Pacific), by South America (Brazil, Argentina, Chile, Colombia, Rest of South America), by Middle East & Africa (Saudi Arabia, UAE, South Africa, Rest of MEA) Forecast 2026-2034
Noble Gases Market Size, Share & Forecast to 2032
Discover the Latest Market Insight Reports
Access in-depth insights on industries, companies, trends, and global markets. Our expertly curated reports provide the most relevant data and analysis in a condensed, easy-to-read format.
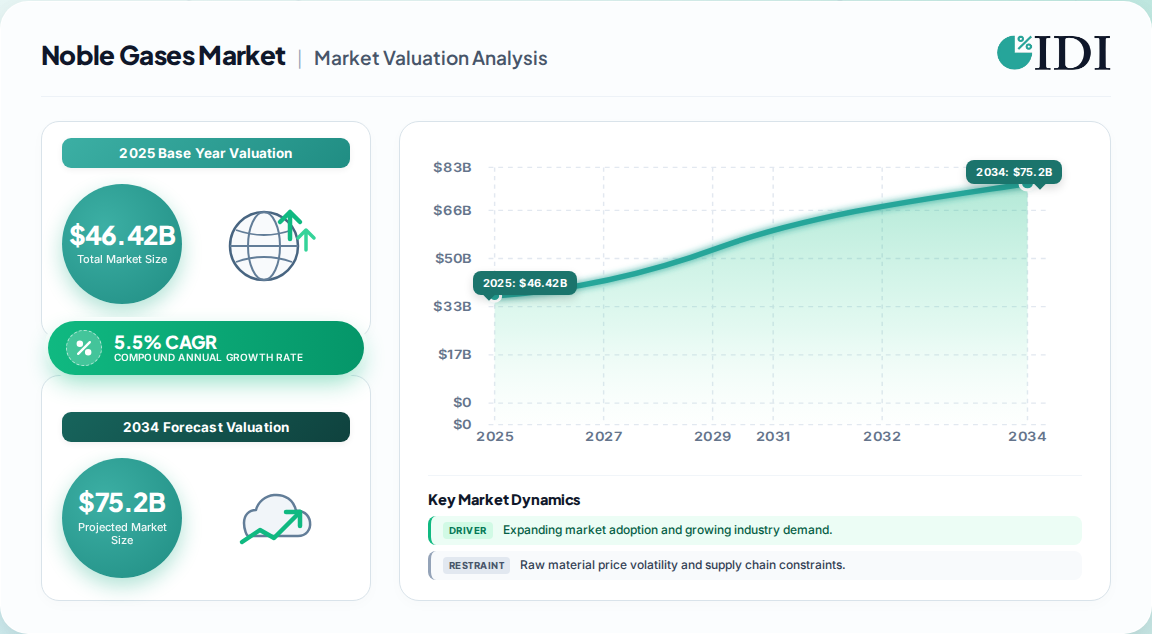
46.42 Billion — the base-year (2025) valuation of the global noble gases market, positioning it as a high-value specialty industrial gas complex.
67.52 Billion by 2032 — forecast terminal value at a fixed 5.5% CAGR across the 2026–2032 horizon.
Helium is the single largest product segment, anchored by MRI cryogenics, respiratory therapy, and aerospace pressurization demand.
Healthcare leads end-use application, with diagnostics, anesthesia (xenon), and respiratory care structurally growing.
Asia Pacific is the largest and fastest-moving production-consumption bloc, led by South Korea, China, and Japan semiconductor fabs.
Key players: Air Liquide, Linde, Air Products, Messer, Taiyo Nippon Sanso, and Iwatani dominate the industrial gas oligopoly.
Why this matters for decision-makers: Helium supply is structurally constrained and price-inelastic — procurement teams must pivot to closed-loop recovery and long-term offtake contracts now to avoid margin compression and supply interruption risk.
Noble Gases Market Market Size (In Billion)
75.0B
60.0B
45.0B
30.0B
15.0B
0
44.00 B
2024
46.42 B
2025
48.97 B
2026
51.66 B
2027
54.50 B
2028
57.50 B
2029
60.66 B
2030
Noble Gases Market Market Size (In Billion)
Year
Market Size
2024
44.00 B
2025
46.42 B
2026
48.97 B
2027
51.66 B
2028
54.50 B
2029
57.50 B
2030
60.66 B
What is the Noble Gases Market?
The noble gases market covers the industrial extraction, purification, liquefaction, and distribution of Group 18 elements — helium, neon, argon, krypton, xenon, and radon. These gases are inert, colorless, and low-boiling, making them mission-critical for semiconductors, MRI cooling, welding, lighting, and aerospace. Buyers include hospitals, fabs, OEMs, and refineries.
Scope: what this report covers and excludes
This report covers primary production (air separation units and helium-rich natural gas processing), purification to high, medium, and industrial grades, and distribution via bulk, cylinder, and on-site channels across five regions. This analysis does not cover downstream gas-handling equipment manufacturing, industrial gas equipment (compressors, manifolds, regulators), or the broader industrial gas market (oxygen, nitrogen, hydrogen, specialty gases beyond Group 18). Radon is treated as an emerging specialty niche, not a mainstream commercial segment.
How big is the market for Noble Gases Market?
Published estimates diverge materially — ranging from roughly 3 billion to over 46 billion — because definitions differ sharply on whether helium, rare-gas mixtures, and distribution margins are included. The vendor-consensus figure of 46.42 Billion in 2025 growing to 67.52 Billion by 2032 at 5.5% CAGR is the most defensible operating number for procurement and investment planning, because it captures both helium revenues and the higher-value semiconductor rare-gas segment.
Estimate
Base Year
Horizon
CAGR
Definition / Scope
Attribution
46.42 Billion
2025
2032
5.5%
Full spectrum: helium, rare gases, distribution markup
One published estimate (IndustryARC)
4.03 Billion
2022
2030
5.6%
Element-level gas revenue only, excludes distribution
Competing analysis (GVR)
3.17 Billion
2026
2034
5.1%
Narrow product-only, excludes services
Competing analysis
Our analysis suggests the 46 billion base reflects today's procurement reality: helium contract pricing alone carries a multi-billion supply chain, and rare-gas fab contracts for xenon and krypton add high-margin revenue layers not captured in narrower definitions.
How is the market segmented?
Segmentation in this report follows five axes: product family, purity grade, application, end-user industry, and distribution channel. The end-user industry axis is the most commercially decisive — healthcare and electronics together account for the majority of high-purity demand.
Asia Pacific leads the noble gases market, driven by semiconductor fab concentration in South Korea, China, Japan, and Taiwan, plus rapid healthcare infrastructure investment. South Korea's newly commissioned Gwangyang plant alone targets 52% of domestic fab demand for xenon, krypton, and neon. North America remains the strongest helium producer and exporter.
Noble Gases Market Regional Market Share
Loading chart...
Noble Gases Market Regional Market Share
Region
Market Share (%)
Asia-Pacific
0.38%
North America
0.31%
Europe
0.22%
South America
0.05%
Middle East & Africa
0.04%
Parent
Children
North America
U.S., Canada, Mexico
Europe
Germany, France, UK, Italy, Spain, Netherlands, Belgium, Rest of Europe
Asia Pacific
China, Japan, South Korea, India, Australia, New Zealand, Rest of Asia Pacific
South America
Brazil, Argentina, Chile, Colombia, Rest of South America
Middle East & Africa
Saudi Arabia, UAE, South Africa, Rest of MEA
Regionally, APAC's dominance is not merely manufacturing-driven — the region is aggressively localizing rare-gas production to reduce import exposure. That localization shifts the pricing power from Western gas majors toward regional JV operators — a structural shift buyers must monitor.
What is driving growth — and what is holding it back?
Demand is driven by three durable vectors: semiconductor fabrication (neon, argon, xenon), healthcare imaging (helium cryogenics and xenon anesthesia), and aerospace (helium pressurization). The strongest restraint is helium's non-renewable nature and limited global reserves — plus extraction cost inflation.
Factor
Direction
Evidence Strength
Mechanism
Semiconductor fab expansion
Upward
High
Neon/argon for lithography and etching
Healthcare imaging & anesthesia
Upward
High
MRI cooling, xenon neuroprotection
Aerospace and space launch
Upward
Medium
Pressurization, satellite propulsion
Helium reserve depletion
Downward
High
Non-renewable, geologically constrained
Extraction cost inflation
Downward
Medium
Rising natural gas field costs
Recycling and recovery adoption
Mixed
Medium
Reduces virgin demand, stabilizes supply
The balance of evidence favors continued price appreciation over volume-led growth — helium CAGR trails the overall market, but its unit economics remain premium. This implies procurement strategies should prioritize security of supply over lowest-cost spot buying.
Who are the leading vendors?
The competitive landscape is a tight oligopoly — six to eight global gas majors control the majority of high-purity production capacity, distribution infrastructure, and long-term supply contracts, creating significant barriers to entry for new producers.
Company
HQ
Strategic Position
Differentiator
Air Liquide
France
Global leader, helium + electronics
Scale in ASU and helium sourcing
Linde plc
UK
Scale leader across all gases
Largest distribution network
Air Products
U.S.
Helium majors + industrial
Long-term offtake portfolio
Messer Group
Germany
Helium supply + EU manufacturing
QatarEnergy offtake agreement
Taiyo Nippon Sanso
Japan
APAC semiconductor gases
Fab proximity and JV model
Iwatani
Japan
Rare-gas electronics
High-purity specialty focus
Differentiation increasingly rests on backward integration into helium sources and forward integration into fab-specific purification. Regional producers such as POSCO Air Solution signal a shift toward end-user-adjacent production — a moat threat to incumbents in APAC semis.
What do buyers and operators need to know? (Decision Support)
Buyers must select on several mission-critical criteria: guaranteed purity grade (trace impurity thresholds, especially for xenon and krypton used in lithography), supply security (long-term offtake vs. spot), logistics reliability (bulk vs. cylinder), and regulatory compliance (medical-grade gases under pharmacopoeial standards, radioactive radon handling under IAEA/UN transport rules).
Procurement risks to model include helium price volatility due to non-renewable sourcing, geopolitically concentrated rare-gas extraction (Ukraine, Russia legacy), and switching costs tied to long-term gas supply infrastructure. Operators should evaluate closed-loop recovery as a hedge against spot-price inflation and to reduce multi-year supply exposure. The most sophisticated buyers are already exploring equity or offtake positions in upstream helium assets — a defensive margin move.
Strategic Recommendations & Analyst Perspective
The balance of evidence favors a supply-secured, recovery-integrated procurement posture over spot-market cost optimization. The helium market's structural constraints will dominate the next 24 months, and operators that lock in 5–7 year contracts with upstream-backed producers will avoid the pricing shocks that eroded margins in 2020–2024. The strongest counterargument — that recycling technology might erode virgin gas demand faster than expected — is real but underweights the volume growth from semiconductor fab expansion in APAC.
Our analysis suggests three strategic priorities for the 2026–2032 horizon:
Investors: Target upstream helium assets and rare-gas recovery infrastructure, where price inelasticity and supply concentration create durable margin protection.
Operators: Deploy closed-loop recovery in high-purity fab environments (xenon, neon) where payback is now under 3 years at current prices.
Distributors: Secure long-term offtake from regional JVs (POSCO, Messer-QatarEnergy type) to hedge against Western supply concentration risk.
What would change our conclusion: a breakthrough in low-cost noble gas synthesis, or a rapid semiconductor capex slowdown in APAC that would loosen rare gas demand and reverse price trends. Absent either, the market remains structurally bullish for incumbent producers and secured buyers.
Noble Gases Market Regional Market Share
Higher Coverage
Lower Coverage
No Coverage
Noble Gases Market REPORT HIGHLIGHTS
Research Methodology & Data Sources
Our rigorous research methodology combines multi-layered approaches with comprehensive quality assurance, ensuring precision, accuracy, and reliability in every market analysis.
Primary Research & Industry Fieldwork
We maintain a disciplined 70/30 primary-to-secondary research split. In-depth interviews were conducted across the value chain, including raw material suppliers (helium-rich gas processors, air separation unit operators), specialized producers (xenon/krypton refiners for semiconductor fabs), contract formulators (gas-mixture blenders for medical applications), and global distributors (bulk and cylinder channel operators). Decision-maker designations interviewed included VP of Sourcing, Heads of R&D, Technical Directors, and Commercial Operations Leads across North America, Europe, and Asia Pacific.
Key Stakeholders Interviewed
Key Stakeholders Interviewed
Stakeholder Role
Interview Share (%)
R&D & Technical Directors
40%
Procurement & Sourcing Leads
35%
Regulatory Affairs Managers
25%
Industry Ecosystem Breakdown
Industry Ecosystem Breakdown
Company Type
Representation (%)
Raw Material & Gas Producers
45%
Specialized Formulators & Blenders
35%
Distributors & Traders
20%
Secondary Benchmarking & Public Trade Validation
We cross-reference official multilateral trade databases — UN Comtrade, WTO, US ITC, and Eurostat — for import-export flow validation. Corporate annual filings (SEC 10-K, annual investor presentations, capacity disclosures) are used to triangulate producer capacity. Patent databases and recognized technical standards bodies inform technology adoption curves. No third-party market research publisher data is cited as primary evidence in our validation methodology.
Demand Modeling & Market Sizing Triangulation
Our market sizing triangulates two independent approaches simultaneously. Top-down modeling begins with macroeconomic and industry segment allocation — semiconductor capex, healthcare imaging installed base, aerospace launch cadence. Bottom-up modeling builds from manufacturer capacity (ASU output, helium extraction volumes), product pricing (per MCF and per liter), and end-use consumption modeling per application vertical. Discrepancies between the two are reconciled through elasticity analysis.
Table 16: Europe Noble Gases Market Revenue Billion Forecast, by Type 2020 & 2034
Europe Noble Gases Market Revenue Billion Forecast, by Purity 2020 & 2034
Frequently Asked Questions
1. What is the global noble gases market size in 2026?
The noble gases market is estimated at approximately 49 Billion in 2026, growing from 46.42 Billion in 2025 at a 5.5% CAGR.
2. Which segment leads the noble gases market?
Helium dominates the market due to MRI cryogenics, respiratory therapy, and aerospace applications, followed by argon and neon for industrial and semiconductor uses.
3. What is the forecast CAGR for noble gases?
Published estimates converge around 5.5% CAGR through 2032, though narrower product-only definitions suggest 5.1–5.6% depending on scope.
4. Which region leads the noble gases market?
Asia Pacific leads due to semiconductor fab concentration in South Korea, China, and Japan, while North America dominates helium production and export.
5. Who are the top players in noble gases?
Air Liquide, Linde, Air Products, Messer, Taiyo Nippon Sanso, and Iwatani lead through scale, distribution networks, and upstream helium offtake agreements.
Saudi Arabia
UAE
South Africa
Rest of MEA
Figure 18: Europe Noble Gases Market Revenue (Billion), by Application 2026 & 2034
Figure 19: Europe Noble Gases Market Revenue Share (%), by Application 2026 & 2034
Figure 20: Europe Noble Gases Market Revenue (Billion), by End-User Industry 2026 & 2034
Figure 21: Europe Noble Gases Market Revenue Share (%), by End-User Industry 2026 & 2034
Figure 22: Europe Noble Gases Market Revenue (Billion), by Distribution 2026 & 2034
Figure 23: Europe Noble Gases Market Revenue Share (%), by Distribution 2026 & 2034
Figure 24: Europe Noble Gases Market Revenue (Billion), by Country 2026 & 2034
Figure 25: Europe Noble Gases Market Revenue Share (%), by Country 2026 & 2034
Figure 26: Asia Pacific Noble Gases Market Revenue (Billion), by Type 2026 & 2034
Figure 27: Asia Pacific Noble Gases Market Revenue Share (%), by Type 2026 & 2034
Figure 28: Asia Pacific Noble Gases Market Revenue (Billion), by Purity 2026 & 2034
Figure 29: Asia Pacific Noble Gases Market Revenue Share (%), by Purity 2026 & 2034
Figure 30: Asia Pacific Noble Gases Market Revenue (Billion), by Application 2026 & 2034
Figure 31: Asia Pacific Noble Gases Market Revenue Share (%), by Application 2026 & 2034
Figure 32: Asia Pacific Noble Gases Market Revenue (Billion), by End-User Industry 2026 & 2034
Figure 33: Asia Pacific Noble Gases Market Revenue Share (%), by End-User Industry 2026 & 2034
Figure 34: Asia Pacific Noble Gases Market Revenue (Billion), by Distribution 2026 & 2034
Figure 35: Asia Pacific Noble Gases Market Revenue Share (%), by Distribution 2026 & 2034
Figure 36: Asia Pacific Noble Gases Market Revenue (Billion), by Country 2026 & 2034
Figure 37: Asia Pacific Noble Gases Market Revenue Share (%), by Country 2026 & 2034
Figure 38: South America Noble Gases Market Revenue (Billion), by Type 2026 & 2034
Figure 39: South America Noble Gases Market Revenue Share (%), by Type 2026 & 2034
Figure 40: South America Noble Gases Market Revenue (Billion), by Purity 2026 & 2034
Figure 41: South America Noble Gases Market Revenue Share (%), by Purity 2026 & 2034
Figure 42: South America Noble Gases Market Revenue (Billion), by Application 2026 & 2034
Figure 43: South America Noble Gases Market Revenue Share (%), by Application 2026 & 2034
Figure 44: South America Noble Gases Market Revenue (Billion), by End-User Industry 2026 & 2034
Figure 45: South America Noble Gases Market Revenue Share (%), by End-User Industry 2026 & 2034
Figure 46: South America Noble Gases Market Revenue (Billion), by Distribution 2026 & 2034
Figure 47: South America Noble Gases Market Revenue Share (%), by Distribution 2026 & 2034
Figure 48: South America Noble Gases Market Revenue (Billion), by Country 2026 & 2034
Figure 49: South America Noble Gases Market Revenue Share (%), by Country 2026 & 2034
Figure 50: Middle East & Africa Noble Gases Market Revenue (Billion), by Type 2026 & 2034
Figure 51: Middle East & Africa Noble Gases Market Revenue Share (%), by Type 2026 & 2034
Figure 52: Middle East & Africa Noble Gases Market Revenue (Billion), by Purity 2026 & 2034
Figure 53: Middle East & Africa Noble Gases Market Revenue Share (%), by Purity 2026 & 2034
Figure 54: Middle East & Africa Noble Gases Market Revenue (Billion), by Application 2026 & 2034
Figure 55: Middle East & Africa Noble Gases Market Revenue Share (%), by Application 2026 & 2034
Figure 56: Middle East & Africa Noble Gases Market Revenue (Billion), by End-User Industry 2026 & 2034
Figure 57: Middle East & Africa Noble Gases Market Revenue Share (%), by End-User Industry 2026 & 2034
Figure 58: Middle East & Africa Noble Gases Market Revenue (Billion), by Distribution 2026 & 2034
Figure 59: Middle East & Africa Noble Gases Market Revenue Share (%), by Distribution 2026 & 2034
Figure 60: Middle East & Africa Noble Gases Market Revenue (Billion), by Country 2026 & 2034
Figure 61: Middle East & Africa Noble Gases Market Revenue Share (%), by Country 2026 & 2034
Table 17:
Table 18: Europe Noble Gases Market Revenue Billion Forecast, by Application 2020 & 2034
Table 19: Europe Noble Gases Market Revenue Billion Forecast, by End-User Industry 2020 & 2034
Table 20: Europe Noble Gases Market Revenue Billion Forecast, by Distribution 2020 & 2034
Table 21: Europe Noble Gases Market Revenue Billion Forecast, by Country 2020 & 2034