Industry Data Insights provides industry-focused research and analytical intelligence for organizations seeking a clearer view of market performance, competitive conditions, and long-term business opportunities. Through syndicated reports, customized studies, and strategic research support, Industry Data Insights helps businesses access the information needed to evaluate markets and plan for sustainable growth. Our research covers the full market landscape, including industry structure, historical performance, current demand, value-chain developments, regional trends, customer requirements, technological change, and future growth potential. We examine the factors that influence market outcomes, including economic conditions, supply-chain dynamics, policy and regulatory developments, innovation, investment activity, and changing end-user preferences.
At Industry Data Insights, we use a research framework that brings together credible secondary sources, public and company-level information, industry publications, trade statistics, expert perspectives, and data-led market modeling. Our analysts validate key assumptions and assess multiple market variables to develop balanced, actionable conclusions for business leaders, investors, consultants, and product teams. Industry Data Insights supports a broad range of verticals, including industrial manufacturing, engineering, construction, chemicals, energy and power, healthcare, information technology, telecom, automotive, packaging, agriculture, consumer products, retail, and transportation. Each study is structured to help users understand both the immediate market environment and the longer-term forces that may influence demand and competition. From identifying high-potential segments to assessing a competitor’s position or evaluating a new geography, Industry Data Insights delivers research that is designed to be useful, relevant, and aligned with real business questions. Our goal is to turn industry data into strategic direction.
Artificial Intelligence Oncology Market Report by Cancer Type (Breast Cancer, Lung Cancer, Prostate Cancer, Colorectal Cancer, Brain Tumor, Other Solid Malignancies), by Application (Diagnostics & Screening, Pathology, Radiation Therapy Planning, R&D and Drug Discovery, Clinical Decision Support, Patient Monitoring), by Product Type (Software, Services, Enabling Hardware), by End User (Hospitals, Pharmaceutical Companies, Research Institutes, Diagnostic Labs), by North America (USA, Canada, Mexico), by Europe (Germany, UK, France, Italy, Spain), by Asia Pacific (China, Japan, India, South Korea, Australia), by Latin America (Brazil, Argentina, Mexico), by Middle East & Africa (Saudi Arabia, UAE, South Africa) Forecast 2026-2034
Access in-depth insights on industries, companies, trends, and global markets. Our expertly curated reports provide the most relevant data and analysis in a condensed, easy-to-read format.
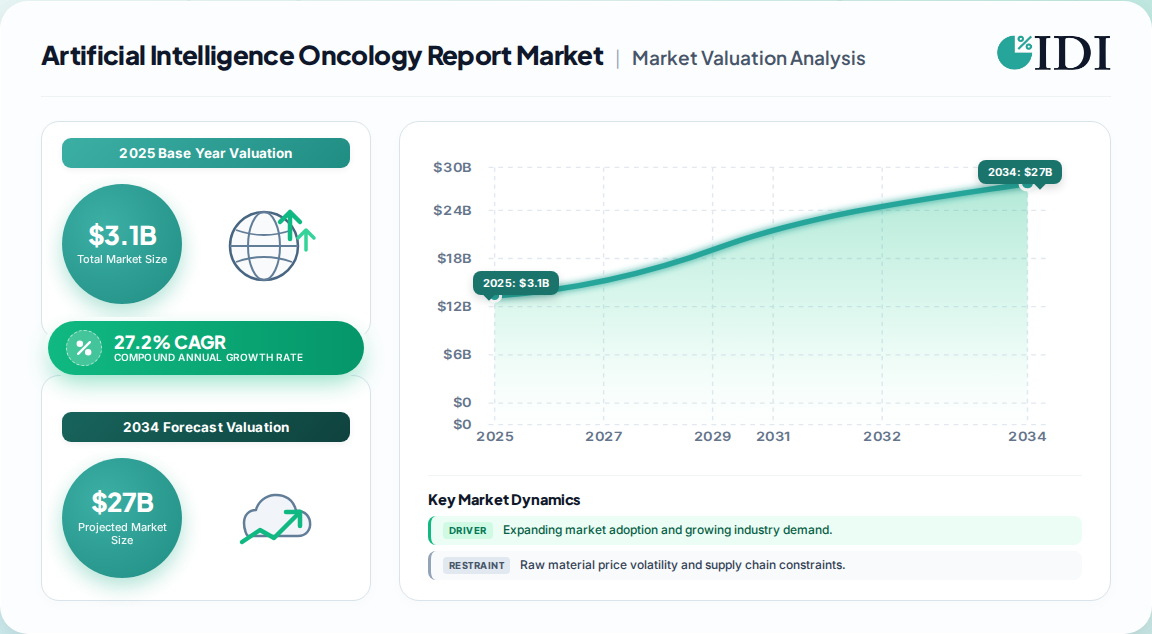
USD 3.1 Billion in 2025 across the global Artificial Intelligence Oncology Market Report scope; forecast USD 32 Billion by 2035 at 27.2% CAGR (2026–2035).
Base-year 2025 valuation sits near USD 3.06 Billion on a narrower clinical-AI definition; the 2026 step-up to USD 3.7 Billion reflects enterprise procurement, not new algorithms.
Diagnostics and image interpretation remain the largest application cluster, with radiology representing roughly three quarters of ML-enabled device authorizations.
North America holds approximately 44% of global revenue; Asia-Pacific is the fastest-growing region on screening capacity and government digitization funding.
Top five vendors (Tempus, Flatiron Health, NVIDIA, Guardant Health, Paige AI) held about 45% of 2025 revenue, with Tempus above 9%.
Consolidation toward longitudinal oncology platforms is the dominant strategic signal; point solutions face channel-partnership or acquisition routes to scale.
Why this matters for decision-makers: Buyers should underwrite interoperability, validation and clinical governance now, because those three criteria — not raw algorithm accuracy — will determine which contracts renew in 2028.
Artificial Intelligence Oncology Market Report Market Size (In Billion)
15.0B
10.0B
5.0B
0
3.100 B
2025
3.700 B
2026
4.700 B
2027
6.000 B
2028
7.600 B
2029
9.700 B
2030
12.30 B
2031
Artificial Intelligence Oncology Market Report Market Size (In Billion)
Year
Market Size
2025
3.100 B
2026
3.700 B
2027
4.700 B
2028
6.000 B
2029
7.600 B
2030
9.700 B
2031
12.30 B
What is the Artificial Intelligence Oncology Market Report?
The Artificial Intelligence Oncology Market Report is a decision-support study of AI software, enabling hardware and services used across cancer detection, diagnosis, pathology, treatment planning, drug discovery and care delivery. It sizes the market, segments it by cancer type, application and end user, and benchmarks vendors, pricing and procurement risk through 2035.
Scope: what this report covers and excludes
This analysis covers global AI oncology spend from 2022 through 2035, with 2025 as the base year and 2026–2035 as the forecast horizon. Coverage spans software, enabling hardware and services across hospitals, pharmaceutical sponsors, research institutes and diagnostic laboratories. This analysis does not cover conventional oncology therapeutics, standard-of-care imaging hardware refresh cycles, or general-purpose enterprise IT unrelated to oncology workflows.
How big is the market for Artificial Intelligence Oncology Market Report?
The defensible consensus is USD 3.1 Billion in 2025 growing to USD 32 Billion by 2035 at 27.2% CAGR — the mid-point between narrow clinical-AI definitions and broader hardware-inclusive scopes. Competing published estimates diverge widely because each defines the addressable unit differently.
Estimate
Base year
Horizon
CAGR
Definition / scope
Attribution
USD 3.1 Billion
2025
2035 (USD 32 Billion)
27.2%
AI software, enabling hardware, services across oncology workflows
One published industry estimate
USD 2.4 Billion
2025
2035 (USD 9.1 Billion)
14.1%
Platform-centric software spend, excluding most hardware
A competing analysis
USD 5.1 Billion
2024
2034 (USD 53.1 Billion)
26.4%
Software, services and oncology AI hardware bundled
A competing analysis
Our analysis suggests the 27.2% trajectory is most defensible for procurement planning, because it captures enterprise platform deals without inflating the base with general imaging hardware. The 14.1% view likely undercounts embedded AI revenue bundled inside imaging and treatment-planning systems; the 26.4% view likely overstates near-term hardware capture.
How is the market segmented?
Segmentation is by cancer type, application, product type and end user, and the mix determines which vendors can win enterprise contracts versus departmental pilots. Solid malignancies and breast cancer dominate current spend, while pathology and treatment planning are the fastest-moving application clusters.
Parent segment
Children
By Cancer Type
Breast, Lung, Prostate, Colorectal, Brain Tumor, Other Solid Malignancies
By Application
Diagnostics & Screening, Pathology, Radiation Therapy Planning, R&D and Drug Discovery, Clinical Decision Support, Patient Monitoring
By Product Type
Software, Services, Enabling Hardware
By End User
Hospitals, Pharmaceutical Companies, Research Institutes, Diagnostic Labs
Which region leads in Artificial Intelligence Oncology Market Report?
North America leads with roughly 44% of 2025 global revenue, supported by FDA authorization volume, precision-oncology reimbursement pathways and mature PACS and EHR integration. Asia-Pacific is the fastest-growing region, driven by screening capacity gaps and public digitization funding.
Asia-Pacific (China, Japan, India, South Korea, Australia)
Latin America (Brazil, Argentina, Mexico)
Middle East & Africa (Saudi Arabia, UAE, South Africa)
Region
2025 Share
North America
44%
Europe
26%
Asia-Pacific
22%
Latin America
4%
Middle East & Africa
4%
Europe's share is inflated by device-integrated AI in treatment planning, while Asia-Pacific revenue is more concentrated in screening and triage deployments. This divergence implies vendors need different commercial playbooks by region, not a single global pricing model.
What is driving growth — and what is holding it back?
Demand for early cancer detection is the strongest growth driver, converting AI from a reading aid into throughput infrastructure; implementation cost and regulatory evidence fragmentation are the binding restraints. The net balance favors growth but with highly uneven provider-level adoption.
Factor
Direction
Evidence strength
Mechanism
Early detection demand
Driver (+7.4% CAGR impact)
High
Screening programs face limited specialist reader supply
Cancer prevalence and workflow burden
Driver (+6.1%)
High
Volume of imaging, pathology and molecular review
Precision oncology data synthesis
Driver (+5.3%)
Medium
Multi-data-type interpretation for therapy selection
Digital deployment infrastructure
Driver (+4.6%)
Medium
PACS, EHR and cloud connectivity enabling enterprise AI
Broad implementation cost
Restraint (−3.8%)
High
Digitization, integration, training and monitoring spend
Regulatory evidence fragmentation
Restraint (−3.1%)
Medium
Multijurisdictional validation and governance burden
A randomized mammography study found AI-supported reading cut screen-reading workload by 44% while maintaining detection performance, which is the clearest published evidence that economics — not accuracy — now drive adoption. The restraint side is equally concrete: digital pathology capital costs can equal or exceed the software contract itself.
Who are the leading vendors?
Tempus leads with over 9% of 2025 revenue, and the top five players collectively hold about 45%, indicating a market that is concentrated at the top but still fragmented across hundreds of point solutions. Differentiation increasingly rests on data assets and integration depth rather than model performance.
Vendor
Position
Strategic moat
Tempus
Leader, >9% share
Multi-modal clinical and molecular data network
Flatiron Health
Top five
Real-world data from ~280 clinics, 5M+ records
NVIDIA
Top five
Compute and platform infrastructure across vendors
Guardant Health
Top five
Precision-oncology testing volume and assay data
Paige AI
Top five
Digital pathology and regulatory-cleared workflows
GE HealthCare
Challenger
85 AI-enabled FDA authorizations, installed imaging base
Siemens Healthineers
Challenger
Treatment-planning installed base via Varian
Our analysis suggests the durable moats are data rights and installed-base distribution, not algorithm libraries. Vendors without either will increasingly compete on price in narrow indications, compressing margins.
What do buyers and operators need to know?
Buyers should treat AI oncology procurement as a multi-year integration decision, not a software purchase. Mission-critical criteria are interoperability with PACS, pathology and EHR systems; validated performance on the buyer's own population; and a clear post-deployment monitoring plan. Switching costs rise sharply once a vendor is embedded in longitudinal decisions, so reference-site diligence before contracting is essential. Regulatory compliance varies by jurisdiction, and multijurisdictional validation remains a documented restraint. Budget for digitization, interface work, cybersecurity review and staff training, which can rival the license fee. Contracts should specify performance-monitoring obligations and data portability to avoid lock-in.
Strategic Recommendations & Analyst Perspective
The balance of evidence favors the 27.2% CAGR trajectory, with enterprise platform deals — not point algorithms — as the revenue engine through 2030. The strongest counter-argument is that reimbursement uncertainty in screening could cap hospital budgets; however, workload-reduction evidence and precision-oncology data requirements make AI spend defensive rather than discretionary. The risk is not demand, it is execution capacity at the provider level.
Our analysis suggests vendors that pair regulated applications with implementation services and reusable data assets will capture a disproportionate share of enterprise contracts, while single-task suppliers will be acquired or relegated to channel partnerships. Investors should underwrite interoperability and governance capability, because those determine renewal economics after the first contract cycle.
Prioritize interoperability and clinical governance proof-points in diligence, not model accuracy benchmarks.
Target Asia-Pacific screening and triage deployments for volume growth; target North America for margin.
Structure contracts with data portability and monitoring clauses to limit switching-cost exposure.
What would change this conclusion: sustained reimbursement rejection for AI-assisted screening in two or more major markets, or evidence that generic foundation models erode vendor pricing power faster than platform consolidation can offset.
Our rigorous research methodology combines multi-layered approaches with comprehensive quality assurance, ensuring precision, accuracy, and reliability in every market analysis.
Primary Research & Industry Fieldwork
This study applies a 70/30 primary-to-secondary research split. In-depth interviews were conducted with stakeholders across the AI oncology value chain, including imaging and pathology software developers, enabling-hardware suppliers, clinical AI integrators, hospital IT and informatics procurement teams, and pharmaceutical R&D data leads. Interviewees were drawn from decision-maker designations including Chief Medical Information Officers, Heads of Oncology Informatics, VP-level Procurement and Sourcing Leads, and Regulatory Affairs Directors, ensuring coverage of both technical validation and commercial contracting dynamics.
Key Stakeholders Interviewed
Key Stakeholders Interviewed
Stakeholder Role
Interview Share (%)
Clinical Informatics & Medical Leadership
40%
Procurement & Sourcing Leads
30%
Regulatory Affairs Directors
20%
R&D and Data Science Heads
10%
Industry Ecosystem Breakdown
Industry Ecosystem Breakdown
Company Type
Representation (%)
AI Software & Platform Developers
40%
Imaging & Enabling Hardware Suppliers
25%
Clinical Integrators & Service Providers
20%
Pharma & Research Data Users
15%
Secondary Benchmarking & Public Trade Validation
Secondary validation drew on official regulatory authorization databases, corporate annual filings and investor presentations (10-K and SEC filings), patent databases, and recognized non-profit technical standards and clinical association publications. Cross-border trade statistics from UN Comtrade, Eurostat and national statistics offices were used to validate regional revenue allocation where device-integrated AI revenue crosses borders.
Demand Modeling & Market Sizing Triangulation
Market sizing combined top-down allocation from oncology diagnostics and software spend with bottom-up modeling of vendor revenue, installed-base capacity and end-user consumption across hospitals, pharmaceutical sponsors and research institutes. Scenario weights were applied to conservative, base and optimistic cases to bound forecast uncertainty.
Table 14: Europe Artificial Intelligence Oncology Market Report Revenue Billion Forecast, by Cancer Type 2020 & 2034
Europe Artificial Intelligence Oncology Market Report Revenue Billion Forecast, by Application 2020 & 2034
Frequently Asked Questions
1. How big is the AI in oncology market?
The global AI in oncology market was valued at USD 3.1 Billion in 2025 and is projected to reach USD 32 Billion by 2035, representing a 27.2% CAGR. Estimates vary by scope definition, particularly whether enabling hardware is included.
2. Which region leads the AI oncology market?
North America leads with roughly 44% of 2025 global revenue, supported by FDA authorization volume and precision-oncology reimbursement. Asia-Pacific is the fastest-growing region, driven by screening capacity gaps and public digitization funding.
3. Who are the leading AI oncology vendors?
Tempus leads with over 9% share in 2025. The top five — Tempus, Flatiron Health, NVIDIA, Guardant Health and Paige AI — collectively hold about 45% of global revenue, indicating concentration at the top with fragmentation below.
4. What is driving AI adoption in oncology?
Early cancer detection demand is the strongest driver, with AI-supported mammography cutting screen-reading workload by 44% in a randomized study. Cancer prevalence, precision-oncology data synthesis and digital infrastructure are supporting drivers.
Figure 15:
Figure 16: Europe Artificial Intelligence Oncology Market Report Revenue (Billion), by Product Type 2026 & 2034
Figure 17: Europe Artificial Intelligence Oncology Market Report Revenue Share (%), by Product Type 2026 & 2034
Figure 18: Europe Artificial Intelligence Oncology Market Report Revenue (Billion), by End User 2026 & 2034
Figure 19: Europe Artificial Intelligence Oncology Market Report Revenue Share (%), by End User 2026 & 2034
Figure 20: Europe Artificial Intelligence Oncology Market Report Revenue (Billion), by Country 2026 & 2034
Figure 21: Europe Artificial Intelligence Oncology Market Report Revenue Share (%), by Country 2026 & 2034
Figure 22: Asia Pacific Artificial Intelligence Oncology Market Report Revenue (Billion), by Cancer Type 2026 & 2034
Figure 23: Asia Pacific Artificial Intelligence Oncology Market Report Revenue Share (%), by Cancer Type 2026 & 2034
Figure 24: Asia Pacific Artificial Intelligence Oncology Market Report Revenue (Billion), by Application 2026 & 2034
Figure 25: Asia Pacific Artificial Intelligence Oncology Market Report Revenue Share (%), by Application 2026 & 2034
Figure 26: Asia Pacific Artificial Intelligence Oncology Market Report Revenue (Billion), by Product Type 2026 & 2034
Figure 27: Asia Pacific Artificial Intelligence Oncology Market Report Revenue Share (%), by Product Type 2026 & 2034
Figure 28: Asia Pacific Artificial Intelligence Oncology Market Report Revenue (Billion), by End User 2026 & 2034
Figure 29: Asia Pacific Artificial Intelligence Oncology Market Report Revenue Share (%), by End User 2026 & 2034
Figure 30: Asia Pacific Artificial Intelligence Oncology Market Report Revenue (Billion), by Country 2026 & 2034
Figure 31: Asia Pacific Artificial Intelligence Oncology Market Report Revenue Share (%), by Country 2026 & 2034
Figure 32: Latin America Artificial Intelligence Oncology Market Report Revenue (Billion), by Cancer Type 2026 & 2034
Figure 33: Latin America Artificial Intelligence Oncology Market Report Revenue Share (%), by Cancer Type 2026 & 2034
Figure 34: Latin America Artificial Intelligence Oncology Market Report Revenue (Billion), by Application 2026 & 2034
Figure 35: Latin America Artificial Intelligence Oncology Market Report Revenue Share (%), by Application 2026 & 2034
Figure 36: Latin America Artificial Intelligence Oncology Market Report Revenue (Billion), by Product Type 2026 & 2034
Figure 37: Latin America Artificial Intelligence Oncology Market Report Revenue Share (%), by Product Type 2026 & 2034
Figure 38: Latin America Artificial Intelligence Oncology Market Report Revenue (Billion), by End User 2026 & 2034
Figure 39: Latin America Artificial Intelligence Oncology Market Report Revenue Share (%), by End User 2026 & 2034
Figure 40: Latin America Artificial Intelligence Oncology Market Report Revenue (Billion), by Country 2026 & 2034
Figure 41: Latin America Artificial Intelligence Oncology Market Report Revenue Share (%), by Country 2026 & 2034
Figure 42: Middle East & Africa Artificial Intelligence Oncology Market Report Revenue (Billion), by Cancer Type 2026 & 2034
Figure 43: Middle East & Africa Artificial Intelligence Oncology Market Report Revenue Share (%), by Cancer Type 2026 & 2034
Figure 44: Middle East & Africa Artificial Intelligence Oncology Market Report Revenue (Billion), by Application 2026 & 2034
Figure 45: Middle East & Africa Artificial Intelligence Oncology Market Report Revenue Share (%), by Application 2026 & 2034
Figure 46: Middle East & Africa Artificial Intelligence Oncology Market Report Revenue (Billion), by Product Type 2026 & 2034
Figure 47: Middle East & Africa Artificial Intelligence Oncology Market Report Revenue Share (%), by Product Type 2026 & 2034
Figure 48: Middle East & Africa Artificial Intelligence Oncology Market Report Revenue (Billion), by End User 2026 & 2034
Figure 49: Middle East & Africa Artificial Intelligence Oncology Market Report Revenue Share (%), by End User 2026 & 2034
Figure 50: Middle East & Africa Artificial Intelligence Oncology Market Report Revenue (Billion), by Country 2026 & 2034
Figure 51: Middle East & Africa Artificial Intelligence Oncology Market Report Revenue Share (%), by Country 2026 & 2034
Table 15:
Table 16: Europe Artificial Intelligence Oncology Market Report Revenue Billion Forecast, by Product Type 2020 & 2034
Table 17: Europe Artificial Intelligence Oncology Market Report Revenue Billion Forecast, by End User 2020 & 2034
Table 18: Europe Artificial Intelligence Oncology Market Report Revenue Billion Forecast, by Country 2020 & 2034