Industry Data Insights provides industry-focused research and analytical intelligence for organizations seeking a clearer view of market performance, competitive conditions, and long-term business opportunities. Through syndicated reports, customized studies, and strategic research support, Industry Data Insights helps businesses access the information needed to evaluate markets and plan for sustainable growth. Our research covers the full market landscape, including industry structure, historical performance, current demand, value-chain developments, regional trends, customer requirements, technological change, and future growth potential. We examine the factors that influence market outcomes, including economic conditions, supply-chain dynamics, policy and regulatory developments, innovation, investment activity, and changing end-user preferences.
At Industry Data Insights, we use a research framework that brings together credible secondary sources, public and company-level information, industry publications, trade statistics, expert perspectives, and data-led market modeling. Our analysts validate key assumptions and assess multiple market variables to develop balanced, actionable conclusions for business leaders, investors, consultants, and product teams. Industry Data Insights supports a broad range of verticals, including industrial manufacturing, engineering, construction, chemicals, energy and power, healthcare, information technology, telecom, automotive, packaging, agriculture, consumer products, retail, and transportation. Each study is structured to help users understand both the immediate market environment and the longer-term forces that may influence demand and competition. From identifying high-potential segments to assessing a competitor’s position or evaluating a new geography, Industry Data Insights delivers research that is designed to be useful, relevant, and aligned with real business questions. Our goal is to turn industry data into strategic direction.
Military Edge Computing Market Report 2026: Size, CAGR & Outlook
Military Edge Computing Market Report
Updated On
Nov 18 2026
Total Pages
274
Shweta Thorat
Research Associate
Military Edge Computing Market Report 2026: Size, CAGR & Outlook
Military Edge Computing Market Report by Component (Hardware, Software, Services), by Platform (Land, Airborne, Naval, Space, Unmanned Aerial Vehicles, Unmanned Ground Vehicles), by Application (ISR, Command & Control, Autonomous Systems, Predictive Maintenance, Cybersecurity, Simulation & Training, Logistics), by End User (Army, Navy, Air Force, Space Force, Defense Agencies, Government), by Deployment (On-Premises, Cloud-Managed, Hybrid), by North America (USA, Canada, Mexico), by Europe (Germany, UK, France, Italy, Poland), by Asia-Pacific (China, Japan, India, South Korea, Australia), by Latin America (Brazil, Argentina, Mexico), by Middle East & Africa (Saudi Arabia, UAE, Israel, South Africa) Forecast 2026-2034
Military Edge Computing Market Report 2026: Size, CAGR & Outlook
Discover the Latest Market Insight Reports
Access in-depth insights on industries, companies, trends, and global markets. Our expertly curated reports provide the most relevant data and analysis in a condensed, easy-to-read format.
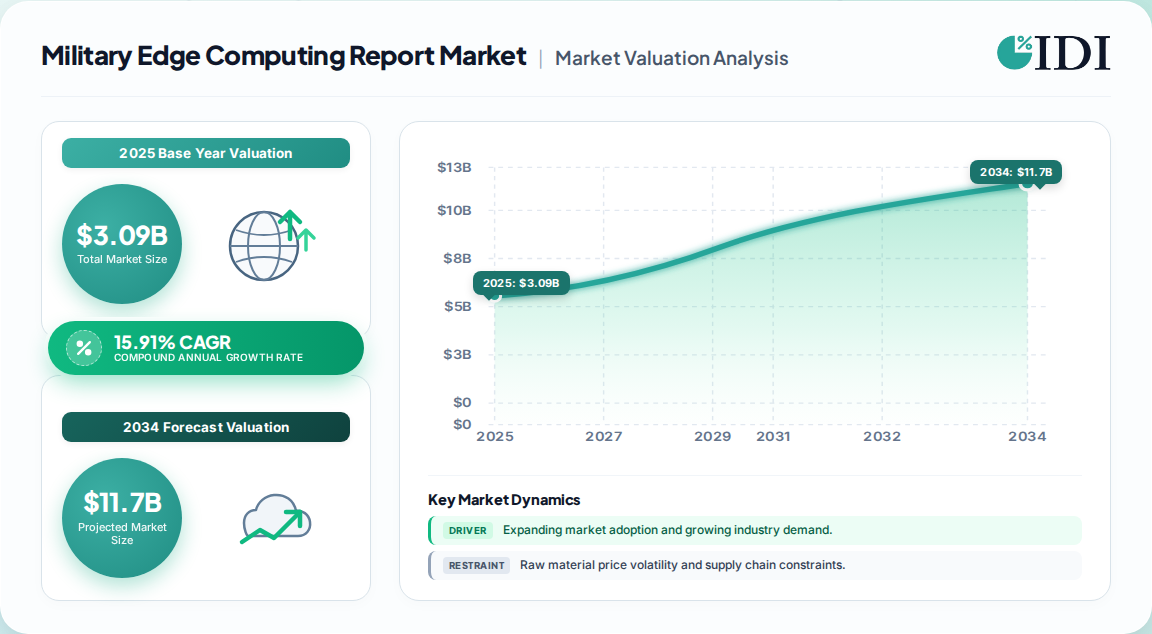
The global military edge computing market is valued at USD 3.09 Billion in 2025, with published estimates diverging between USD 3.0 Billion and USD 3.2 Billion depending on scope.
Forecasts to 2033–2035 cluster around a 13–17% CAGR, with a consensus midpoint near 15.9%, implying a USD 13.5 Billion market by 2035.
Hardware dominates component spend (52–62% share), reflecting demand for rugged mission computers and tactical servers.
North America leads with roughly 37–42% revenue share; Asia-Pacific is the fastest-growing region on autonomous systems adoption.
Land platforms capture about half of platform revenue, while space-based edge is the fastest-growing niche.
Leading players include Lockheed Martin, Northrop Grumman, RTX, General Dynamics, BAE Systems, Thales, L3Harris, Curtiss-Wright and Mercury Systems.
Why this matters for decision-makers: Buyers must architect for open standards and software-defined upgradeability now, or face vendor lock-in and re-accreditation costs as AI workloads scale at the tactical edge.
Military Edge Computing Market Report Market Size (In Billion)
7.5B
6.0B
4.5B
3.0B
1.5B
0
2.660 B
2024
3.090 B
2025
3.580 B
2026
4.150 B
2027
4.810 B
2028
5.570 B
2029
6.460 B
2030
Military Edge Computing Market Report Market Size (In Billion)
Year
Market Size
2024
2.660 B
2025
3.090 B
2026
3.580 B
2027
4.150 B
2028
4.810 B
2029
5.570 B
2030
6.460 B
What is the Military Edge Computing Market Report?
The military edge computing market report covers ruggedized hardware, software and services that process sensor and mission data close to the point of generation in defense operations, reducing latency and preserving connectivity in contested or denied environments across land, air, naval and space platforms.
Scope: what this report covers and excludes
This analysis covers military edge computing hardware (rugged servers, mission computers, tactical gateways, AI accelerators), software (edge analytics, orchestration, zero-trust security) and integration services across land, airborne, naval and space platforms, plus defense and government end users. It excludes general-purpose commercial edge computing, commercial cloud infrastructure, and non-defense industrial IoT.
How big is the market for Military Edge Computing Market Report?
The market is most defensibly sized at USD 3.09 Billion in 2025, growing to roughly USD 13.5 Billion by 2035 at a compound rate near 15.9%. Estimates diverge mainly on whether services and space-based edge are included.
Estimate
Base Year
Horizon
CAGR
Definition / Scope
Attribution
USD 2.66 Billion
2024
2035
15.91%
Broad: hardware, software, services, all platforms
One published estimate
USD 3.2 Billion
2025
2033
14.9%
Component + platform + ISR-led end use
A competing analysis
USD 2.1 Billion
2025
2035
16.8%
Component, deployment, technology, application
A competing analysis
USD 2.64 Billion
2025
2035
15.70%
Hardware-led, land-dominant, space included
A competing analysis
The USD 2.66 Billion (2024) and USD 3.09 Billion (2025) sequence is internally consistent and anchored to the most granular platform taxonomy. Our analysis suggests the lower USD 2.1 Billion base reflects narrower technology segmentation, while the USD 3.2 Billion figure may fold in adjacent tactical cloud services. For planning, the 2025 midpoint of USD 3.0–3.1 Billion is the most defensible anchor.
How is the market segmented?
Segmentation follows four primary lenses: component, platform, application and end user. Hardware leads on revenue, while software and cybersecurity grow fastest as AI workloads migrate to the tactical edge.
Army, Navy, Air Force, Space Force, Defense Agencies, Government
By Deployment
On-Premises, Cloud-Managed, Hybrid
Which region leads in the Military Edge Computing Market Report?
North America leads with an estimated 37–42% revenue share in 2025, driven by U.S. Department of Defense JADC2, AI-at-the-edge and distributed operations funding. Asia-Pacific is the fastest-growing region, supported by autonomous systems and naval modernization.
Military Edge Computing Market Report Regional Market Share
Loading chart...
Military Edge Computing Market Report Regional Market Share
Region
Market Share (%)
North America
0.4%
Europe
0.22%
Asia-Pacific
0.26%
Latin America
0.05%
Middle East & Africa
0.07%
North America — USA, Canada, Mexico
Europe — Germany, UK, France, Italy, Poland
Asia-Pacific — China, Japan, India, South Korea, Australia
Latin America — Brazil, Argentina, Mexico
Middle East & Africa — Saudi Arabia, UAE, Israel, South Africa
Region
2025 Share
North America
~40%
Asia-Pacific
~26%
Europe
~22%
Middle East & Africa
~7%
Latin America
~5%
The U.S. alone is estimated at roughly USD 0.9 Billion in 2025, with forecasts near USD 3.8 Billion by 2035. Our analysis suggests Europe's share will drift upward as multi-national FCAS and MGCS programs embed edge compute requirements into platform specifications.
What is driving growth — and what is holding it back?
Growth is driven by AI-enabled decision support at the tactical edge, autonomous platform proliferation, and the need to operate in communication-denied environments. Restraints center on size, weight and power (SWaP) limits, security accreditation timelines and procurement complexity.
Factor
Direction
Evidence Strength
Mechanism
AI at the tactical edge
Driver
High
Real-time analytics on sensor data reduce decision latency
Autonomous systems and UAVs
Driver
High
Onboard compute for autonomy and sensor fusion
Contested / denied communications
Driver
High
Local processing sustains operations without cloud links
Cybersecurity modernization
Driver
High
Zero-trust and encryption at edge nodes
SWaP constraints
Restraint
Medium
Limits compute density on small platforms
Security accreditation
Restraint
Medium
Certification timelines delay deployment
Procurement complexity
Restraint
Medium
Multi-year budget cycles slow adoption
The balance of evidence favors demand: three high-strength drivers outweigh procedural restraints that mostly affect timing, not total addressable spend. However, our analysis suggests accreditation friction is an underappreciated margin risk for software vendors, because certification costs are largely fixed regardless of deployment scale.
Who are the leading vendors?
The vendor landscape splits into defense primes with platform integration reach and specialized rugged-compute suppliers with deep hardware expertise. Differentiation increasingly rests on open architecture compliance and software ecosystems.
Company
Primary Strength
Edge Positioning
Lockheed Martin
Platform integration, C2
Edge nodes embedded in air and land platforms
Northrop Grumman
ISR, mission systems
Sensor-to-shooter edge processing
RTX (Raytheon)
Sensors, EW
Rugged compute for radar and electronic warfare
General Dynamics
Land systems, C4ISR
Vehicle-mounted mission computers
BAE Systems
Electronic systems
Tactical edge and secure communications
Thales
C4I, sensors
European edge and battlespace management
L3Harris
Communications, ISR
Tactical gateways and edge networking
Curtiss-Wright
Rugged COTS hardware
VPX and mission computer modules
Mercury Systems
Rugged processing
AI-enabled embedded compute
Parry Labs
Open architecture compute
MOSA-aligned mission computers
Primes hold moats through program-of-record incumbency and security clearances. Our analysis suggests specialized vendors retain leverage where open standards (MOSA, SOSA) lower switching costs, because program offices can recompete模块 upgrades without re-platforming.
What do buyers and operators need to know?
Selection hinges on SWaP-C envelope, MIL-STD ruggedization, open architecture compliance, and accreditation readiness. Buyers should require documented MOSA/SOSA conformance to avoid lock-in, and should model total lifecycle cost including re-certification after software upgrades, not just unit price. Vendor financial stability and domestic supply-chain assurance are increasingly weighted criteria in allied procurement.
Switching costs are highest at the software and accreditation layer: migrating an accredited edge stack can take 12–24 months and erode mission readiness. Regulatory compliance spans national security export controls (ITAR/EAR), zero-trust mandates and allied interoperability standards. Operators should also plan for hybrid architectures, since on-premises deployment dominates today but cloud-managed orchestration is the fastest-growing model.
Strategic Recommendations & Analyst Perspective
The balance of evidence favors a mid-teens CAGR through 2035, with the USD 3.0–3.1 Billion 2025 base as the most defensible anchor. The strongest counter-argument is that hardware-heavy spending (52–62%) could compress as software-defined, COTS-based architectures commoditize processing modules. We judge this risk real but slow-moving, because accreditation and ruggedization barriers protect hardware margins longer than commercial IT analogies suggest. Vendors should prioritize open-architecture AI compute modules to capture space and UAV demand, while primes should invest in software orchestration layers to defend platform share.
For investors: Favor rugged-compute specialists with MOSA-aligned portfolios and space-qualified roadmaps over pure platform primes.
For operators: Mandate open standards and hybrid orchestration in requirements to preserve competitive recompetes.
For vendors: Front-load accreditation investment in cybersecurity software, the fastest-growing application segment.
Our conclusion would change if program-of-record budgets shift decisively from platform procurement to cloud-managed edge services before 2030, or if allied export-control liberalization accelerates non-U.S. supplier share.
Military Edge Computing Market Report Regional Market Share
Higher Coverage
Lower Coverage
No Coverage
Military Edge Computing Market Report REPORT HIGHLIGHTS
Research Methodology & Data Sources
Our rigorous research methodology combines multi-layered approaches with comprehensive quality assurance, ensuring precision, accuracy, and reliability in every market analysis.
Primary Research & Industry Fieldwork
This study applies a 70/30 primary-to-secondary research split. We conducted in-depth interviews with stakeholders across the defense edge value chain: ruggedized hardware manufacturers, embedded compute module suppliers, software and AI platform providers, systems integrators, and defense procurement agencies. Decision-maker designations interviewed include VP-level Sourcing and Procurement leads, Heads of R&D and Mission Computing, Technical Directors, and Commercial Operations Leads at defense primes and specialized suppliers. Interviews validated deployment timelines, SWaP constraints, accreditation pathways and pricing structures.
Key Stakeholders Interviewed
Key Stakeholders Interviewed
Stakeholder Role
Interview Share (%)
Procurement & Sourcing Leads
35%
R&D & Mission Computing Heads
30%
Technical Directors
20%
Commercial Operations Leads
15%
Industry Ecosystem Breakdown
Industry Ecosystem Breakdown
Company Type
Representation (%)
Rugged Hardware & Embedded Compute
40%
Software & AI Platform Providers
30%
Systems Integrators & Primes
20%
Defense Procurement Agencies
10%
Secondary Benchmarking & Public Trade Validation
We benchmark against official multilateral databases including UN Comtrade, WTO trade statistics, US ITC datasets and Eurostat, alongside corporate annual filings (10-K, SEC filings, investor presentations), patent databases, and technical standards bodies such as IEEE, SAE International and the Open Group. Defense budget documents from the U.S. Department of Defense and allied ministries were used to anchor program-level demand.
Demand Modeling & Market Sizing Triangulation
We run simultaneous top-down allocation from defense IT and C4ISR budgets and bottom-up modeling of manufacturer capacity, unit pricing and end-use consumption. Divergences between the two models are reconciled through weighted averaging and program-of-record validation.
U.S. Department of Defense budget justification documents
IEEE and SAE International — embedded and rugged computing standards
Eurostat — European defense industrial statistics
SEC 10-K filings — corporate revenue and segment disclosure
Aspects
Details
Study Period
2020-2034
Base Year
2025
Estimated Year
2026
Forecast Period
2026-2034
Historical Period
2020-2025
Growth Rate
CAGR of 15.91% from 2020-2034
Segmentation
By Component
Hardware
Software
Services
By Platform
Land
Airborne
Naval
Space
Unmanned Aerial Vehicles
Unmanned Ground Vehicles
By Application
ISR
Command & Control
Autonomous Systems
Predictive Maintenance
Cybersecurity
Simulation & Training
Logistics
By End User
Army
Navy
Air Force
Space Force
Defense Agencies
Government
By Deployment
On-Premises
Cloud-Managed
Hybrid
By Geography
North America
USA
Canada
Mexico
Europe
Germany
UK
France
Italy
Poland
Asia-Pacific
China
Japan
India
South Korea
Australia
Latin America
Brazil
Argentina
Mexico
Middle East & Africa
Saudi Arabia
UAE
Israel
South Africa
Table of Contents
1. Military Edge Computing Market Report Introduction
1.1. Research Scope
1.2. Market Segmentation
1.3. Research Objective
1.4. Definitions and Assumptions
2. Military Edge Computing Market Report Executive Summary
2.1. Market Snapshot
3. Military Edge Computing Market Report Dynamics
3.1. Introduction
3.2. Market Drivers
3.3. Market Restrains
3.4. Market Trends
4. Military Edge Computing Market Report Factor Analysis
4.1. Porters Five Forces
4.1.1. Bargaining Power of Suppliers
4.1.2. Bargaining Power of Buyers
4.1.3. Threat of New Entrants
4.1.4. Threat of Substitutes
4.1.5. Competitive Rivalry
4.2. PESTEL analysis
4.3. BCG Analysis
4.3.1. Stars (High Growth, High Market Share)
4.3.2. Cash Cows (Low Growth, High Market Share)
4.3.3. Question Mark (High Growth, Low Market Share)
4.3.4. Dogs (Low Growth, Low Market Share)
4.4. Ansoff Matrix Analysis
4.5. Supply Chain Analysis
4.6. Regulatory Landscape
4.7. Current Market Potential and Opportunity Assessment (TAM–SAM–SOM Framework)
4.8. IDI Analyst Note
5. Military Edge Computing Market Report Analysis, Insights and Forecast, 2020-2034
5.1. Analysis, Insights and Forecast - by Component
5.1.1. Hardware
5.1.2. Software
5.1.3. Services
5.2. Analysis, Insights and Forecast - by Platform
5.2.1. Land
5.2.2. Airborne
5.2.3. Naval
5.2.4. Space
5.2.5. Unmanned Aerial Vehicles
5.2.6. Unmanned Ground Vehicles
5.3. Analysis, Insights and Forecast - by Application
5.3.1. ISR
5.3.2. Command & Control
5.3.3. Autonomous Systems
5.3.4. Predictive Maintenance
5.3.5. Cybersecurity
5.3.6. Simulation & Training
5.3.7. Logistics
5.4. Analysis, Insights and Forecast - by End User
5.4.1. Army
5.4.2. Navy
5.4.3. Air Force
5.4.4. Space Force
5.4.5. Defense Agencies
5.4.6. Government
5.5. Analysis, Insights and Forecast - by Deployment
5.5.1. On-Premises
5.5.2. Cloud-Managed
5.5.3. Hybrid
5.6. Analysis, Insights and Forecast - by Region
5.6.1. North America
5.6.2. Europe
5.6.3. Asia-Pacific
5.6.4. Latin America
5.6.5. Middle East & Africa
6. Military Edge Computing Market Report North America Analysis, Insights and Forecast, 2020-2034
6.1. Analysis, Insights and Forecast - by Component
6.1.1. Hardware
6.1.2. Software
6.1.3. Services
6.2. Analysis, Insights and Forecast - by Platform
6.2.1. Land
6.2.2. Airborne
6.2.3. Naval
6.2.4. Space
6.2.5. Unmanned Aerial Vehicles
6.2.6. Unmanned Ground Vehicles
6.3. Analysis, Insights and Forecast - by Application
6.3.1. ISR
6.3.2. Command & Control
6.3.3. Autonomous Systems
6.3.4. Predictive Maintenance
6.3.5. Cybersecurity
6.3.6. Simulation & Training
6.3.7. Logistics
6.4. Analysis, Insights and Forecast - by End User
6.4.1. Army
6.4.2. Navy
6.4.3. Air Force
6.4.4. Space Force
6.4.5. Defense Agencies
6.4.6. Government
6.5. Analysis, Insights and Forecast - by Deployment
6.5.1. On-Premises
6.5.2. Cloud-Managed
6.5.3. Hybrid
7. Military Edge Computing Market Report Europe Analysis, Insights and Forecast, 2020-2034
7.1. Analysis, Insights and Forecast - by Component
7.1.1. Hardware
7.1.2. Software
7.1.3. Services
7.2. Analysis, Insights and Forecast - by Platform
7.2.1. Land
7.2.2. Airborne
7.2.3. Naval
7.2.4. Space
7.2.5. Unmanned Aerial Vehicles
7.2.6. Unmanned Ground Vehicles
7.3. Analysis, Insights and Forecast - by Application
7.3.1. ISR
7.3.2. Command & Control
7.3.3. Autonomous Systems
7.3.4. Predictive Maintenance
7.3.5. Cybersecurity
7.3.6. Simulation & Training
7.3.7. Logistics
7.4. Analysis, Insights and Forecast - by End User
7.4.1. Army
7.4.2. Navy
7.4.3. Air Force
7.4.4. Space Force
7.4.5. Defense Agencies
7.4.6. Government
7.5. Analysis, Insights and Forecast - by Deployment
7.5.1. On-Premises
7.5.2. Cloud-Managed
7.5.3. Hybrid
8. Military Edge Computing Market Report Asia-Pacific Analysis, Insights and Forecast, 2020-2034
8.1. Analysis, Insights and Forecast - by Component
8.1.1. Hardware
8.1.2. Software
8.1.3. Services
8.2. Analysis, Insights and Forecast - by Platform
8.2.1. Land
8.2.2. Airborne
8.2.3. Naval
8.2.4. Space
8.2.5. Unmanned Aerial Vehicles
8.2.6. Unmanned Ground Vehicles
8.3. Analysis, Insights and Forecast - by Application
8.3.1. ISR
8.3.2. Command & Control
8.3.3. Autonomous Systems
8.3.4. Predictive Maintenance
8.3.5. Cybersecurity
8.3.6. Simulation & Training
8.3.7. Logistics
8.4. Analysis, Insights and Forecast - by End User
8.4.1. Army
8.4.2. Navy
8.4.3. Air Force
8.4.4. Space Force
8.4.5. Defense Agencies
8.4.6. Government
8.5. Analysis, Insights and Forecast - by Deployment
8.5.1. On-Premises
8.5.2. Cloud-Managed
8.5.3. Hybrid
9. Military Edge Computing Market Report Latin America Analysis, Insights and Forecast, 2020-2034
9.1. Analysis, Insights and Forecast - by Component
9.1.1. Hardware
9.1.2. Software
9.1.3. Services
9.2. Analysis, Insights and Forecast - by Platform
9.2.1. Land
9.2.2. Airborne
9.2.3. Naval
9.2.4. Space
9.2.5. Unmanned Aerial Vehicles
9.2.6. Unmanned Ground Vehicles
9.3. Analysis, Insights and Forecast - by Application
9.3.1. ISR
9.3.2. Command & Control
9.3.3. Autonomous Systems
9.3.4. Predictive Maintenance
9.3.5. Cybersecurity
9.3.6. Simulation & Training
9.3.7. Logistics
9.4. Analysis, Insights and Forecast - by End User
9.4.1. Army
9.4.2. Navy
9.4.3. Air Force
9.4.4. Space Force
9.4.5. Defense Agencies
9.4.6. Government
9.5. Analysis, Insights and Forecast - by Deployment
9.5.1. On-Premises
9.5.2. Cloud-Managed
9.5.3. Hybrid
10. Military Edge Computing Market Report Middle East & Africa Analysis, Insights and Forecast, 2020-2034
10.1. Analysis, Insights and Forecast - by Component
10.1.1. Hardware
10.1.2. Software
10.1.3. Services
10.2. Analysis, Insights and Forecast - by Platform
10.2.1. Land
10.2.2. Airborne
10.2.3. Naval
10.2.4. Space
10.2.5. Unmanned Aerial Vehicles
10.2.6. Unmanned Ground Vehicles
10.3. Analysis, Insights and Forecast - by Application
10.3.1. ISR
10.3.2. Command & Control
10.3.3. Autonomous Systems
10.3.4. Predictive Maintenance
10.3.5. Cybersecurity
10.3.6. Simulation & Training
10.3.7. Logistics
10.4. Analysis, Insights and Forecast - by End User
10.4.1. Army
10.4.2. Navy
10.4.3. Air Force
10.4.4. Space Force
10.4.5. Defense Agencies
10.4.6. Government
10.5. Analysis, Insights and Forecast - by Deployment
10.5.1. On-Premises
10.5.2. Cloud-Managed
10.5.3. Hybrid
11. Military Edge Computing Market Report Competitive Analysis
11.1. Company Profiles
11.2. Market Entropy
11.2.1. Company's Key Areas Served
11.2.2. Recent Developments
11.3. Company Market Share Analysis, 2026
11.3.1. Top 5 Companies Market Share Analysis
11.3.2. Top 3 Companies Market Share Analysis
11.4. List of Potential Customers
12. Military Edge Computing Market Report Research Methodology
List of Figures
Figure 1: Military Edge Computing Market Report Revenue Breakdown (Billion, %) by Region 2026 & 2034
Figure 2: North America Military Edge Computing Market Report Revenue (Billion), by Component 2026 & 2034
Figure 3: North America Military Edge Computing Market Report Revenue Share (%), by Component 2026 & 2034
Figure 4: North America Military Edge Computing Market Report Revenue (Billion), by Platform 2026 & 2034
Figure 5: North America Military Edge Computing Market Report Revenue Share (%), by Platform 2026 & 2034
Figure 6: North America Military Edge Computing Market Report Revenue (Billion), by Application 2026 & 2034
Figure 7: North America Military Edge Computing Market Report Revenue Share (%), by Application 2026 & 2034
Figure 8: North America Military Edge Computing Market Report Revenue (Billion), by End User 2026 & 2034
Figure 9: North America Military Edge Computing Market Report Revenue Share (%), by End User 2026 & 2034
Figure 10: North America Military Edge Computing Market Report Revenue (Billion), by Deployment 2026 & 2034
Figure 11: North America Military Edge Computing Market Report Revenue Share (%), by Deployment 2026 & 2034
Figure 12: North America Military Edge Computing Market Report Revenue (Billion), by Country 2026 & 2034
Figure 13: North America Military Edge Computing Market Report Revenue Share (%), by Country 2026 & 2034
Figure 14: Europe Military Edge Computing Market Report Revenue (Billion), by Component 2026 & 2034
Figure 15: Europe Military Edge Computing Market Report Revenue Share (%), by Component 2026 & 2034
List of Tables
Table 1: Military Edge Computing Market Report Revenue Billion Forecast, by Component 2020 & 2034
Table 2: Military Edge Computing Market Report Revenue Billion Forecast, by Platform 2020 & 2034
Table 3: Military Edge Computing Market Report Revenue Billion Forecast, by Application 2020 & 2034
Table 4: Military Edge Computing Market Report Revenue Billion Forecast, by End User 2020 & 2034
Table 5: Military Edge Computing Market Report Revenue Billion Forecast, by Deployment 2020 & 2034
Table 6: Military Edge Computing Market Report Revenue Billion Forecast, by Region 2020 & 2034
Table 7: North America Military Edge Computing Market Report Revenue Billion Forecast, by Component 2020 & 2034
Table 8: North America Military Edge Computing Market Report Revenue Billion Forecast, by Platform 2020 & 2034
Table 9: North America Military Edge Computing Market Report Revenue Billion Forecast, by Application 2020 & 2034
Table 10: North America Military Edge Computing Market Report Revenue Billion Forecast, by End User 2020 & 2034
Table 11: North America Military Edge Computing Market Report Revenue Billion Forecast, by Deployment 2020 & 2034
Table 12: North America Military Edge Computing Market Report Revenue Billion Forecast, by Country 2020 & 2034
Table 13: USA Military Edge Computing Market Report Revenue (Billion) Forecast, by Application 2020 & 2034
Table 14: Canada Military Edge Computing Market Report Revenue (Billion) Forecast, by Application 2020 & 2034
Table 15: Mexico Military Edge Computing Market Report Revenue (Billion) Forecast, by Application 2020 & 2034
Frequently Asked Questions
1. How big is the military edge computing market in 2025?
The market is most defensibly sized at approximately USD 3.09 Billion in 2025, with competing estimates ranging from USD 2.1 Billion to USD 3.2 Billion depending on whether services and space-based edge computing are included.
2. What is the military edge computing market growth rate?
Published forecasts cluster around a 14.9% to 16.8% CAGR, with a consensus midpoint near 15.9% through 2035. This implies the market roughly quadruples in size over the forecast horizon.
3. Which region leads the military edge computing market?
North America leads with roughly 37–42% revenue share in 2025, driven by U.S. JADC2 and AI-at-the-edge funding. Asia-Pacific is the fastest-growing region, supported by autonomous systems and naval modernization programs.
4. Who are the key players in military edge computing?
Leading players include Lockheed Martin, Northrop Grumman, RTX, General Dynamics, BAE Systems, Thales, L3Harris, Curtiss-Wright and Mercury Systems, spanning defense primes and rugged-compute specialists.
5. What are the main military edge computing market segments?
The market segments by component, platform, application and end user. Hardware leads on revenue, land platforms dominate, and ISR is the largest application, while software and cybersecurity grow fastest.
Figure 16: Europe Military Edge Computing Market Report Revenue (Billion), by Platform 2026 & 2034
Figure 17: Europe Military Edge Computing Market Report Revenue Share (%), by Platform 2026 & 2034
Figure 18: Europe Military Edge Computing Market Report Revenue (Billion), by Application 2026 & 2034
Figure 19: Europe Military Edge Computing Market Report Revenue Share (%), by Application 2026 & 2034
Figure 20: Europe Military Edge Computing Market Report Revenue (Billion), by End User 2026 & 2034
Figure 21: Europe Military Edge Computing Market Report Revenue Share (%), by End User 2026 & 2034
Figure 22: Europe Military Edge Computing Market Report Revenue (Billion), by Deployment 2026 & 2034
Figure 23: Europe Military Edge Computing Market Report Revenue Share (%), by Deployment 2026 & 2034
Figure 24: Europe Military Edge Computing Market Report Revenue (Billion), by Country 2026 & 2034
Figure 25: Europe Military Edge Computing Market Report Revenue Share (%), by Country 2026 & 2034
Figure 26: Asia-Pacific Military Edge Computing Market Report Revenue (Billion), by Component 2026 & 2034
Figure 27: Asia-Pacific Military Edge Computing Market Report Revenue Share (%), by Component 2026 & 2034
Figure 28: Asia-Pacific Military Edge Computing Market Report Revenue (Billion), by Platform 2026 & 2034
Figure 29: Asia-Pacific Military Edge Computing Market Report Revenue Share (%), by Platform 2026 & 2034
Figure 30: Asia-Pacific Military Edge Computing Market Report Revenue (Billion), by Application 2026 & 2034
Figure 31: Asia-Pacific Military Edge Computing Market Report Revenue Share (%), by Application 2026 & 2034
Figure 32: Asia-Pacific Military Edge Computing Market Report Revenue (Billion), by End User 2026 & 2034
Figure 33: Asia-Pacific Military Edge Computing Market Report Revenue Share (%), by End User 2026 & 2034
Figure 34: Asia-Pacific Military Edge Computing Market Report Revenue (Billion), by Deployment 2026 & 2034
Figure 35: Asia-Pacific Military Edge Computing Market Report Revenue Share (%), by Deployment 2026 & 2034
Figure 36: Asia-Pacific Military Edge Computing Market Report Revenue (Billion), by Country 2026 & 2034
Figure 37: Asia-Pacific Military Edge Computing Market Report Revenue Share (%), by Country 2026 & 2034
Figure 38: Latin America Military Edge Computing Market Report Revenue (Billion), by Component 2026 & 2034
Figure 39: Latin America Military Edge Computing Market Report Revenue Share (%), by Component 2026 & 2034
Figure 40: Latin America Military Edge Computing Market Report Revenue (Billion), by Platform 2026 & 2034
Figure 41: Latin America Military Edge Computing Market Report Revenue Share (%), by Platform 2026 & 2034
Figure 42: Latin America Military Edge Computing Market Report Revenue (Billion), by Application 2026 & 2034
Figure 43: Latin America Military Edge Computing Market Report Revenue Share (%), by Application 2026 & 2034
Figure 44: Latin America Military Edge Computing Market Report Revenue (Billion), by End User 2026 & 2034
Figure 45: Latin America Military Edge Computing Market Report Revenue Share (%), by End User 2026 & 2034
Figure 46: Latin America Military Edge Computing Market Report Revenue (Billion), by Deployment 2026 & 2034
Figure 47: Latin America Military Edge Computing Market Report Revenue Share (%), by Deployment 2026 & 2034
Figure 48: Latin America Military Edge Computing Market Report Revenue (Billion), by Country 2026 & 2034
Figure 49: Latin America Military Edge Computing Market Report Revenue Share (%), by Country 2026 & 2034
Figure 50: Middle East & Africa Military Edge Computing Market Report Revenue (Billion), by Component 2026 & 2034
Figure 51: Middle East & Africa Military Edge Computing Market Report Revenue Share (%), by Component 2026 & 2034
Figure 52: Middle East & Africa Military Edge Computing Market Report Revenue (Billion), by Platform 2026 & 2034
Figure 53: Middle East & Africa Military Edge Computing Market Report Revenue Share (%), by Platform 2026 & 2034
Figure 54: Middle East & Africa Military Edge Computing Market Report Revenue (Billion), by Application 2026 & 2034
Figure 55: Middle East & Africa Military Edge Computing Market Report Revenue Share (%), by Application 2026 & 2034
Figure 56: Middle East & Africa Military Edge Computing Market Report Revenue (Billion), by End User 2026 & 2034
Figure 57: Middle East & Africa Military Edge Computing Market Report Revenue Share (%), by End User 2026 & 2034
Figure 58: Middle East & Africa Military Edge Computing Market Report Revenue (Billion), by Deployment 2026 & 2034
Figure 59: Middle East & Africa Military Edge Computing Market Report Revenue Share (%), by Deployment 2026 & 2034
Figure 60: Middle East & Africa Military Edge Computing Market Report Revenue (Billion), by Country 2026 & 2034
Figure 61: Middle East & Africa Military Edge Computing Market Report Revenue Share (%), by Country 2026 & 2034
Table 16: Europe Military Edge Computing Market Report Revenue Billion Forecast, by Component 2020 & 2034
Table 17: Europe Military Edge Computing Market Report Revenue Billion Forecast, by Platform 2020 & 2034
Table 18: Europe Military Edge Computing Market Report Revenue Billion Forecast, by Application 2020 & 2034
Table 19: Europe Military Edge Computing Market Report Revenue Billion Forecast, by End User 2020 & 2034
Table 20: Europe Military Edge Computing Market Report Revenue Billion Forecast, by Deployment 2020 & 2034
Table 21: Europe Military Edge Computing Market Report Revenue Billion Forecast, by Country 2020 & 2034
Table 22: Germany Military Edge Computing Market Report Revenue (Billion) Forecast, by Application 2020 & 2034
Table 23: UK Military Edge Computing Market Report Revenue (Billion) Forecast, by Application 2020 & 2034
Table 24: France Military Edge Computing Market Report Revenue (Billion) Forecast, by Application 2020 & 2034
Table 25: Italy Military Edge Computing Market Report Revenue (Billion) Forecast, by Application 2020 & 2034
Table 26: Poland Military Edge Computing Market Report Revenue (Billion) Forecast, by Application 2020 & 2034
Table 27: Asia-Pacific Military Edge Computing Market Report Revenue Billion Forecast, by Component 2020 & 2034
Table 28: Asia-Pacific Military Edge Computing Market Report Revenue Billion Forecast, by Platform 2020 & 2034
Table 29: Asia-Pacific Military Edge Computing Market Report Revenue Billion Forecast, by Application 2020 & 2034
Table 30: Asia-Pacific Military Edge Computing Market Report Revenue Billion Forecast, by End User 2020 & 2034
Table 31: Asia-Pacific Military Edge Computing Market Report Revenue Billion Forecast, by Deployment 2020 & 2034
Table 32: Asia-Pacific Military Edge Computing Market Report Revenue Billion Forecast, by Country 2020 & 2034
Table 33: China Military Edge Computing Market Report Revenue (Billion) Forecast, by Application 2020 & 2034
Table 34: Japan Military Edge Computing Market Report Revenue (Billion) Forecast, by Application 2020 & 2034
Table 35: India Military Edge Computing Market Report Revenue (Billion) Forecast, by Application 2020 & 2034
Table 36: South Korea Military Edge Computing Market Report Revenue (Billion) Forecast, by Application 2020 & 2034
Table 37: Australia Military Edge Computing Market Report Revenue (Billion) Forecast, by Application 2020 & 2034
Table 38: Latin America Military Edge Computing Market Report Revenue Billion Forecast, by Component 2020 & 2034
Table 39: Latin America Military Edge Computing Market Report Revenue Billion Forecast, by Platform 2020 & 2034
Table 40: Latin America Military Edge Computing Market Report Revenue Billion Forecast, by Application 2020 & 2034
Table 41: Latin America Military Edge Computing Market Report Revenue Billion Forecast, by End User 2020 & 2034
Table 42: Latin America Military Edge Computing Market Report Revenue Billion Forecast, by Deployment 2020 & 2034
Table 43: Latin America Military Edge Computing Market Report Revenue Billion Forecast, by Country 2020 & 2034
Table 44: Brazil Military Edge Computing Market Report Revenue (Billion) Forecast, by Application 2020 & 2034
Table 45: Argentina Military Edge Computing Market Report Revenue (Billion) Forecast, by Application 2020 & 2034
Table 46: Mexico Military Edge Computing Market Report Revenue (Billion) Forecast, by Application 2020 & 2034
Table 47: Middle East & Africa Military Edge Computing Market Report Revenue Billion Forecast, by Component 2020 & 2034
Table 48: Middle East & Africa Military Edge Computing Market Report Revenue Billion Forecast, by Platform 2020 & 2034
Table 49: Middle East & Africa Military Edge Computing Market Report Revenue Billion Forecast, by Application 2020 & 2034
Table 50: Middle East & Africa Military Edge Computing Market Report Revenue Billion Forecast, by End User 2020 & 2034
Table 51: Middle East & Africa Military Edge Computing Market Report Revenue Billion Forecast, by Deployment 2020 & 2034
Table 52: Middle East & Africa Military Edge Computing Market Report Revenue Billion Forecast, by Country 2020 & 2034
Table 53: Saudi Arabia Military Edge Computing Market Report Revenue (Billion) Forecast, by Application 2020 & 2034
Table 54: UAE Military Edge Computing Market Report Revenue (Billion) Forecast, by Application 2020 & 2034
Table 55: Israel Military Edge Computing Market Report Revenue (Billion) Forecast, by Application 2020 & 2034
Table 56: South Africa Military Edge Computing Market Report Revenue (Billion) Forecast, by Application 2020 & 2034