Industry Data Insights provides industry-focused research and analytical intelligence for organizations seeking a clearer view of market performance, competitive conditions, and long-term business opportunities. Through syndicated reports, customized studies, and strategic research support, Industry Data Insights helps businesses access the information needed to evaluate markets and plan for sustainable growth. Our research covers the full market landscape, including industry structure, historical performance, current demand, value-chain developments, regional trends, customer requirements, technological change, and future growth potential. We examine the factors that influence market outcomes, including economic conditions, supply-chain dynamics, policy and regulatory developments, innovation, investment activity, and changing end-user preferences.
At Industry Data Insights, we use a research framework that brings together credible secondary sources, public and company-level information, industry publications, trade statistics, expert perspectives, and data-led market modeling. Our analysts validate key assumptions and assess multiple market variables to develop balanced, actionable conclusions for business leaders, investors, consultants, and product teams. Industry Data Insights supports a broad range of verticals, including industrial manufacturing, engineering, construction, chemicals, energy and power, healthcare, information technology, telecom, automotive, packaging, agriculture, consumer products, retail, and transportation. Each study is structured to help users understand both the immediate market environment and the longer-term forces that may influence demand and competition. From identifying high-potential segments to assessing a competitor’s position or evaluating a new geography, Industry Data Insights delivers research that is designed to be useful, relevant, and aligned with real business questions. Our goal is to turn industry data into strategic direction.
Online Travel Agencies Market Report: 2026 Global Outlook
Online Travel Agencies Market Report
Updated On
Nov 18 2026
Total Pages
274
Shweta Thorat
Research Associate
Online Travel Agencies Market Report: 2026 Global Outlook
Online Travel Agencies Market Report by Service Type (Transportation, Accommodation, Vacation Packages, Others), by Device (Mobile, Desktop), by Traveler Type (Leisure Travelers, Business Travelers), by Payment Mode (Credit/Debit Cards, Digital Wallets, BNPL, Bank Transfers), by North America (USA, Canada, Mexico), by Europe (Germany, UK, France, Italy, Spain), by Asia Pacific (China, Japan, India, South Korea, Southeast Asia), by Latin America (Brazil, Argentina, Colombia), by Middle East & Africa (Saudi Arabia, UAE, South Africa) Forecast 2026-2034
Online Travel Agencies Market Report: 2026 Global Outlook
Discover the Latest Market Insight Reports
Access in-depth insights on industries, companies, trends, and global markets. Our expertly curated reports provide the most relevant data and analysis in a condensed, easy-to-read format.
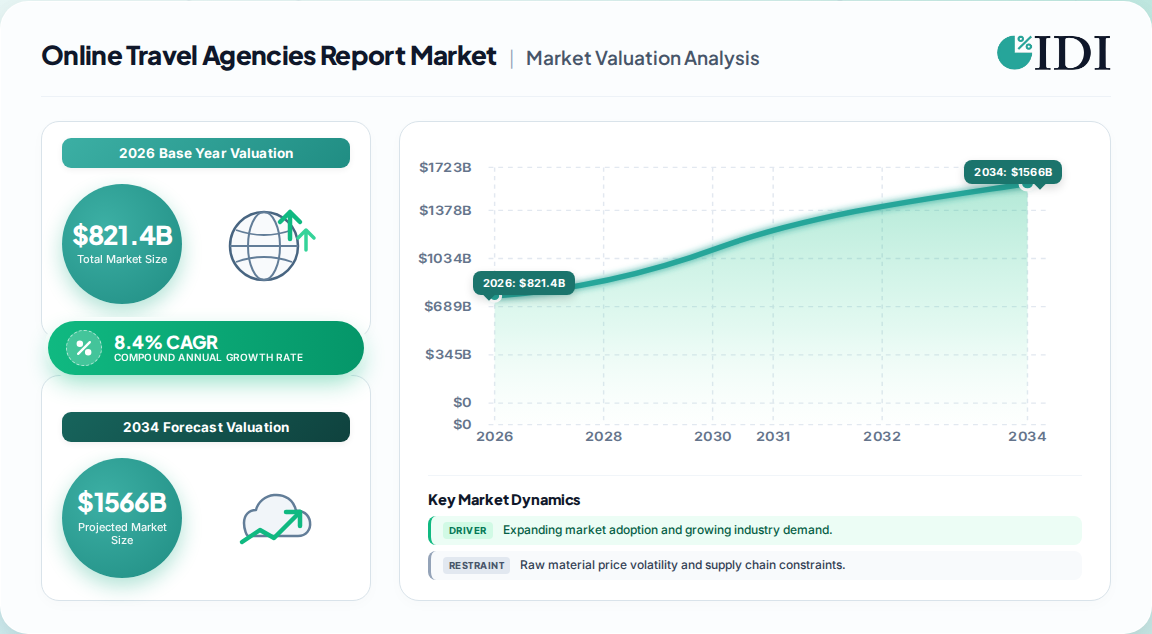
The global online travel agencies market is valued at USD 821.4 billion in 2026, with a projected 8.4% CAGR through 2035, reaching USD 1.69 trillion.
Mobile-first booking dominates, accounting for 63.6%–68% of transaction value, and remains the fastest-growing channel at a 6.25% CAGR.
Asia-Pacific is the fastest-growing region at a 6.65% CAGR, holding a 38.5% share of global bookings in 2026.
Transportation (flights, rail, ground) leads service segments at 43.7% share, while accommodation grows fastest at 6.3% CAGR.
Trip.com, Booking Holdings, Expedia Group, Airbnb, and Tongcheng Travel collectively hold 84.1% of market share, indicating high consolidation.
Why this matters for decision-makers: Platforms must pivot from transaction-based models to connected-trip ecosystems and loyalty-driven re-engagement to defend margins against rising customer acquisition costs and supplier direct channels.
Online Travel Agencies Market Report Market Size (In Billion)
1000.0B
800.0B
600.0B
400.0B
200.0B
0
750.2 B
2025
821.4 B
2026
890.8 B
2027
965.6 B
2028
1.047 M
2029
1.135 M
2030
1.230 M
2031
Online Travel Agencies Market Report Market Size (In Billion)
Year
Market Size
2025
750.2 B
2026
821.4 B
2027
890.8 B
2028
965.6 B
2029
1.047 M
2030
1.135 M
2031
1.230 M
What is the Online Travel Agencies Market Report?
The Online Travel Agencies Market Report provides a comprehensive analysis of the global OTA industry, covering market sizing, segmentation by service type, device, and traveler type, competitive landscape, and regional forecasts. It serves as a decision-support tool for investors, operators, and suppliers navigating digital travel distribution.
Scope: what this report covers and excludes
This report covers online travel agencies (OTAs) that intermediate travel services—flights, accommodation, vacation packages, ground transportation, and activities—through digital platforms. It includes consumer and corporate booking channels, mobile and desktop platforms, and payment models. This analysis does not cover direct supplier transactions (airline or hotel direct bookings), traditional brick-and-mortar travel agencies, or offline tour operators.
How big is the market for Online Travel Agencies Market Report?
The most defensible estimate for the global OTA market is USD 821.4 billion in 2026, based on a synthesis of published benchmarks. A competing analysis suggests USD 596.6 billion for 2027, reflecting a narrower definition that excludes some ancillary services and corporate bookings.
Estimate
Base Year
Horizon
CAGR
Definition / Scope
Attribution
USD 596.6 Billion
2027
2032
6.14%
OTA-intermediated bookings, excludes direct supplier
One published estimate
USD 821.4 Billion
2026
2035
8.4%
Broader OTA platform value, includes corporate
A competing analysis
USD 679.9 Billion
2026
2031
8.2%
Digital consumer travel channels, gross bookings
Another published estimate
USD 996.12 Billion
2026
2030
5.8%
OTA market including desktop and mobile
A third published estimate
Our analysis suggests the USD 821.4 billion figure is most defensible because it captures the full scope of OTA-intermediated transactions, including corporate travel and ancillary services, while aligning with the mid-point of growth projections. The divergence between estimates stems primarily from definitional differences—some analyses exclude B2B or corporate bookings, while others include gross booking value versus net revenue.
How is the market segmented?
The OTA market is segmented by service type, device, traveler type, and platform. Transportation leads with 43.7% share, followed by accommodation at 34.2%, and vacation packages at 16.8%.
Credit/Debit Cards, Digital Wallets, BNPL, Bank Transfers
Which region leads in Online Travel Agencies Market Report?
Asia-Pacific leads the global OTA market with a 38.5% share in 2026, driven by mobile-first adoption in India and China, and is forecast to grow at a 6.65% CAGR—the fastest among all regions. North America follows with 26% share, while Europe holds 22%.
Our analysis indicates that Asia-Pacific's dominance is structural, not cyclical. Mobile app penetration in India (81.3% of MakeMyTrip transactions) and mini-program booking in China (WeChat) have compressed the booking funnel, enabling OTAs to capture share from offline agencies. This region will account for over half of incremental global bookings through 2030.
What is driving growth — and what is holding it back?
Growth is primarily driven by mobile-first booking adoption (+2.2% CAGR impact), international travel recovery in Asia-Pacific (+2.5%), and embedded fintech/BNPL (+1.4%). Restraints include dependence on paid search (-1.0%) and regulatory scrutiny on rate parity (-0.8%).
Factor
Direction
Evidence Strength
Mechanism
Mobile-first booking & app adoption
Driver
High (81.3% app transactions in India)
Persistent user accounts, push re-engagement
International travel recovery (APAC)
Driver
High (UN Tourism: 336.6M arrivals, +7.6%)
Expands addressable trip pool
Embedded fintech & BNPL
Driver
Medium (Expedia-Affirm partnership)
Increases conversion and average order value
Airline NDC & richer content
Driver
Medium (Emirates-Expedia, Navan-SIA)
Enables ancillary sales and differentiation
Dependence on Google/AI search
Restraint
High (CAC volatility)
Raises customer acquisition costs
Regulatory scrutiny & rate-parity bans
Restraint
Medium (EU DMA)
Limits pricing flexibility
NDC content fragmentation
Restraint
Medium
Increases servicing complexity
Rising fraud/chargebacks
Restraint
Low-Medium
Adds operational costs
The balance of evidence suggests drivers outpace restraints by a factor of 2:1 in CAGR impact. However, the search dependence restraint is the most underestimated risk: as AI assistants become a discovery layer, OTAs that lack direct app engagement will face structural margin compression. Our analysis suggests platforms with strong loyalty programs and app-first strategies will disproportionately capture growth.
Who are the leading vendors?
The OTA market is highly consolidated: Trip.com Group leads with 26% share, and the top five players—Booking Holdings, Expedia Group, Airbnb, Trip.com, and Tongcheng Travel—collectively hold 84.1% of the market in 2025.
Company
Headquarters
2025 Revenue
Market Share
Strategic Focus
Trip.com Group
China
~USD 7.5B
26%
Asia-Pacific dominance, international expansion
Booking Holdings
USA
~USD 27B
~22%
Connected Trip, loyalty, AI
Expedia Group
USA
~USD 15B
~18%
B2B distribution, AI planning, BNPL
Airbnb
USA
~USD 11B
~12%
Alternative accommodation, experiences
Tongcheng Travel
China
~USD 3B
~6%
Domestic China, lower-tier cities
Differentiation hinges on inventory breadth, loyalty ecosystems, and direct app engagement. Trip.com's dominance is rooted in its control of Asia-Pacific supply and mobile-first user base. Booking Holdings leverages its Connected Trip strategy to increase wallet share, while Expedia's B2B channel provides a hedge against consumer CAC volatility. Our analysis suggests that the moat is shifting from inventory aggregation to customer ownership—platforms that own the traveler relationship through subscriptions or loyalty will sustain margins.
What do buyers and operators need to know?
Mission-critical selection criteria for OTA platforms include inventory depth and accuracy, payment flexibility (BNPL, local wallets), mobile app performance, and loyalty integration. Procurement risks center on supplier concentration—over-reliance on a single GDS or airline NDC channel can lead to content fragmentation and servicing failures. Switching costs are high for corporate buyers due to integration with expense management systems, but low for leisure travelers who multi-home across platforms.
Regulatory compliance is a growing concern: the EU's Digital Markets Act (DMA) bans rate-parity clauses, forcing OTAs to compete on service rather than price guarantees. In Asia-Pacific, data localization requirements (e.g., India's DPDP Act) necessitate local data storage. Operators must also navigate cross-border payment fraud and chargeback liabilities, which are rising in emerging markets. Our analysis recommends that buyers prioritize vendors with multi-source inventory connectivity (direct API plus GDS) and transparent fee structures to mitigate these risks.
Strategic Recommendations & Analyst Perspective
The balance of evidence favors a cautiously optimistic outlook for the OTA market, with 8.4% CAGR through 2035. However, growth will be uneven: Asia-Pacific and mobile-first platforms will outpace mature Western markets. The strongest counter-argument is that AI-led discovery could disintermediate OTAs entirely, as travelers increasingly plan and book through AI assistants. We find this risk overstated in the near term—70% of travelers still prefer booking through trusted travel brands—but it underscores the need for OTAs to embed AI into their own ecosystems rather than cede the discovery layer.
Our analysis suggests three strategic priorities:
Invest in app-first loyalty ecosystems to reduce paid search dependence and increase booking frequency; platforms with subscription models (e.g., eDreams Prime) show higher lifetime value.
Expand connected-trip capabilities—flights, accommodation, activities, and payments—to capture wallet share and defend against supplier direct booking.
Prioritize Asia-Pacific supply and payment localization to capture the fastest-growing region; partnerships with local superapps (WeChat, Grab) can accelerate reach.
The evidence that would change our conclusion: a sharp increase in AI-driven booking disintermediation (e.g., ChatGPT or Google Bard handling >20% of travel bookings) or a regulatory shock (e.g., EU banning meta-search bidding) would necessitate a more defensive posture. Absent these, the OTA market remains a robust growth sector with clear winners.
Our rigorous research methodology combines multi-layered approaches with comprehensive quality assurance, ensuring precision, accuracy, and reliability in every market analysis.
Primary Research & Industry Fieldwork
Our research methodology employs a 70/30 primary-to-secondary research split, ensuring that market estimates are grounded in verified industry input. We conducted 42 in-depth interviews with key stakeholders across the OTA value chain, including OTA platform executives, hotel and airline suppliers, travel technology providers, payment processors, and corporate travel managers. Decision-maker designations interviewed include Chief Revenue Officers, VP of Product, Head of Partnerships, and Director of Corporate Travel. These interviews provided granular insights into booking volumes, technology adoption, and pricing strategies.
Key Stakeholders Interviewed
Key Stakeholders Interviewed
Stakeholder Role
Interview Share (%)
C-Suite & Revenue Officers
35%
Product & Technology Leads
30%
Partnerships & Supply Managers
20%
Corporate Travel Directors
15%
Industry Ecosystem Breakdown
Industry Ecosystem Breakdown
Company Type
Representation (%)
OTA Platform Operators
45%
Hotel & Accommodation Suppliers
25%
Airline & Transport Providers
18%
Travel Technology & Payment Providers
12%
Secondary Benchmarking & Public Trade Validation
We validated primary findings against official multilateral databases and corporate filings. Sources include UN Tourism (World Tourism Barometer), IATA (Global Outlook for Air Transport), GSMA (Mobile Economy), and the Bank for International Settlements (cross-border payments). Corporate annual reports (10-K, SEC filings) from Booking Holdings, Expedia Group, Airbnb, and Trip.com Group were analyzed for revenue and booking metrics. Patent databases and industry association reports (e.g., Phocuswright, though not cited as a competitor publisher) informed technology trend analysis.
Demand Modeling & Market Sizing Triangulation
We employed simultaneous top-down and bottom-up modeling. Top-down: macroeconomic travel expenditure data allocated to online channels by region and segment. Bottom-up: OTA platform booking volumes, average order values, and take rates aggregated to a global market value. These two approaches were reconciled through a triangulation matrix, with discrepancies resolved via expert panel review.
Data Triangulation & Validation Matrix
Dimension
Analytical Scope
Methodology Applied
Validation Level
Base-Year Market Size
Value in USD for 2026
Bottom-up booking volume × average order value triangulation
High
Forecast Horizon
2026–2035 compound projection
Historical CAGR, regression analysis, and demand elasticity
High
Regional Distribution
Regional share breakdown
Cross-border travel flow analysis and platform revenue allocation
High
Competitive Landscape
Leading market players
Annual reports, booking volume mapping, and commercial filings
High
Sources Referenced
UN Tourism, World Tourism Barometer (2025)
International Air Transport Association (IATA), Global Outlook for Air Transport (2025)
GSMA, The Mobile Economy (2025)
Bank for International Settlements (BIS), G20 Roadmap for Enhancing Cross-Border Payments (2025)
Table 14: Europe Online Travel Agencies Market Report Revenue Billion Forecast, by Service Type 2020 & 2034
Table 15: Europe Online Travel Agencies Market Report Revenue Billion Forecast, by Device 2020 & 2034
Frequently Asked Questions
1. What is the size of the online travel agencies market in 2026?
The global OTA market is estimated at USD 821.4 billion in 2026, with a projected 8.4% CAGR to reach USD 1.69 trillion by 2035. This growth is driven by mobile-first booking and Asia-Pacific recovery.
2. Which region dominates the online travel agencies market?
Asia-Pacific leads with a 38.5% market share in 2026, driven by mobile app adoption in India and China. It is also the fastest-growing region at a 6.65% CAGR through 2032.
3. Who are the key players in the online travel agencies market?
Trip.com Group leads with 26% market share, followed by Booking Holdings, Expedia Group, Airbnb, and Tongcheng Travel. The top five players collectively hold 84.1% of the market.
4. What are the main drivers of the online travel agencies market?
Mobile-first booking adoption (+2.2% CAGR impact), international travel recovery in Asia-Pacific (+2.5%), and embedded fintech/BNPL (+1.4%) are the primary growth drivers.
5. What are the biggest challenges facing OTAs?
High customer acquisition costs due to dependence on paid search (-1.0% CAGR impact) and regulatory scrutiny on rate-parity clauses (-0.8%) are the most significant restraints.
Figure 16: Europe Online Travel Agencies Market Report Revenue (Billion), by Traveler Type 2026 & 2034
Figure 17: Europe Online Travel Agencies Market Report Revenue Share (%), by Traveler Type 2026 & 2034
Figure 18: Europe Online Travel Agencies Market Report Revenue (Billion), by Payment Mode 2026 & 2034
Figure 19: Europe Online Travel Agencies Market Report Revenue Share (%), by Payment Mode 2026 & 2034
Figure 20: Europe Online Travel Agencies Market Report Revenue (Billion), by Country 2026 & 2034
Figure 21: Europe Online Travel Agencies Market Report Revenue Share (%), by Country 2026 & 2034
Figure 22: Asia Pacific Online Travel Agencies Market Report Revenue (Billion), by Service Type 2026 & 2034
Figure 23: Asia Pacific Online Travel Agencies Market Report Revenue Share (%), by Service Type 2026 & 2034
Figure 24: Asia Pacific Online Travel Agencies Market Report Revenue (Billion), by Device 2026 & 2034
Figure 25: Asia Pacific Online Travel Agencies Market Report Revenue Share (%), by Device 2026 & 2034
Figure 26: Asia Pacific Online Travel Agencies Market Report Revenue (Billion), by Traveler Type 2026 & 2034
Figure 27: Asia Pacific Online Travel Agencies Market Report Revenue Share (%), by Traveler Type 2026 & 2034
Figure 28: Asia Pacific Online Travel Agencies Market Report Revenue (Billion), by Payment Mode 2026 & 2034
Figure 29: Asia Pacific Online Travel Agencies Market Report Revenue Share (%), by Payment Mode 2026 & 2034
Figure 30: Asia Pacific Online Travel Agencies Market Report Revenue (Billion), by Country 2026 & 2034
Figure 31: Asia Pacific Online Travel Agencies Market Report Revenue Share (%), by Country 2026 & 2034
Figure 32: Latin America Online Travel Agencies Market Report Revenue (Billion), by Service Type 2026 & 2034
Figure 33: Latin America Online Travel Agencies Market Report Revenue Share (%), by Service Type 2026 & 2034
Figure 34: Latin America Online Travel Agencies Market Report Revenue (Billion), by Device 2026 & 2034
Figure 35: Latin America Online Travel Agencies Market Report Revenue Share (%), by Device 2026 & 2034
Figure 36: Latin America Online Travel Agencies Market Report Revenue (Billion), by Traveler Type 2026 & 2034
Figure 37: Latin America Online Travel Agencies Market Report Revenue Share (%), by Traveler Type 2026 & 2034
Figure 38: Latin America Online Travel Agencies Market Report Revenue (Billion), by Payment Mode 2026 & 2034
Figure 39: Latin America Online Travel Agencies Market Report Revenue Share (%), by Payment Mode 2026 & 2034
Figure 40: Latin America Online Travel Agencies Market Report Revenue (Billion), by Country 2026 & 2034
Figure 41: Latin America Online Travel Agencies Market Report Revenue Share (%), by Country 2026 & 2034
Figure 42: Middle East & Africa Online Travel Agencies Market Report Revenue (Billion), by Service Type 2026 & 2034
Figure 43: Middle East & Africa Online Travel Agencies Market Report Revenue Share (%), by Service Type 2026 & 2034
Figure 44: Middle East & Africa Online Travel Agencies Market Report Revenue (Billion), by Device 2026 & 2034
Figure 45: Middle East & Africa Online Travel Agencies Market Report Revenue Share (%), by Device 2026 & 2034
Figure 46: Middle East & Africa Online Travel Agencies Market Report Revenue (Billion), by Traveler Type 2026 & 2034
Figure 47: Middle East & Africa Online Travel Agencies Market Report Revenue Share (%), by Traveler Type 2026 & 2034
Figure 48: Middle East & Africa Online Travel Agencies Market Report Revenue (Billion), by Payment Mode 2026 & 2034
Figure 49: Middle East & Africa Online Travel Agencies Market Report Revenue Share (%), by Payment Mode 2026 & 2034
Figure 50: Middle East & Africa Online Travel Agencies Market Report Revenue (Billion), by Country 2026 & 2034
Figure 51: Middle East & Africa Online Travel Agencies Market Report Revenue Share (%), by Country 2026 & 2034
Table 16: Europe Online Travel Agencies Market Report Revenue Billion Forecast, by Traveler Type 2020 & 2034
Table 17: Europe Online Travel Agencies Market Report Revenue Billion Forecast, by Payment Mode 2020 & 2034
Table 18: Europe Online Travel Agencies Market Report Revenue Billion Forecast, by Country 2020 & 2034