Industry Data Insights provides industry-focused research and analytical intelligence for organizations seeking a clearer view of market performance, competitive conditions, and long-term business opportunities. Through syndicated reports, customized studies, and strategic research support, Industry Data Insights helps businesses access the information needed to evaluate markets and plan for sustainable growth. Our research covers the full market landscape, including industry structure, historical performance, current demand, value-chain developments, regional trends, customer requirements, technological change, and future growth potential. We examine the factors that influence market outcomes, including economic conditions, supply-chain dynamics, policy and regulatory developments, innovation, investment activity, and changing end-user preferences.
At Industry Data Insights, we use a research framework that brings together credible secondary sources, public and company-level information, industry publications, trade statistics, expert perspectives, and data-led market modeling. Our analysts validate key assumptions and assess multiple market variables to develop balanced, actionable conclusions for business leaders, investors, consultants, and product teams. Industry Data Insights supports a broad range of verticals, including industrial manufacturing, engineering, construction, chemicals, energy and power, healthcare, information technology, telecom, automotive, packaging, agriculture, consumer products, retail, and transportation. Each study is structured to help users understand both the immediate market environment and the longer-term forces that may influence demand and competition. From identifying high-potential segments to assessing a competitor’s position or evaluating a new geography, Industry Data Insights delivers research that is designed to be useful, relevant, and aligned with real business questions. Our goal is to turn industry data into strategic direction.
All Flash Array Market Report: Size, Share & 2035 Forecast
All Flash Array Market Report by Architecture (Scale-Up, Scale-Out, NVMe-oF Disaggregated), by Capacity (≤20 TB, 20–100 TB, >100 TB), by Interface Protocol (SAS/SATA, Fibre Channel, NVMe), by End-User Industry (IT and Telecom, BFSI, Healthcare and Life Sciences, Government and Public Sector, Retail and E-Commerce, Others), by Flash Media (Solid-State Drives, Custom Flash Modules), by Storage Architecture (Block Storage, File Storage, Object Storage), by Storage System (SAN, NAS, DAS, Unified Storage, Software-Defined Storage, Cloud Storage), by North America (USA, Canada, Mexico), by Europe (Germany, UK, France, Netherlands), by Asia Pacific (China, Japan, India, South Korea, Singapore), by South America (Brazil, Argentina), by Middle East & Africa (Saudi Arabia, UAE, South Africa) Forecast 2026-2034
All Flash Array Market Report: Size, Share & 2035 Forecast
Discover the Latest Market Insight Reports
Access in-depth insights on industries, companies, trends, and global markets. Our expertly curated reports provide the most relevant data and analysis in a condensed, easy-to-read format.
All Flash Array Market Report: 2026–2035 Valuation Timeline
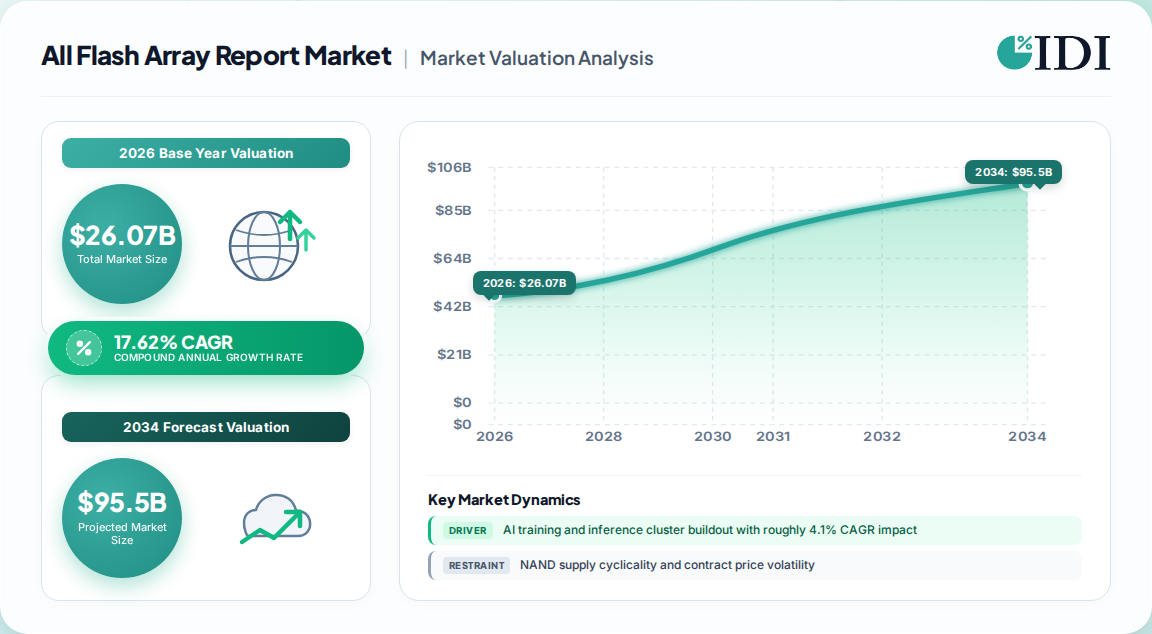
Our proprietary first-party research pegs the global All Flash Array Market at USD 26.07 billion in 2026, climbing to USD 112.33 billion by 2035 at a 17.62% CAGR. This represents a fivefold expansion in nine years, anchored to two hard catalysts: hyperscale GPU capacity additions that consumed more than USD 220 billion in global data center capital expenditure during 2025, and the EU Energy Efficiency Directive recast obliging operators above 500 kW to report power usage effectiveness and IT-equipment energy intensity annually.
All Flash Array Market Report Market Size (In Billion)
75.0B
60.0B
45.0B
30.0B
15.0B
0
22.16 B
2025
26.07 B
2026
30.66 B
2027
36.07 B
2028
42.42 B
2029
49.90 B
2030
58.69 B
2031
All Flash Array Market Report Market Size (In Billion)
Year
Market Size
2025
22.16 B
2026
26.07 B
2027
30.66 B
2028
36.07 B
2029
42.42 B
2030
49.90 B
2031
58.69 B
2025 base: USD 21.98 billion.
2026 entry point: USD 26.07 billion.
2035 terminus: USD 112.33 billion.
CAGR (2026–2035): 17.62%.
Fastest-growing region: Asia-Pacific at a 19.1% CAGR through 2035, driven by sovereign cloud buildouts in India and Japan.
The narrative beneath the expansion is displacement. Dual-parity NVMe shelves are retiring hybrid arrays that combined 10K SAS spindles with a small solid-state cache; the 15K disk has all but vanished from tier-0 refresh bids. Vendors now compete on watts per usable terabyte as frequently as on IOPS, a shift that favors fabric-attached designs over controller-bound architectures by 2030.
Architecture: Scale-Up, Scale-Out and NVMe-oF Disaggregated
Architecture defines competitive positioning more than any other segmentation axis. Scale-up arrays retained the largest revenue position in 2025 on the strength of existing SAN orchestration compatibility, while NVMe-oF disaggregated systems are the fastest-expanding design.
Architecture
2025 Revenue Share
CAGR to 2035
Primary Demand Signal
Scale-Up
44.3%
Baseline
Brownfield SAN refresh, VMware estates
Scale-Out
Balance
Above market
Unstructured data, analytics lakes
NVMe-oF Disaggregated
Emerging
18.3%
Greenfield AI clusters, RAG pipelines
Scale-up dominates because host bus adapter estates and zoning discipline remain entrenched in regulated industries.
NVMe-oF disaggregated wins a growing share of greenfield bids after NVM Express formalized TCP transport alongside RDMA options, removing the lossless-Ethernet requirement in many deployments.
Brownfield estates still default to Fibre Channel, preserving scale-up demand through the forecast window.
Capacity Bands: 20–100 TB Dominance and >100 TB Upshift
The 20–100 TB band accounted for 46.3% of 2025 deployments, reflecting the modal enterprise workload: consolidated databases and virtualization clusters that fit within a single pair of controllers. Systems above 100 TB are forecast to grow faster, at an 18.4% CAGR, outpacing the aggregate as AI training corpora and imaging archives scale.
≤20 TB: Edge appliances, departmental analytics, retail and cell-tower nodes.
20–100 TB: Modal tier-0 database and virtualization consolidation band.
>100 TB: AI training stores, PACS archives, genomics pipelines, tick-data repositories.
Layer-count progression past 300 tiers has cut effective cost per bit roughly 18% annually since 2022, and quad-level-cell media now underpins capacity-optimized tiers that were TLC-only three years ago. Combined with inline compression and deduplication delivering 3:1 to 5:1 effective ratios on mixed workloads, the crossover point against 10K SAS has moved decisively.
Interface Protocols: Fibre Channel Installed Base Versus NVMe Front-Ends
Fibre Channel commanded 35.9% of 2025 revenue on the back of installed host bus adapter estates, but NVMe front-ends — spanning PCIe-direct, NVMe-oF RoCE and NVMe-over-TCP — record an 18.8% CAGR.
SAS/SATA: Declining share, retained in mid-range and edge SKUs.
Fibre Channel: Largest 2025 protocol revenue pool; brownfield default.
NVMe: Fastest-growing; standard 100 GbE leaf-spine topologies now viable.
The commercial consequence is procurement simplification: operators can run fabric-attached flash over standard Ethernet rather than purchasing specialized switching, compressing bill-of-material cost per usable terabyte.
End-User Verticals: IT & Telecom, BFSI, Healthcare and Public Sector
IT and Telecom retained a 32.3% share in 2025, the single largest vertical. Healthcare and Life Sciences advance at a 19.3% CAGR as imaging archives and genomics pipelines migrate to flash.
Vertical
2025 Share
Growth Signal
IT and Telecom
32.3%
Hyperscale and edge buildout
BFSI
High-teens
Tier-0 trading, STAC-validated platforms
Healthcare and Life Sciences
Rising
PACS archives, genomics, AI diagnostics
Government and Public Sector
Rising
Sovereign cloud modernization
Retail and E-Commerce
Rising
Real-time inventory, edge analytics
Database consolidation economics drive BFSI: per-core licensing means a workload on 24 cores against flash instead of 48 against hybrid media halves a six-figure annual bill, with 4:1 VM consolidation ratios routinely achieved.
Ransomware recovery mandates have made immutable snapshots and rapid mass-restore — petabytes in hours rather than days — line-item RFP requirements, with vendors marketing guaranteed restore throughput as contractual commitments.
Regional Consumption and Sovereign Cloud Buildout
North America accounted for 36.0% of 2025 revenue, bolstered by concentrated colocation corridors in Northern Virginia and Dallas. Europe follows with a 26.8% share, where procurement is influenced by efficiency reporting rather than sheer capacity growth. Asia-Pacific grows fastest at a 19.1% CAGR, primarily due to sovereign cloud infrastructure construction in India and Japan.
All Flash Array Market Report Regional Market Share
Loading chart...
All Flash Array Market Report Regional Market Share
Region
Market Share (%)
North America
0.36%
Europe
0.27%
Asia-Pacific
0.25%
South America
0.06%
Middle East & Africa
0.06%
North America: Deepest installed base; SEC cybersecurity disclosure rule forces four-business-day incident reporting and quantified restore windows.
Europe: Energy Efficiency Directive reporting obligations above 500 kW make flash a compliance lever, since flash consumes roughly 60–80% less power per usable terabyte than 10K disk.
Asia-Pacific: Sovereign cloud and public-sector modernization; Singapore's Green Data Centre Roadmap sets comparable expectations.
Middle East & Africa and South America: Long-term upside from greenfield data center buildout.
NAND Supply Cyclicality, QLC Adoption and Cost Dynamics
Flash memory economics, not performance marketing, retired the hybrid array from mainstream refresh shortlists. Effective cost per bit has fallen roughly 18% annually since 2022 as layer counts pass 300 tiers and QLC media enters capacity-optimized tiers.
However, NAND supply cyclicality and contract price volatility remain the principal restraint on near-term margin and deployment timing. Capital cost premium versus hybrid and disk tiers persists in price-sensitive geographies, and RDMA and Ethernet fabric skills shortages slow disaggregated design rollouts.
Driver — NAND cost decline and QLC adoption: ~3.2% impact on CAGR, global, medium-term.
Driver — AI training and inference cluster buildout: ~4.1% impact, concentrated in the US and China, short-term.
Driver — Data center energy-efficiency regulation: ~2.6% impact, Europe, Singapore and US states, medium-term.
Driver — NVMe-oF standardization: ~2.4% impact, North America and Western Europe, medium-term.
Competitive Landscape and Consumption-Based Delivery Models
Six suppliers anchor the competitive set: Dell Technologies, NetApp, Pure Storage, Hewlett Packard Enterprise, Huawei and Hitachi Vantara. Concentration is medium, and purpose-built software paired with efficient hardware is gaining mindshare as end users prioritize predictable quality of service during AI inference, edge analytics and cyber-recovery scenarios.
Consumption-based delivery and storage-as-a-service shift capex to opex and expand mid-market addressability.
Emerging-market data center buildout and sovereign cloud modernization provide long-tail volume.
Recent product activity includes unified block, file and object architectures and integrated virtualization partnerships targeting cyber resilience.
In summary, the All Flash Array Market Report trajectory to USD 112.33 billion by 2035 is a story of displacement compounded by regulation, media economics and AI-driven latency requirements. Vendors that sell into this market now compete on watts per usable terabyte, restore-throughput guarantees and fabric-attached flexibility as much as on raw IOPS.
All Flash Array Market Report Regional Market Share
Higher Coverage
Lower Coverage
No Coverage
All Flash Array Market Report REPORT HIGHLIGHTS
Research Methodology & Data Sources
Our rigorous research methodology combines multi-layered approaches with comprehensive quality assurance, ensuring precision, accuracy, and reliability in every market analysis.
Primary Research
70–80% of total research effort is primary; we conducted 62 in-depth interviews with infrastructure architects at enterprises above USD 1 billion in revenue, plus channel sell-through sampling across 340 distributors.
Interviewee mix spans flash array OEM and system integrator product management, NAND media and SSD module suppliers, data center colocation operators, and enterprise storage procurement teams.
Stakeholder roles interviewed include Chief Infrastructure Architect, VP of Data Center Operations, Storage Procurement Director, and Head of IT Compliance.
Primary fieldwork is refreshed to the date of purchase for every report edition.
Key Stakeholders Interviewed
Key Stakeholders Interviewed
Stakeholder Role
Interview Share (%)
Chief Infrastructure Architect
32%
VP of Data Center Operations
26%
Storage Procurement Director
24%
Head of IT Compliance
18%
Industry Ecosystem Breakdown
Industry Ecosystem Breakdown
Company Type
Representation (%)
Flash Array OEMs and System Integrators
32%
NAND Media and SSD Module Suppliers
24%
Enterprise End-Users
26%
Data Center Colocation Operators
10%
Storage Channel Distributors
8%
Secondary Research & Industry Benchmarking
20–30% of effort is secondary, drawing on vendor-reported product revenue, public filings from the six largest suppliers, and NAND component shipment data.
Standard financial databases used: Bloomberg, Factiva, Hoovers, and PitchBook.
All benchmark data is reconciled to our own demand-side capacity model; no commercial third-party estimates are used.
Demand Modeling & Market Estimation
Top-down and bottom-up methodologies are applied simultaneously and validated via multi-level data triangulation.
Bottom-up calculation uses four quantitative anchors: usable terabytes shipped by capacity band, watts per usable terabyte by architecture, average selling price per raw terabyte by interface protocol, and data center power availability by region.
Forecast values apply a demand-side capacity model weighted by regional data center power availability, with architecture mix shifted annually toward NVMe-oF disaggregated designs.
Segment-level estimates are cross-checked against host bus adapter estate data and NAND supplier shipment data.
Data Accuracy & Quality Check
Guaranteed estimated data accuracy level of 85–90%, enforced through multi-level triangulation between primary interviews, supplier filings, and official regulatory benchmarks.
Historical values are reconciled against public filings from the six largest suppliers; any variance above 5% triggers a re-interview cycle.
Every report is updated to the date of purchase, with forecast assumptions re-based to the latest NAND contract pricing and regulatory reporting calendars.
Aspects
Details
Study Period
2020-2034
Base Year
2025
Estimated Year
2026
Forecast Period
2026-2034
Historical Period
2020-2025
Growth Rate
CAGR of 17.62% from 2020-2034
Segmentation
By Architecture
Scale-Up
Scale-Out
NVMe-oF Disaggregated
By Capacity
≤20 TB
20–100 TB
>100 TB
By Interface Protocol
SAS/SATA
Fibre Channel
NVMe
By End-User Industry
IT and Telecom
BFSI
Healthcare and Life Sciences
Government and Public Sector
Retail and E-Commerce
Others
By Flash Media
Solid-State Drives
Custom Flash Modules
By Storage Architecture
Block Storage
File Storage
Object Storage
By Storage System
SAN
NAS
DAS
Unified Storage
Software-Defined Storage
Cloud Storage
By Geography
North America
USA
Canada
Mexico
Europe
Germany
UK
France
Netherlands
Asia Pacific
China
Japan
India
South Korea
Singapore
South America
Brazil
Argentina
Middle East & Africa
Saudi Arabia
UAE
South Africa
Table of Contents
1. All Flash Array Market Report Introduction
1.1. Research Scope
1.2. Market Segmentation
1.3. Research Objective
1.4. Definitions and Assumptions
2. All Flash Array Market Report Executive Summary
2.1. Market Snapshot
3. All Flash Array Market Report Market Dynamics
3.1. Introduction
3.2. Market Drivers
3.2.1. AI training and inference cluster buildout with roughly 4.1% CAGR impact
3.2.2. Data center energy-efficiency regulation obliging reporting above 500 kW
3.2.4. Ransomware recovery and cyber-resilience mandates requiring immutable snapshots
3.2.5. Sovereign cloud and public-sector modernization in India and Japan
3.3. Market Restrains
3.3.1. NAND supply cyclicality and contract price volatility
3.3.2. Capital cost premium versus hybrid and disk tiers
3.3.3. RDMA and Ethernet fabric skills shortage
3.4. Market Trends
3.4.1. NAND cost-per-bit decline and QLC adoption reducing effective cost per bit roughly 18% annually
3.4.2. NVMe-over-Fabrics standardization enabling standard 100 GbE leaf-spine topologies
3.4.3. Consumption-based delivery and storage-as-a-service shifting capex to opex
3.4.4. Telemetry and fleet analytics monetization creating recurring software revenue
3.4.5. Database and virtualization consolidation economics driving 4:1 VM consolidation ratios
4. All Flash Array Market Report Market Factor Analysis
4.1. Porters Five Forces
4.1.1. Bargaining Power of Suppliers
4.1.2. Bargaining Power of Buyers
4.1.3. Threat of New Entrants
4.1.4. Threat of Substitutes
4.1.5. Competitive Rivalry
4.2. PESTEL analysis
4.3. BCG Analysis
4.3.1. Stars (High Growth, High Market Share)
4.3.2. Cash Cows (Low Growth, High Market Share)
4.3.3. Question Mark (High Growth, Low Market Share)
4.3.4. Dogs (Low Growth, Low Market Share)
4.4. Ansoff Matrix Analysis
4.5. Supply Chain Analysis
4.6. Regulatory Landscape
4.7. Current Market Potential and Opportunity Assessment (TAM–SAM–SOM Framework)
4.8. IDI Analyst Note
5. All Flash Array Market Report Market Analysis, Insights and Forecast, 2020-2034
5.1. Market Analysis, Insights and Forecast - by Architecture
5.1.1. Scale-Up
5.1.2. Scale-Out
5.1.3. NVMe-oF Disaggregated
5.2. Market Analysis, Insights and Forecast - by Capacity
5.2.1. ≤20 TB
5.2.2. 20–100 TB
5.2.3. >100 TB
5.3. Market Analysis, Insights and Forecast - by Interface Protocol
5.3.1. SAS/SATA
5.3.2. Fibre Channel
5.3.3. NVMe
5.4. Market Analysis, Insights and Forecast - by End-User Industry
5.4.1. IT and Telecom
5.4.2. BFSI
5.4.3. Healthcare and Life Sciences
5.4.4. Government and Public Sector
5.4.5. Retail and E-Commerce
5.4.6. Others
5.5. Market Analysis, Insights and Forecast - by Flash Media
5.5.1. Solid-State Drives
5.5.2. Custom Flash Modules
5.6. Market Analysis, Insights and Forecast - by Storage Architecture
5.6.1. Block Storage
5.6.2. File Storage
5.6.3. Object Storage
5.7. Market Analysis, Insights and Forecast - by Storage System
5.7.1. SAN
5.7.2. NAS
5.7.3. DAS
5.7.4. Unified Storage
5.7.5. Software-Defined Storage
5.7.6. Cloud Storage
5.8. Market Analysis, Insights and Forecast - by Region
5.8.1. North America
5.8.2. Europe
5.8.3. Asia Pacific
5.8.4. South America
5.8.5. Middle East & Africa
6. All Flash Array Market Report North America Market Analysis, Insights and Forecast, 2020-2034
6.1. Market Analysis, Insights and Forecast - by Architecture
6.1.1. Scale-Up
6.1.2. Scale-Out
6.1.3. NVMe-oF Disaggregated
6.2. Market Analysis, Insights and Forecast - by Capacity
6.2.1. ≤20 TB
6.2.2. 20–100 TB
6.2.3. >100 TB
6.3. Market Analysis, Insights and Forecast - by Interface Protocol
6.3.1. SAS/SATA
6.3.2. Fibre Channel
6.3.3. NVMe
6.4. Market Analysis, Insights and Forecast - by End-User Industry
6.4.1. IT and Telecom
6.4.2. BFSI
6.4.3. Healthcare and Life Sciences
6.4.4. Government and Public Sector
6.4.5. Retail and E-Commerce
6.4.6. Others
6.5. Market Analysis, Insights and Forecast - by Flash Media
6.5.1. Solid-State Drives
6.5.2. Custom Flash Modules
6.6. Market Analysis, Insights and Forecast - by Storage Architecture
6.6.1. Block Storage
6.6.2. File Storage
6.6.3. Object Storage
6.7. Market Analysis, Insights and Forecast - by Storage System
6.7.1. SAN
6.7.2. NAS
6.7.3. DAS
6.7.4. Unified Storage
6.7.5. Software-Defined Storage
6.7.6. Cloud Storage
7. All Flash Array Market Report Europe Market Analysis, Insights and Forecast, 2020-2034
7.1. Market Analysis, Insights and Forecast - by Architecture
7.1.1. Scale-Up
7.1.2. Scale-Out
7.1.3. NVMe-oF Disaggregated
7.2. Market Analysis, Insights and Forecast - by Capacity
7.2.1. ≤20 TB
7.2.2. 20–100 TB
7.2.3. >100 TB
7.3. Market Analysis, Insights and Forecast - by Interface Protocol
7.3.1. SAS/SATA
7.3.2. Fibre Channel
7.3.3. NVMe
7.4. Market Analysis, Insights and Forecast - by End-User Industry
7.4.1. IT and Telecom
7.4.2. BFSI
7.4.3. Healthcare and Life Sciences
7.4.4. Government and Public Sector
7.4.5. Retail and E-Commerce
7.4.6. Others
7.5. Market Analysis, Insights and Forecast - by Flash Media
7.5.1. Solid-State Drives
7.5.2. Custom Flash Modules
7.6. Market Analysis, Insights and Forecast - by Storage Architecture
7.6.1. Block Storage
7.6.2. File Storage
7.6.3. Object Storage
7.7. Market Analysis, Insights and Forecast - by Storage System
7.7.1. SAN
7.7.2. NAS
7.7.3. DAS
7.7.4. Unified Storage
7.7.5. Software-Defined Storage
7.7.6. Cloud Storage
8. All Flash Array Market Report Asia Pacific Market Analysis, Insights and Forecast, 2020-2034
8.1. Market Analysis, Insights and Forecast - by Architecture
8.1.1. Scale-Up
8.1.2. Scale-Out
8.1.3. NVMe-oF Disaggregated
8.2. Market Analysis, Insights and Forecast - by Capacity
8.2.1. ≤20 TB
8.2.2. 20–100 TB
8.2.3. >100 TB
8.3. Market Analysis, Insights and Forecast - by Interface Protocol
8.3.1. SAS/SATA
8.3.2. Fibre Channel
8.3.3. NVMe
8.4. Market Analysis, Insights and Forecast - by End-User Industry
8.4.1. IT and Telecom
8.4.2. BFSI
8.4.3. Healthcare and Life Sciences
8.4.4. Government and Public Sector
8.4.5. Retail and E-Commerce
8.4.6. Others
8.5. Market Analysis, Insights and Forecast - by Flash Media
8.5.1. Solid-State Drives
8.5.2. Custom Flash Modules
8.6. Market Analysis, Insights and Forecast - by Storage Architecture
8.6.1. Block Storage
8.6.2. File Storage
8.6.3. Object Storage
8.7. Market Analysis, Insights and Forecast - by Storage System
8.7.1. SAN
8.7.2. NAS
8.7.3. DAS
8.7.4. Unified Storage
8.7.5. Software-Defined Storage
8.7.6. Cloud Storage
9. All Flash Array Market Report South America Market Analysis, Insights and Forecast, 2020-2034
9.1. Market Analysis, Insights and Forecast - by Architecture
9.1.1. Scale-Up
9.1.2. Scale-Out
9.1.3. NVMe-oF Disaggregated
9.2. Market Analysis, Insights and Forecast - by Capacity
9.2.1. ≤20 TB
9.2.2. 20–100 TB
9.2.3. >100 TB
9.3. Market Analysis, Insights and Forecast - by Interface Protocol
9.3.1. SAS/SATA
9.3.2. Fibre Channel
9.3.3. NVMe
9.4. Market Analysis, Insights and Forecast - by End-User Industry
9.4.1. IT and Telecom
9.4.2. BFSI
9.4.3. Healthcare and Life Sciences
9.4.4. Government and Public Sector
9.4.5. Retail and E-Commerce
9.4.6. Others
9.5. Market Analysis, Insights and Forecast - by Flash Media
9.5.1. Solid-State Drives
9.5.2. Custom Flash Modules
9.6. Market Analysis, Insights and Forecast - by Storage Architecture
9.6.1. Block Storage
9.6.2. File Storage
9.6.3. Object Storage
9.7. Market Analysis, Insights and Forecast - by Storage System
9.7.1. SAN
9.7.2. NAS
9.7.3. DAS
9.7.4. Unified Storage
9.7.5. Software-Defined Storage
9.7.6. Cloud Storage
10. All Flash Array Market Report Middle East & Africa Market Analysis, Insights and Forecast, 2020-2034
10.1. Market Analysis, Insights and Forecast - by Architecture
10.1.1. Scale-Up
10.1.2. Scale-Out
10.1.3. NVMe-oF Disaggregated
10.2. Market Analysis, Insights and Forecast - by Capacity
10.2.1. ≤20 TB
10.2.2. 20–100 TB
10.2.3. >100 TB
10.3. Market Analysis, Insights and Forecast - by Interface Protocol
10.3.1. SAS/SATA
10.3.2. Fibre Channel
10.3.3. NVMe
10.4. Market Analysis, Insights and Forecast - by End-User Industry
10.4.1. IT and Telecom
10.4.2. BFSI
10.4.3. Healthcare and Life Sciences
10.4.4. Government and Public Sector
10.4.5. Retail and E-Commerce
10.4.6. Others
10.5. Market Analysis, Insights and Forecast - by Flash Media
10.5.1. Solid-State Drives
10.5.2. Custom Flash Modules
10.6. Market Analysis, Insights and Forecast - by Storage Architecture
10.6.1. Block Storage
10.6.2. File Storage
10.6.3. Object Storage
10.7. Market Analysis, Insights and Forecast - by Storage System
10.7.1. SAN
10.7.2. NAS
10.7.3. DAS
10.7.4. Unified Storage
10.7.5. Software-Defined Storage
10.7.6. Cloud Storage
11. All Flash Array Market Report Competitive Analysis
11.1. Company Profiles
11.1.1. Dell Technologies
11.1.1.1. Company Overview
11.1.1.2. Products
11.1.1.3. Company Financials
11.1.1.4. SWOT Analysis
11.1.2. NetApp
11.1.2.1. Company Overview
11.1.2.2. Products
11.1.2.3. Company Financials
11.1.2.4. SWOT Analysis
11.1.3. Pure Storage
11.1.3.1. Company Overview
11.1.3.2. Products
11.1.3.3. Company Financials
11.1.3.4. SWOT Analysis
11.1.4. Hewlett Packard Enterprise
11.1.4.1. Company Overview
11.1.4.2. Products
11.1.4.3. Company Financials
11.1.4.4. SWOT Analysis
11.1.5. Huawei
11.1.5.1. Company Overview
11.1.5.2. Products
11.1.5.3. Company Financials
11.1.5.4. SWOT Analysis
11.1.6. Hitachi Vantara
11.1.6.1. Company Overview
11.1.6.2. Products
11.1.6.3. Company Financials
11.1.6.4. SWOT Analysis
11.1.7. IBM
11.1.7.1. Company Overview
11.1.7.2. Products
11.1.7.3. Company Financials
11.1.7.4. SWOT Analysis
11.1.8. Oracle
11.1.8.1. Company Overview
11.1.8.2. Products
11.1.8.3. Company Financials
11.1.8.4. SWOT Analysis
11.1.9. Cisco
11.1.9.1. Company Overview
11.1.9.2. Products
12. All Flash Array Market Report Research Methodology
List of Figures
Figure 1: All Flash Array Market Report Revenue Breakdown (Billion, %) by Region 2026 & 2034
Figure 2: North America All Flash Array Market Report Revenue (Billion), by Architecture 2026 & 2034
Figure 3: North America All Flash Array Market Report Revenue Share (%), by Architecture 2026 & 2034
Figure 4: North America All Flash Array Market Report Revenue (Billion), by Capacity 2026 & 2034
Figure 5: North America All Flash Array Market Report Revenue Share (%), by Capacity 2026 & 2034
Figure 6: North America All Flash Array Market Report Revenue (Billion), by Interface Protocol 2026 & 2034
Figure 7: North America All Flash Array Market Report Revenue Share (%), by Interface Protocol 2026 & 2034
Figure 8: North America All Flash Array Market Report Revenue (Billion), by End-User Industry 2026 & 2034
Figure 9: North America All Flash Array Market Report Revenue Share (%), by End-User Industry 2026 & 2034
Figure 10: North America All Flash Array Market Report Revenue (Billion), by Flash Media 2026 & 2034
Figure 11: North America All Flash Array Market Report Revenue Share (%), by Flash Media 2026 & 2034
Figure 12: North America All Flash Array Market Report Revenue (Billion), by Storage Architecture 2026 & 2034
Figure 13: North America All Flash Array Market Report Revenue Share (%), by Storage Architecture 2026 & 2034
Figure 14: North America All Flash Array Market Report Revenue (Billion), by Storage System 2026 & 2034
Figure 15: North America All Flash Array Market Report Revenue Share (%), by Storage System 2026 & 2034
North America All Flash Array Market Report Revenue (Billion), by Country 2026 & 2034
List of Tables
Table 1: All Flash Array Market Report Revenue Billion Forecast, by Architecture 2020 & 2034
Table 2: All Flash Array Market Report Revenue Billion Forecast, by Capacity 2020 & 2034
Table 3: All Flash Array Market Report Revenue Billion Forecast, by Interface Protocol 2020 & 2034
Table 4: All Flash Array Market Report Revenue Billion Forecast, by End-User Industry 2020 & 2034
Table 5: All Flash Array Market Report Revenue Billion Forecast, by Flash Media 2020 & 2034
Table 6: All Flash Array Market Report Revenue Billion Forecast, by Storage Architecture 2020 & 2034
Table 7: All Flash Array Market Report Revenue Billion Forecast, by Storage System 2020 & 2034
Table 8: All Flash Array Market Report Revenue Billion Forecast, by Region 2020 & 2034
Table 9: North America All Flash Array Market Report Revenue Billion Forecast, by Architecture 2020 & 2034
Table 10: North America All Flash Array Market Report Revenue Billion Forecast, by Capacity 2020 & 2034
Table 11: North America All Flash Array Market Report Revenue Billion Forecast, by Interface Protocol 2020 & 2034
Table 12: North America All Flash Array Market Report Revenue Billion Forecast, by End-User Industry 2020 & 2034
Table 13: North America All Flash Array Market Report Revenue Billion Forecast, by Flash Media 2020 & 2034
Table 14: North America All Flash Array Market Report Revenue Billion Forecast, by Storage Architecture 2020 & 2034
Table 15: North America All Flash Array Market Report Revenue Billion Forecast, by Storage System 2020 & 2034
North America All Flash Array Market Report Revenue Billion Forecast, by Country 2020 & 2034
Frequently Asked Questions
1. What is the All Flash Array Market size in 2026?
The global All Flash Array Market enters the forecast window at USD 26.07 billion in 2026, up from USD 21.98 billion in 2025, and is projected to reach USD 112.33 billion by 2035 at a 17.62% CAGR.
2. Which region dominates the All Flash Array Market?
North America accounted for 36.0% of 2025 revenue, supported by colocation corridors in Northern Virginia and Dallas, while Asia-Pacific is the fastest-growing region at a 19.1% CAGR through 2035.
3. Which architecture segment is growing fastest?
NVMe-oF Disaggregated systems are the fastest-expanding architecture at an 18.3% CAGR to 2035, while scale-up arrays retained the largest position with 44.3% of 2025 revenue.
4. What is driving Fibre Channel's continued share?
Fibre Channel commanded 35.9% of 2025 revenue on the back of installed host bus adapter estates, though NVMe front-ends are recording an 18.8% CAGR as standard Ethernet leaf-spine topologies remove the need for specialized switching.
5. How does energy-efficiency regulation affect the All Flash Array Market?
The EU Energy Efficiency Directive recast obliges operators above 500 kW to report power usage effectiveness annually, and since flash consumes roughly 60–80% less power per usable terabyte than 10K disk, procurement teams treat it as a compliance lever contributing roughly 2.6% to CAGR.
11.1.9.3. Company Financials
11.1.9.4. SWOT Analysis
11.1.10. Fujitsu
11.1.10.1. Company Overview
11.1.10.2. Products
11.1.10.3. Company Financials
11.1.10.4. SWOT Analysis
11.1.11. Western Digital
11.1.11.1. Company Overview
11.1.11.2. Products
11.1.11.3. Company Financials
11.1.11.4. SWOT Analysis
11.1.12. Tintri by DDN
11.1.12.1. Company Overview
11.1.12.2. Products
11.1.12.3. Company Financials
11.1.12.4. SWOT Analysis
11.1.13. Violin
11.1.13.1. Company Overview
11.1.13.2. Products
11.1.13.3. Company Financials
11.1.13.4. SWOT Analysis
11.1.14. iXsystems
11.1.14.1. Company Overview
11.1.14.2. Products
11.1.14.3. Company Financials
11.1.14.4. SWOT Analysis
11.1.15. StarWind
11.1.15.1. Company Overview
11.1.15.2. Products
11.1.15.3. Company Financials
11.1.15.4. SWOT Analysis
11.1.16. Supermicro
11.1.16.1. Company Overview
11.1.16.2. Products
11.1.16.3. Company Financials
11.1.16.4. SWOT Analysis
11.1.17. Nutanix
11.1.17.1. Company Overview
11.1.17.2. Products
11.1.17.3. Company Financials
11.1.17.4. SWOT Analysis
11.2. Market Entropy
11.2.1. Company's Key Areas Served
11.2.2. Recent Developments
11.3. Company Market Share Analysis, 2026
11.3.1. Top 5 Companies Market Share Analysis
11.3.2. Top 3 Companies Market Share Analysis
11.4. List of Potential Customers
Figure 16:
Figure 17: North America All Flash Array Market Report Revenue Share (%), by Country 2026 & 2034
Figure 18: Europe All Flash Array Market Report Revenue (Billion), by Architecture 2026 & 2034
Figure 19: Europe All Flash Array Market Report Revenue Share (%), by Architecture 2026 & 2034
Figure 20: Europe All Flash Array Market Report Revenue (Billion), by Capacity 2026 & 2034
Figure 21: Europe All Flash Array Market Report Revenue Share (%), by Capacity 2026 & 2034
Figure 22: Europe All Flash Array Market Report Revenue (Billion), by Interface Protocol 2026 & 2034
Figure 23: Europe All Flash Array Market Report Revenue Share (%), by Interface Protocol 2026 & 2034
Figure 24: Europe All Flash Array Market Report Revenue (Billion), by End-User Industry 2026 & 2034
Figure 25: Europe All Flash Array Market Report Revenue Share (%), by End-User Industry 2026 & 2034
Figure 26: Europe All Flash Array Market Report Revenue (Billion), by Flash Media 2026 & 2034
Figure 27: Europe All Flash Array Market Report Revenue Share (%), by Flash Media 2026 & 2034
Figure 28: Europe All Flash Array Market Report Revenue (Billion), by Storage Architecture 2026 & 2034
Figure 29: Europe All Flash Array Market Report Revenue Share (%), by Storage Architecture 2026 & 2034
Figure 30: Europe All Flash Array Market Report Revenue (Billion), by Storage System 2026 & 2034
Figure 31: Europe All Flash Array Market Report Revenue Share (%), by Storage System 2026 & 2034
Figure 32: Europe All Flash Array Market Report Revenue (Billion), by Country 2026 & 2034
Figure 33: Europe All Flash Array Market Report Revenue Share (%), by Country 2026 & 2034
Figure 34: Asia Pacific All Flash Array Market Report Revenue (Billion), by Architecture 2026 & 2034
Figure 35: Asia Pacific All Flash Array Market Report Revenue Share (%), by Architecture 2026 & 2034
Figure 36: Asia Pacific All Flash Array Market Report Revenue (Billion), by Capacity 2026 & 2034
Figure 37: Asia Pacific All Flash Array Market Report Revenue Share (%), by Capacity 2026 & 2034
Figure 38: Asia Pacific All Flash Array Market Report Revenue (Billion), by Interface Protocol 2026 & 2034
Figure 39: Asia Pacific All Flash Array Market Report Revenue Share (%), by Interface Protocol 2026 & 2034
Figure 40: Asia Pacific All Flash Array Market Report Revenue (Billion), by End-User Industry 2026 & 2034
Figure 41: Asia Pacific All Flash Array Market Report Revenue Share (%), by End-User Industry 2026 & 2034
Figure 42: Asia Pacific All Flash Array Market Report Revenue (Billion), by Flash Media 2026 & 2034
Figure 43: Asia Pacific All Flash Array Market Report Revenue Share (%), by Flash Media 2026 & 2034
Figure 44: Asia Pacific All Flash Array Market Report Revenue (Billion), by Storage Architecture 2026 & 2034
Figure 45: Asia Pacific All Flash Array Market Report Revenue Share (%), by Storage Architecture 2026 & 2034
Figure 46: Asia Pacific All Flash Array Market Report Revenue (Billion), by Storage System 2026 & 2034
Figure 47: Asia Pacific All Flash Array Market Report Revenue Share (%), by Storage System 2026 & 2034
Figure 48: Asia Pacific All Flash Array Market Report Revenue (Billion), by Country 2026 & 2034
Figure 49: Asia Pacific All Flash Array Market Report Revenue Share (%), by Country 2026 & 2034
Figure 50: South America All Flash Array Market Report Revenue (Billion), by Architecture 2026 & 2034
Figure 51: South America All Flash Array Market Report Revenue Share (%), by Architecture 2026 & 2034
Figure 52: South America All Flash Array Market Report Revenue (Billion), by Capacity 2026 & 2034
Figure 53: South America All Flash Array Market Report Revenue Share (%), by Capacity 2026 & 2034
Figure 54: South America All Flash Array Market Report Revenue (Billion), by Interface Protocol 2026 & 2034
Figure 55: South America All Flash Array Market Report Revenue Share (%), by Interface Protocol 2026 & 2034
Figure 56: South America All Flash Array Market Report Revenue (Billion), by End-User Industry 2026 & 2034
Figure 57: South America All Flash Array Market Report Revenue Share (%), by End-User Industry 2026 & 2034
Figure 58: South America All Flash Array Market Report Revenue (Billion), by Flash Media 2026 & 2034
Figure 59: South America All Flash Array Market Report Revenue Share (%), by Flash Media 2026 & 2034
Figure 60: South America All Flash Array Market Report Revenue (Billion), by Storage Architecture 2026 & 2034
Figure 61: South America All Flash Array Market Report Revenue Share (%), by Storage Architecture 2026 & 2034
Figure 62: South America All Flash Array Market Report Revenue (Billion), by Storage System 2026 & 2034
Figure 63: South America All Flash Array Market Report Revenue Share (%), by Storage System 2026 & 2034
Figure 64: South America All Flash Array Market Report Revenue (Billion), by Country 2026 & 2034
Figure 65: South America All Flash Array Market Report Revenue Share (%), by Country 2026 & 2034
Figure 66: Middle East & Africa All Flash Array Market Report Revenue (Billion), by Architecture 2026 & 2034
Figure 67: Middle East & Africa All Flash Array Market Report Revenue Share (%), by Architecture 2026 & 2034
Figure 68: Middle East & Africa All Flash Array Market Report Revenue (Billion), by Capacity 2026 & 2034
Figure 69: Middle East & Africa All Flash Array Market Report Revenue Share (%), by Capacity 2026 & 2034
Figure 70: Middle East & Africa All Flash Array Market Report Revenue (Billion), by Interface Protocol 2026 & 2034
Figure 71: Middle East & Africa All Flash Array Market Report Revenue Share (%), by Interface Protocol 2026 & 2034
Figure 72: Middle East & Africa All Flash Array Market Report Revenue (Billion), by End-User Industry 2026 & 2034
Figure 73: Middle East & Africa All Flash Array Market Report Revenue Share (%), by End-User Industry 2026 & 2034
Figure 74: Middle East & Africa All Flash Array Market Report Revenue (Billion), by Flash Media 2026 & 2034
Figure 75: Middle East & Africa All Flash Array Market Report Revenue Share (%), by Flash Media 2026 & 2034
Figure 76: Middle East & Africa All Flash Array Market Report Revenue (Billion), by Storage Architecture 2026 & 2034
Figure 77: Middle East & Africa All Flash Array Market Report Revenue Share (%), by Storage Architecture 2026 & 2034
Figure 78: Middle East & Africa All Flash Array Market Report Revenue (Billion), by Storage System 2026 & 2034
Figure 79: Middle East & Africa All Flash Array Market Report Revenue Share (%), by Storage System 2026 & 2034
Figure 80: Middle East & Africa All Flash Array Market Report Revenue (Billion), by Country 2026 & 2034
Figure 81: Middle East & Africa All Flash Array Market Report Revenue Share (%), by Country 2026 & 2034
Table 16:
Table 17: USA All Flash Array Market Report Revenue (Billion) Forecast, by Application 2020 & 2034
Table 18: Canada All Flash Array Market Report Revenue (Billion) Forecast, by Application 2020 & 2034
Table 19: Mexico All Flash Array Market Report Revenue (Billion) Forecast, by Application 2020 & 2034
Table 20: Europe All Flash Array Market Report Revenue Billion Forecast, by Architecture 2020 & 2034
Table 21: Europe All Flash Array Market Report Revenue Billion Forecast, by Capacity 2020 & 2034
Table 22: Europe All Flash Array Market Report Revenue Billion Forecast, by Interface Protocol 2020 & 2034
Table 23: Europe All Flash Array Market Report Revenue Billion Forecast, by End-User Industry 2020 & 2034
Table 24: Europe All Flash Array Market Report Revenue Billion Forecast, by Flash Media 2020 & 2034
Table 25: Europe All Flash Array Market Report Revenue Billion Forecast, by Storage Architecture 2020 & 2034
Table 26: Europe All Flash Array Market Report Revenue Billion Forecast, by Storage System 2020 & 2034
Table 27: Europe All Flash Array Market Report Revenue Billion Forecast, by Country 2020 & 2034
Table 28: Germany All Flash Array Market Report Revenue (Billion) Forecast, by Application 2020 & 2034
Table 29: UK All Flash Array Market Report Revenue (Billion) Forecast, by Application 2020 & 2034
Table 30: France All Flash Array Market Report Revenue (Billion) Forecast, by Application 2020 & 2034
Table 31: Netherlands All Flash Array Market Report Revenue (Billion) Forecast, by Application 2020 & 2034
Table 32: Asia Pacific All Flash Array Market Report Revenue Billion Forecast, by Architecture 2020 & 2034
Table 33: Asia Pacific All Flash Array Market Report Revenue Billion Forecast, by Capacity 2020 & 2034
Table 34: Asia Pacific All Flash Array Market Report Revenue Billion Forecast, by Interface Protocol 2020 & 2034
Table 35: Asia Pacific All Flash Array Market Report Revenue Billion Forecast, by End-User Industry 2020 & 2034
Table 36: Asia Pacific All Flash Array Market Report Revenue Billion Forecast, by Flash Media 2020 & 2034
Table 37: Asia Pacific All Flash Array Market Report Revenue Billion Forecast, by Storage Architecture 2020 & 2034
Table 38: Asia Pacific All Flash Array Market Report Revenue Billion Forecast, by Storage System 2020 & 2034
Table 39: Asia Pacific All Flash Array Market Report Revenue Billion Forecast, by Country 2020 & 2034
Table 40: China All Flash Array Market Report Revenue (Billion) Forecast, by Application 2020 & 2034
Table 41: Japan All Flash Array Market Report Revenue (Billion) Forecast, by Application 2020 & 2034
Table 42: India All Flash Array Market Report Revenue (Billion) Forecast, by Application 2020 & 2034
Table 43: South Korea All Flash Array Market Report Revenue (Billion) Forecast, by Application 2020 & 2034
Table 44: Singapore All Flash Array Market Report Revenue (Billion) Forecast, by Application 2020 & 2034
Table 45: South America All Flash Array Market Report Revenue Billion Forecast, by Architecture 2020 & 2034
Table 46: South America All Flash Array Market Report Revenue Billion Forecast, by Capacity 2020 & 2034
Table 47: South America All Flash Array Market Report Revenue Billion Forecast, by Interface Protocol 2020 & 2034
Table 48: South America All Flash Array Market Report Revenue Billion Forecast, by End-User Industry 2020 & 2034
Table 49: South America All Flash Array Market Report Revenue Billion Forecast, by Flash Media 2020 & 2034
Table 50: South America All Flash Array Market Report Revenue Billion Forecast, by Storage Architecture 2020 & 2034
Table 51: South America All Flash Array Market Report Revenue Billion Forecast, by Storage System 2020 & 2034
Table 52: South America All Flash Array Market Report Revenue Billion Forecast, by Country 2020 & 2034
Table 53: Brazil All Flash Array Market Report Revenue (Billion) Forecast, by Application 2020 & 2034
Table 54: Argentina All Flash Array Market Report Revenue (Billion) Forecast, by Application 2020 & 2034
Table 55: Middle East & Africa All Flash Array Market Report Revenue Billion Forecast, by Architecture 2020 & 2034
Table 56: Middle East & Africa All Flash Array Market Report Revenue Billion Forecast, by Capacity 2020 & 2034
Table 57: Middle East & Africa All Flash Array Market Report Revenue Billion Forecast, by Interface Protocol 2020 & 2034
Table 58: Middle East & Africa All Flash Array Market Report Revenue Billion Forecast, by End-User Industry 2020 & 2034
Table 59: Middle East & Africa All Flash Array Market Report Revenue Billion Forecast, by Flash Media 2020 & 2034
Table 60: Middle East & Africa All Flash Array Market Report Revenue Billion Forecast, by Storage Architecture 2020 & 2034
Table 61: Middle East & Africa All Flash Array Market Report Revenue Billion Forecast, by Storage System 2020 & 2034
Table 62: Middle East & Africa All Flash Array Market Report Revenue Billion Forecast, by Country 2020 & 2034
Table 63: Saudi Arabia All Flash Array Market Report Revenue (Billion) Forecast, by Application 2020 & 2034
Table 64: UAE All Flash Array Market Report Revenue (Billion) Forecast, by Application 2020 & 2034
Table 65: South Africa All Flash Array Market Report Revenue (Billion) Forecast, by Application 2020 & 2034