
Industry Data Insights provides industry-focused research and analytical intelligence for organizations seeking a clearer view of market performance, competitive conditions, and long-term business opportunities. Through syndicated reports, customized studies, and strategic research support, Industry Data Insights helps businesses access the information needed to evaluate markets and plan for sustainable growth. Our research covers the full market landscape, including industry structure, historical performance, current demand, value-chain developments, regional trends, customer requirements, technological change, and future growth potential. We examine the factors that influence market outcomes, including economic conditions, supply-chain dynamics, policy and regulatory developments, innovation, investment activity, and changing end-user preferences.
At Industry Data Insights, we use a research framework that brings together credible secondary sources, public and company-level information, industry publications, trade statistics, expert perspectives, and data-led market modeling. Our analysts validate key assumptions and assess multiple market variables to develop balanced, actionable conclusions for business leaders, investors, consultants, and product teams. Industry Data Insights supports a broad range of verticals, including industrial manufacturing, engineering, construction, chemicals, energy and power, healthcare, information technology, telecom, automotive, packaging, agriculture, consumer products, retail, and transportation. Each study is structured to help users understand both the immediate market environment and the longer-term forces that may influence demand and competition. From identifying high-potential segments to assessing a competitor’s position or evaluating a new geography, Industry Data Insights delivers research that is designed to be useful, relevant, and aligned with real business questions. Our goal is to turn industry data into strategic direction.



Nov 11 2026
234

Srinwanti Kar
Senior Research Analyst
Access in-depth insights on industries, companies, trends, and global markets. Our expertly curated reports provide the most relevant data and analysis in a condensed, easy-to-read format.

See the similar reports
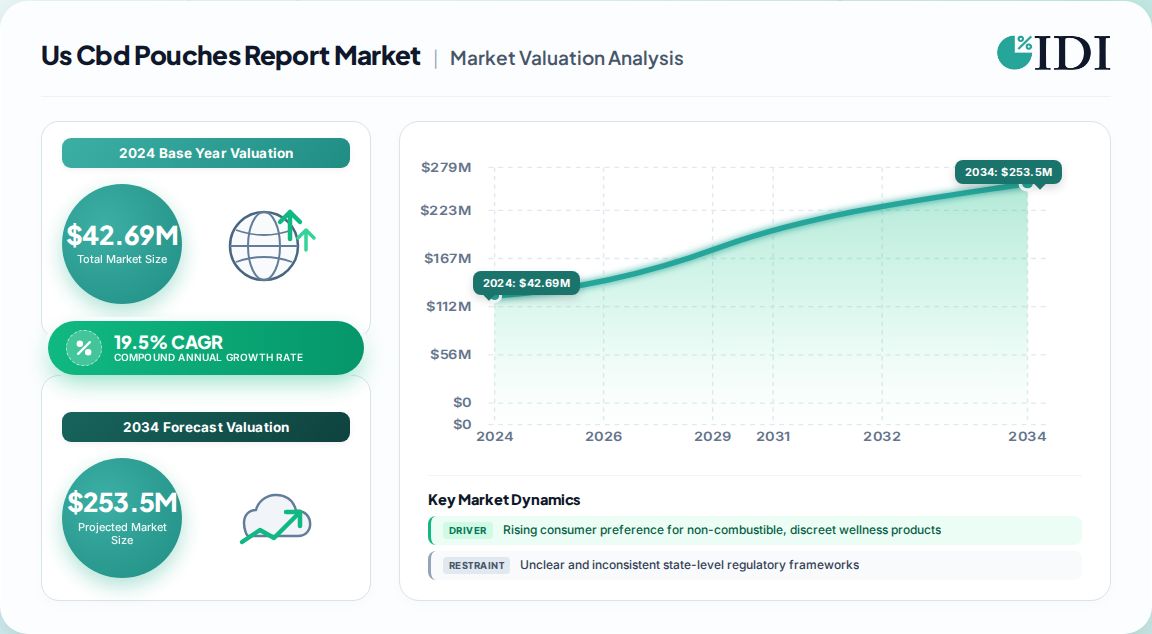
The U.S. CBD pouches market represents one of the fastest-compounding niches within the broader smokeless wellness category. Our proprietary first-party research pegs the 2024 base at USD 42.69 million, with a projected trajectory to USD 232.36 million by 2033, advancing at a 19.5% CAGR across the 2025–2033 forecast window.
| Year | Market Size |
|---|---|
| 2025 | 51.00 M |
| 2026 | 61.00 M |
| 2027 | 73.00 M |
| 2028 | 87.00 M |
| 2029 | 104.0 M |
| 2030 | 124.0 M |
| 2031 | 149.0 M |
CBD pouches are pre-portioned, tobacco-free sachets containing hemp-derived cannabidiol, placed between the gum and cheek for gradual transmucosal absorption. The format eliminates combustion, vapor, and odor, positioning it as a discreet, precisely dosed alternative to tinctures, vapes, and edibles.
| Structural Metric | 2024 Base | 2033 Forecast | Growth Rate |
|---|---|---|---|
| Market Revenue | USD 42.69 million | USD 232.36 million | 19.5% CAGR |
| Dominant Content Tier | 10 mg–20 mg (50.51% share) | Retains leadership | Moderate expansion |
| Fastest Content Tier | Up to 10 mg | Accelerating | 19.2% CAGR |
| Dominant Type | Flavored (86.26% share) | Sustained majority | Mature growth |
| Leading Channel | Offline retail | Retains volume lead | Steady |
Demand composition skews toward working professionals and younger wellness consumers who value portability, dosing precision, and social acceptability. Male users account for roughly 70% of regular CBD consumption, while trial rates remain more balanced across genders.
Dosage architecture is the single most consequential segmentation axis in this market. The 10 mg–20 mg tier commanded 50.51% revenue share in 2024, reflecting its position as the efficacy-safety sweet spot for mainstream stress relief, focus, and mild discomfort management.
| Content Tier | 2024 Share | Forecast CAGR | Core Buyer Profile |
|---|---|---|---|
| 10 mg–20 mg | 50.51% | Baseline | Regular users, moderate therapeutic intent |
| Up to 10 mg | Growth tier | 19.2% | First-time users, microdosers, older adults |
| Others (high-dose) | Residual | Niche | Experienced, high-tolerance consumers |
Formulation science is shifting competitive advantage toward absorption kinetics. Nanoencapsulation and bioavailability-enhancement techniques compress onset time — historically a leading consumer frustration alongside inconsistent dosing — and improve perceived value per pouch.
Flavor strategy currently dictates trial conversion. Flavored pouches held 86.26% of 2024 U.S. revenue, driven by mint, citrus, berry, coffee, and tropical profiles that mask raw hemp notes and broaden appeal beyond legacy CBD users.
The unflavored tier, while smaller, is the strategic growth flank. Clean-label, additive-free positioning attracts seasoned consumers who prioritize purity and therapeutic authenticity over sensory experience.
Distribution remains anchored in physical retail, where in-store consultation and tactile product assessment reinforce consumer trust. Offline channels held the largest revenue share in 2024, supported by pharmacy chains, convenience formats, and specialty wellness counters.
The online channel is the fastest-compounding route to market, propelled by discreet purchasing, broader SKU visibility, and direct-to-consumer subscription models.
| Channel | 2024 Position | Growth Profile | Primary Advantage |
|---|---|---|---|
| Offline | Volume leader | Steady, mature | Trust, staff guidance, immediacy |
| Online | Fastest-growing | Outpacing market | Discretion, assortment depth, DTC economics |
Key friction points constraining channel expansion include limited retail access in certain states, high unit pricing, and inconsistent shelf presence. Brands addressing these gaps through tappable compliance documentation and localized assortment gain disproportionate share.
Long-term category retention hinges on resolving five recurring consumer frustrations identified in our primary interviews: inconsistent dosage, elevated pricing, constrained retail access, slow onset, and insufficient flavor appeal.
Demographic concentration presents both strength and blind spot. White/Caucasian consumers constitute approximately 64% of the U.S. CBD user base, while Asian American (4%) and Black/African American (5%) representation lags — signaling untapped inclusive marketing and education opportunities rather than demand saturation.
The U.S. vendor field spans specialist CBD pouch pioneers, cannabinoid wellness brands, and smokeless oral incumbents extending into hemp-derived formats. Positioning clusters around sourcing transparency, flavor breadth, and dosing precision.
Representative participants in our coverage set include:
Development themes we are tracking include enhanced-bioavailability reformulations, expanded sugar-free and vegan lines, eco-conscious packaging transitions, and incremental placement in mainstream pharmacy and e-commerce accounts. Brands are also investing in functional positioning — sleep, focus, and recovery — to escape commodity pricing pressure.
U.S. demand concentrates in coastal and urban wellness-forward markets, with the South and West representing the largest consumption pools, followed by the Northeast and Midwest. State-level regulatory variance continues to shape assortment depth and channel access.
| Region | Market Share (%) |
|---|---|
| Northeast | 0.24% |
| South | 0.31% |
| West | 0.28% |
| Midwest | 0.17% |
The forward outlook rests on three pillars: continued substitution away from inhalable formats, mainstream retail normalization, and formulation-led efficacy proof. Sustained 19.5% CAGR through 2033 is achievable absent federal-level regulatory disruption, but brand survival will hinge on resolving dosage consistency and price-per-serving economics faster than the category average.
Our rigorous research methodology combines multi-layered approaches with comprehensive quality assurance, ensuring precision, accuracy, and reliability in every market analysis.
| Stakeholder Role | Interview Share (%) |
|---|---|
| Vice President of Product Development | 32% |
| Chief Commercial Officer | 26% |
| Category Buyer (Wellness) | 24% |
| Regulatory & Compliance Manager | 18% |
| Company Type | Representation (%) |
|---|---|
| CBD Pouch Formulators & Contract Manufacturers | 30% |
| Hemp Extractors & Cannabinoid Suppliers | 18% |
| Flavor & Encapsulation Technology Providers | 14% |
| Distributors & Retail Buyers | 26% |
| DTC E-Commerce Operators | 12% |
| Aspects | Details |
|---|---|
| Study Period | 2020-2034 |
| Base Year | 2025 |
| Estimated Year | 2026 |
| Forecast Period | 2026-2034 |
| Historical Period | 2020-2025 |
| Growth Rate | CAGR of 19.5% from 2020-2034 |
| Segmentation |
|
Our proprietary research estimates the U.S. CBD pouches market at USD 42.69 million in 2024, projected to reach USD 232.36 million by 2033 at a 19.5% CAGR from 2025 to 2033.
The 10 mg–20 mg tier led with a 50.51% revenue share in 2024, as it balances noticeable efficacy with low overconsumption risk for both new and regular users.
Flavored pouches accounted for 86.26% of 2024 revenue because profiles like mint, citrus, and berry mask raw hemp taste and broaden appeal to first-time and migrating nicotine-pouch consumers.
Offline retail holds the largest share, but online is the fastest-growing channel, driven by discreet purchasing, deeper assortment, and direct-to-consumer subscription models.
Key participants include Cannadips, VELO CBD, Holistic Wellness, CBDfx, Grinds, SNUSSIE, Cannobie, Rogue, Hempire, Jakobsson's, and FlowBlend.
