Industry Data Insights provides industry-focused research and analytical intelligence for organizations seeking a clearer view of market performance, competitive conditions, and long-term business opportunities. Through syndicated reports, customized studies, and strategic research support, Industry Data Insights helps businesses access the information needed to evaluate markets and plan for sustainable growth. Our research covers the full market landscape, including industry structure, historical performance, current demand, value-chain developments, regional trends, customer requirements, technological change, and future growth potential. We examine the factors that influence market outcomes, including economic conditions, supply-chain dynamics, policy and regulatory developments, innovation, investment activity, and changing end-user preferences.
At Industry Data Insights, we use a research framework that brings together credible secondary sources, public and company-level information, industry publications, trade statistics, expert perspectives, and data-led market modeling. Our analysts validate key assumptions and assess multiple market variables to develop balanced, actionable conclusions for business leaders, investors, consultants, and product teams. Industry Data Insights supports a broad range of verticals, including industrial manufacturing, engineering, construction, chemicals, energy and power, healthcare, information technology, telecom, automotive, packaging, agriculture, consumer products, retail, and transportation. Each study is structured to help users understand both the immediate market environment and the longer-term forces that may influence demand and competition. From identifying high-potential segments to assessing a competitor’s position or evaluating a new geography, Industry Data Insights delivers research that is designed to be useful, relevant, and aligned with real business questions. Our goal is to turn industry data into strategic direction.
Insulated Food Containers Market by Material (Stainless Steel, Plastic, Glass, Polypropylene, Other), by Capacity (Below 30 oz, 30-50 oz, 50-70 oz, Above 70 oz), by Application (Food Delivery Services, Home & Office Use, Travel & Leisure, Healthcare & Medical, Other), by Design (Single-Wall, Double-Wall, Vacuum-Insulated, Triple-Wall, Other), by Distribution Channel (Offline, Online), by Global (North America(USA, Canada, Mexico), Europe(Germany, France, UK, Italy, Spain), Asia Pacific(China, India, Japan, Australia, South Korea), Latin America(Brazil, Argentina), Middle East & Africa(South Africa, Saudi Arabia, UAE)) Forecast 2026-2034
Access in-depth insights on industries, companies, trends, and global markets. Our expertly curated reports provide the most relevant data and analysis in a condensed, easy-to-read format.
Insulated Food Containers Market Valuation and Forecast Trajectory
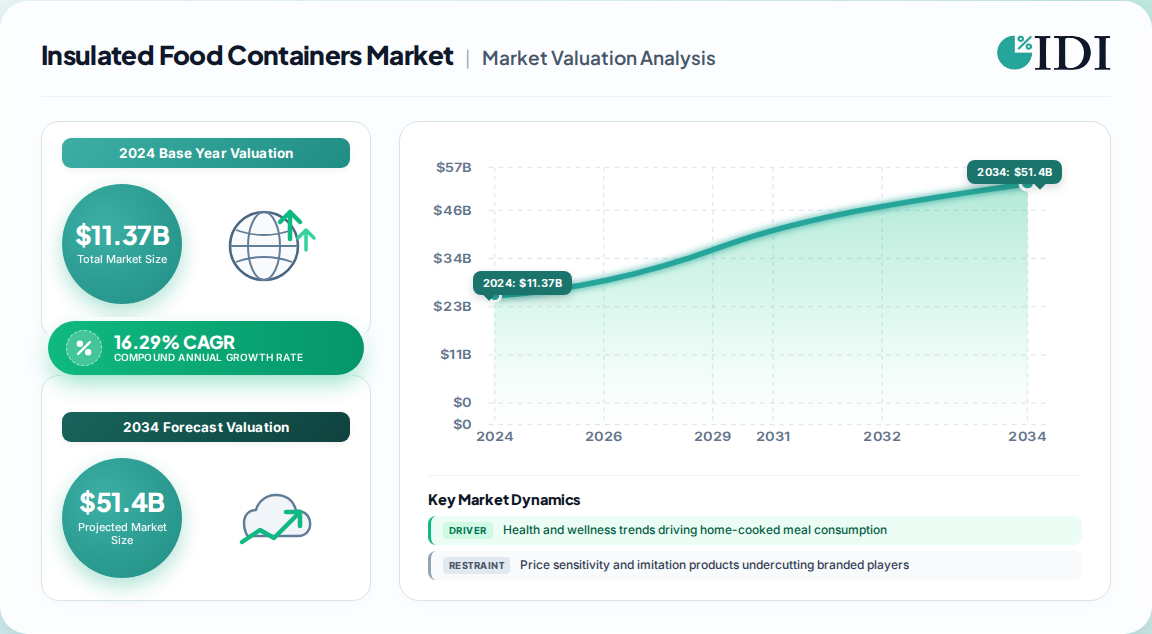
The global Insulated Food Containers Market is on an exceptional growth trajectory, with proprietary first-party research estimating a valuation of USD 11.37 Billion in 2024, rising to USD 13.22 Billion in 2025 and projected to reach USD 59.82 Billion by 2035. This represents a robust CAGR of 16.29% across the 2025–2035 forecast period, underscoring a structural demand shift rather than a cyclical uptick.
Insulated Food Containers Market Market Size (In Billion)
40.0B
30.0B
20.0B
10.0B
0
13.22 B
2025
15.38 B
2026
17.88 B
2027
20.79 B
2028
24.18 B
2029
28.12 B
2030
32.70 B
2031
Insulated Food Containers Market Market Size (In Billion)
Year
Market Size
2025
13.22 B
2026
15.38 B
2027
17.88 B
2028
20.79 B
2029
24.18 B
2030
28.12 B
2031
32.70 B
2024 baseline: USD 11.37 Billion
2025 estimate: USD 13.22 Billion
2035 projection: USD 59.82 Billion
Forecast CAGR (2025–2035): 16.29%
Our demand modeling triangulates manufacturer revenue, channel sell-through, and replacement-cycle data to validate this trajectory, with the stainless steel segment alone recording over USD 861.7 Million in revenue in 2018 and expanding at an 11.0% CAGR through the forecast window.
Stainless Steel and Plastic Material Performance Matrix
Material selection is the single strongest determinant of thermal performance, price positioning, and lifecycle cost within the Insulated Food Containers Market. Stainless steel commands the largest revenue share at over 43.0% in 2024, valued for non-reactive, non-toxic properties that limit bacterial ingress. Plastic, by contrast, is the fastest-growing material class, propelled by lightweight handling and BPA-free resin innovation.
Material
2024 Revenue Share
Growth Profile
Key Adoption Driver
Stainless Steel
>43.0%
Fastest CAGR at 11.0%
Non-reactive, odor-resistant, sanitization cycles
Plastic (BPA-free)
Mass-market dominant
Fastest-growing by volume
Lightweight, low cost, impact resistance
Glass
Premium niche
Steady
Taste neutrality, microwave/oven visibility
Polypropylene
Niche
Moderate
Affordability in bulk foodservice
Vendors are increasingly pursuing multi-material constructions, combining vacuum-insulated steel bodies with silicone-sleeved glass inserts and laminated plastic walls to capture premiumization premiums without sacrificing durability.
Capacity Tiers: 30-50 oz Dominance and 50-70 oz Acceleration
Capacity segmentation reveals a bifurcated demand pattern. The 30-50 oz tier holds the largest revenue share, aligning with the daily meal-prep and office lunch occasion. The 50-70 oz tier is the fastest-growing, driven by family meal storage, food delivery fleet requirements, and outdoor recreation.
Below 30 oz: Snack and child-lunch formats; high replacement frequency
30-50 oz: Largest segment; core working-professional demand
50-70 oz: Fastest-growing; family and delivery-channel adoption
Above 70 oz: Bulk catering and healthcare food transport
This tiering is critical for manufacturers calibrating SKU breadth against shelf-space economics in hypermarkets and supermarkets, which held a revenue share of more than 45.0% in 2018 and remain the dominant physical verification channel.
Application Verticals from Delivery Fleets to Healthcare
Application segmentation spans five principal verticals, with food delivery services commanding the largest share and healthcare and medical registering the fastest growth. The food delivery channel benefits directly from the rise of cloud kitchens and meal-prep culture, where thermal retention over transit windows is non-negotiable.
Food Delivery Services: Largest application; requires 6-hour thermal retention
Home & Office Use: Over 60% of households now adopt insulated containers for daily meal storage
Travel & Leisure: Outdoor recreation and camping demand for rugged double-wall formats
Healthcare & Medical: Fastest-growing; non-reactive storage and contamination control
Healthcare adoption is further reinforced by the nutritional integrity requirement, with insulated containers preserving meal temperature for approximately 6 hours—a benchmark that has become a de facto procurement standard.
Double-Wall to Vacuum-Insulated Design Migration
Design architecture is undergoing a decisive migration from single-wall to advanced insulation systems. Double-wall constructions remain the largest design segment, offering a balance of cost and thermal efficiency. Vacuum-insulated formats are the fastest-growing, delivering superior temperature retention and commanding premium price points in outdoor and professional segments.
Design Format
Market Position
Thermal Characteristic
Single-Wall
Entry tier
Minimal retention; budget segment
Double-Wall
Largest segment
Air-gap insulation; balanced cost
Vacuum-Insulated
Fastest-growing
Highest retention; premium pricing
Triple-Wall
Emerging
Extended retention for delivery fleets
Smart features such as temperature monitoring are entering the vacuum-insulated tier, creating a new premium frontier that brands are leveraging to differentiate in an increasingly crowded field.
E-Commerce Channels and Distribution Reconfiguration
The online distribution channel is expected to expand at the fastest CAGR of 11.2% from 2025 to 2033, reshaping go-to-market strategy across the Insulated Food Containers Market. Offline retail, anchored by hypermarkets and supermarkets, retains dominance in emerging economies where physical verification before purchase remains a consumer preference.
Offline: >45.0% revenue share in 2018; strong in price-sensitive markets
Online: Fastest-growing at 11.2% CAGR; driven by smartphone penetration and marketplace variety
Direct-to-consumer: Emerging brand channel for customization and personalization programs
Brands are reallocating trade-spend toward digital shelf optimization, subscription meal-prep bundles, and localized fulfillment to capture the online shift without cannibalizing legacy retail relationships.
Asia-Pacific Consumption Leadership and Regional Dynamics
Asia Pacific dominates the global market, accounting for a revenue share of over 40.0% in 2024 and growing at the fastest CAGR of 11.0% through the forecast period. The region benefits from an expanding middle-class income group in China and India, where approximately 68% of the population is working-class and requires home-cooked food at the workplace. North America remains the largest mature market, driven by health and wellness emphasis.
North America: Mature, health-driven demand; premiumization leader
Europe: Sustainability regulation shaping material choice
Latin America & Middle East & Africa: Emerging growth frontiers
Regional trade flows show rising intra-Asia exports of stainless steel containers, with China and India serving as manufacturing hubs for both domestic consumption and export to North American and European brands.
Sustainability Mandates and Raw Material Supply Dynamics
Sustainability is now a structural market force: nearly 52% of buyers prioritize eco-friendly packaging solutions, and over 58% report a shift away from single-use containers. This is reshaping upstream supply dynamics, with manufacturers prioritizing recyclable stainless steel, BPA-free resins, and kerbside-recyclable insulation materials.
Recyclable stainless steel and BPA-free plastic dominate new product development
Returnable packaging programs and refillable formats gaining traction in foodservice
Fully recyclable insulated box innovations launched in 2022 set a new sustainability benchmark
Suppliers face dual pressure: meeting thermal-performance specifications while satisfying retailer recyclability scorecards. This is driving investment in advanced thermal materials and vacuum-sealing technology that reduce material intensity per unit of thermal retention.
Our rigorous research methodology combines multi-layered approaches with comprehensive quality assurance, ensuring precision, accuracy, and reliability in every market analysis.
Primary Research
Primary research accounts for 70–80% of total research effort, with 20–30% derived from secondary sources.
We conduct in-depth interviews with 4–5 specific company types across the value chain: stainless steel container manufacturers, plastic injection molders, vacuum insulation technology suppliers, food delivery fleet operators, and healthcare foodservice procurement teams.
Stakeholder interviews target specific job titles: Procurement Director, Product Development Manager, Supply Chain Analyst, and Food Safety Compliance Officer.
We engage directly with globally recognized industry associations and regulatory bodies, including the International Organization for Standardization (ISO) for thermal performance standards, the U.S. Food and Drug Administration (FDA) for food-contact material compliance, and the European Food Safety Authority (EFSA) for material safety benchmarks.
Quantitative metrics captured in bottom-up calculations include: average unit price per container by material tier, replacement cycle length in months, thermal retention hours per SKU, and channel sell-through velocity.
Key Stakeholders Interviewed
Key Stakeholders Interviewed
Stakeholder Role
Interview Share (%)
Procurement Director
30%
Product Development Manager
28%
Supply Chain Analyst
22%
Food Safety Compliance Officer
20%
Industry Ecosystem Breakdown
Industry Ecosystem Breakdown
Company Type
Representation (%)
Stainless Steel Container Manufacturers
30%
Plastic Injection Molders
25%
Vacuum Insulation Technology Suppliers
20%
Food Delivery Fleet Operators
15%
Healthcare Foodservice Procurement Teams
10%
Secondary Research & Industry Benchmarking
Secondary research draws from official multilateral sources including UN Comtrade for import/export trade flows of stainless steel and plastic food containers, World Bank economic indicators, and OECD consumption data.
We reference official .gov databases and recognized non-profit trade associations, including the U.S. International Trade Commission (USITC) for tariff and trade statistics, Eurostat for European consumption patterns, and the WTO for global trade policy benchmarks.
Standard financial databases used for company-level validation include Bloomberg, Factiva, Hoovers, and PitchBook, accessed for revenue verification and corporate development tracking.
Every report is updated to the date of purchase, ensuring all market estimates reflect the latest available trade and financial data.
Demand Modeling & Market Estimation
We employ simultaneous top-down and bottom-up methodologies, validated through multi-level data triangulation across manufacturer revenue, channel sell-through, and end-user consumption surveys.
Bottom-up market sizing aggregates SKU-level unit sales across capacity tiers (below 30 oz, 30-50 oz, 50-70 oz, above 70 oz) multiplied by verified average selling prices, cross-checked against manufacturer shipment volumes.
Demand modeling incorporates replacement-cycle assumptions (24–36 months for consumer segments), food delivery fleet procurement cycles, and healthcare institutional purchasing frequencies.
Regional demand is modeled using working-population ratios, urbanization rates, and disposable income proxies from World Bank and OECD datasets, with Asia Pacific's 68% working-class population ratio serving as a key demand multiplier.
Data Accuracy & Quality Check
We guarantee an estimated data accuracy level of 85–90% across all market size and forecast figures.
Multi-level data triangulation is applied at three tiers: manufacturer-reported revenue, distributor sell-through data, and end-consumer survey validation, with variances above 10% flagged for re-interview.
All thermal performance claims are benchmarked against ISO-recognized retention standards, and food-contact material compliance is verified against FDA and EFSA regulatory databases.
Final estimates undergo a peer-review panel of senior analysts and external domain experts before publication, with continuous revision cycles aligned to new trade data releases from UN Comtrade and USITC.
Aspects
Details
Study Period
2020-2034
Base Year
2025
Estimated Year
2026
Forecast Period
2026-2034
Historical Period
2020-2025
Growth Rate
CAGR of 16.29% from 2020-2034
Segmentation
By Material
Stainless Steel
Plastic
Glass
Polypropylene
Other
By Capacity
Below 30 oz
30-50 oz
50-70 oz
Above 70 oz
By Application
Food Delivery Services
Home & Office Use
Travel & Leisure
Healthcare & Medical
Other
By Design
Single-Wall
Double-Wall
Vacuum-Insulated
Triple-Wall
Other
By Distribution Channel
Offline
Online
By Geography
Global
North America(USA, Canada, Mexico)
Europe(Germany, France, UK, Italy, Spain)
Asia Pacific(China, India, Japan, Australia, South Korea)
Latin America(Brazil, Argentina)
Middle East & Africa(South Africa, Saudi Arabia, UAE)
Table 5: Insulated Food Containers Market Revenue Billion Forecast, by Distribution Channel 2020 & 2034
Table 6: Insulated Food Containers Market Revenue Billion Forecast, by Region 2020 & 2034
Table 7: Global Insulated Food Containers Market Revenue Billion Forecast, by Material 2020 & 2034
Table 8: Global Insulated Food Containers Market Revenue Billion Forecast, by Capacity 2020 & 2034
Table 9: Global Insulated Food Containers Market Revenue Billion Forecast, by Application 2020 & 2034
Table 10: Global Insulated Food Containers Market Revenue Billion Forecast, by Design 2020 & 2034
Table 11: Global Insulated Food Containers Market Revenue Billion Forecast, by Distribution Channel 2020 & 2034
Table 12: Global Insulated Food Containers Market Revenue Billion Forecast, by Country 2020 & 2034
Table 13: North America(USA, Canada, Mexico) Insulated Food Containers Market Revenue (Billion) Forecast, by Application 2020 & 2034
Table 14: Europe(Germany, France, UK, Italy, Spain) Insulated Food Containers Market Revenue (Billion) Forecast, by Application 2020 & 2034
Table 15: Asia Pacific(China, India, Japan, Australia, South Korea) Insulated Food Containers Market Revenue (Billion) Forecast, by Application 2020 & 2034
Frequently Asked Questions
1. What is the current size of the Insulated Food Containers Market?
The market was valued at USD 11.37 Billion in 2024 and is projected to reach USD 59.82 Billion by 2035, growing at a CAGR of 16.29% during the forecast period.
2. Which material segment dominates the Insulated Food Containers Market?
Stainless steel holds the largest revenue share at over 43.0% in 2024, favored for its non-reactive and non-toxic properties, while plastic is the fastest-growing material segment.
3. Which region leads the Insulated Food Containers Market?
Asia Pacific dominates with over 40.0% revenue share in 2024 and is expected to grow at the fastest CAGR of 11.0%, driven by working-class demand in China and India.
4. What are the key drivers of the Insulated Food Containers Market?
Health and wellness trends, rising demand for on-the-go meals, growing e-commerce, and technological innovations in vacuum insulation are the primary growth drivers.
5. Which distribution channel is growing fastest in the Insulated Food Containers Market?
The online distribution channel is expected to expand at the fastest CAGR of 11.2% from 2025 to 2033, driven by smartphone penetration and marketplace variety.
6.1.9.4. SWOT Analysis
6.1.10. American Aerogel
6.1.10.1. Company Overview
6.1.10.2. Products
6.1.10.3. Company Financials
6.1.10.4. SWOT Analysis
6.1.11. Huhtamaki
6.1.11.1. Company Overview
6.1.11.2. Products
6.1.11.3. Company Financials
6.1.11.4. SWOT Analysis
6.1.12. Cambro
6.1.12.1. Company Overview
6.1.12.2. Products
6.1.12.3. Company Financials
6.1.12.4. SWOT Analysis
6.1.13. Carlisle
6.1.13.1. Company Overview
6.1.13.2. Products
6.1.13.3. Company Financials
6.1.13.4. SWOT Analysis
6.1.14. Hamilton Housewares
6.1.14.1. Company Overview
6.1.14.2. Products
6.1.14.3. Company Financials
6.1.14.4. SWOT Analysis
6.1.15. Valor Industries
6.1.15.1. Company Overview
6.1.15.2. Products
6.1.15.3. Company Financials
6.1.15.4. SWOT Analysis
6.1.16. TokyoPlast
6.1.16.1. Company Overview
6.1.16.2. Products
6.1.16.3. Company Financials
6.1.16.4. SWOT Analysis
6.1.17. Sonoco ThermoSafe
6.1.17.1. Company Overview
6.1.17.2. Products
6.1.17.3. Company Financials
6.1.17.4. SWOT Analysis
6.1.18. Smurfit Westrock
6.1.18.1. Company Overview
6.1.18.2. Products
6.1.18.3. Company Financials
6.1.18.4. SWOT Analysis
6.1.19. Anchor Packaging
6.1.19.1. Company Overview
6.1.19.2. Products
6.1.19.3. Company Financials
6.1.19.4. SWOT Analysis
6.1.20. Genpak
6.1.20.1. Company Overview
6.1.20.2. Products
6.1.20.3. Company Financials
6.1.20.4. SWOT Analysis
6.1.21. Inline Plastics
6.1.21.1. Company Overview
6.1.21.2. Products
6.1.21.3. Company Financials
6.1.21.4. SWOT Analysis
6.1.22. Evans Manufacturing
6.1.22.1. Company Overview
6.1.22.2. Products
6.1.22.3. Company Financials
6.1.22.4. SWOT Analysis
6.1.23. YETI Coolers
6.1.23.1. Company Overview
6.1.23.2. Products
6.1.23.3. Company Financials
6.1.23.4. SWOT Analysis
6.1.24. KingStar Industries
6.1.24.1. Company Overview
6.1.24.2. Products
6.1.24.3. Company Financials
6.1.24.4. SWOT Analysis
6.1.25. BARTH GmbH
6.1.25.1. Company Overview
6.1.25.2. Products
6.1.25.3. Company Financials
6.1.25.4. SWOT Analysis
6.1.26. Marko Foam Products
6.1.26.1. Company Overview
6.1.26.2. Products
6.1.26.3. Company Financials
6.1.26.4. SWOT Analysis
6.1.27. Newell Brands
6.1.27.1. Company Overview
6.1.27.2. Products
6.1.27.3. Company Financials
6.1.27.4. SWOT Analysis
6.1.28. Zojirushi America Corporation
6.1.28.1. Company Overview
6.1.28.2. Products
6.1.28.3. Company Financials
6.1.28.4. SWOT Analysis
6.2. Market Entropy
6.2.1. Company's Key Areas Served
6.2.2. Recent Developments
6.3. Company Market Share Analysis, 2026
6.3.1. Top 5 Companies Market Share Analysis
6.3.2. Top 3 Companies Market Share Analysis
6.4. List of Potential Customers
Table 16: Latin America(Brazil, Argentina) Insulated Food Containers Market Revenue (Billion) Forecast, by Application 2020 & 2034
Table 17: Middle East & Africa(South Africa, Saudi Arabia, UAE) Insulated Food Containers Market Revenue (Billion) Forecast, by Application 2020 & 2034