Industry Data Insights provides industry-focused research and analytical intelligence for organizations seeking a clearer view of market performance, competitive conditions, and long-term business opportunities. Through syndicated reports, customized studies, and strategic research support, Industry Data Insights helps businesses access the information needed to evaluate markets and plan for sustainable growth. Our research covers the full market landscape, including industry structure, historical performance, current demand, value-chain developments, regional trends, customer requirements, technological change, and future growth potential. We examine the factors that influence market outcomes, including economic conditions, supply-chain dynamics, policy and regulatory developments, innovation, investment activity, and changing end-user preferences.
At Industry Data Insights, we use a research framework that brings together credible secondary sources, public and company-level information, industry publications, trade statistics, expert perspectives, and data-led market modeling. Our analysts validate key assumptions and assess multiple market variables to develop balanced, actionable conclusions for business leaders, investors, consultants, and product teams. Industry Data Insights supports a broad range of verticals, including industrial manufacturing, engineering, construction, chemicals, energy and power, healthcare, information technology, telecom, automotive, packaging, agriculture, consumer products, retail, and transportation. Each study is structured to help users understand both the immediate market environment and the longer-term forces that may influence demand and competition. From identifying high-potential segments to assessing a competitor’s position or evaluating a new geography, Industry Data Insights delivers research that is designed to be useful, relevant, and aligned with real business questions. Our goal is to turn industry data into strategic direction.
Parcel Sortation Systems Market Report: Size, Share & 2035 Forecast
Parcel Sortation Systems Market Report by Component (Hardware, Software, Service), by Type (Linear, Loop), by System Type (Case Sorter, Combo Sorter, Unit Sorter), by End-Use (Logistics, E-Commerce, Airports, Food & Beverages, Pharmaceuticals, General Manufacturing), by Sorting Type (Linear, Circular, Divert), by North America (USA, Canada, Mexico), by Europe (Germany, UK, France), by Asia Pacific (China, Japan, South Korea), by South America (Brazil), by Middle East & Africa (UAE, South Africa) Forecast 2026-2034
Parcel Sortation Systems Market Report: Size, Share & 2035 Forecast
Discover the Latest Market Insight Reports
Access in-depth insights on industries, companies, trends, and global markets. Our expertly curated reports provide the most relevant data and analysis in a condensed, easy-to-read format.
Parcel Sortation Systems Market Report: USD 3.7 Billion in 2025 to USD 8.3 Billion by 2035
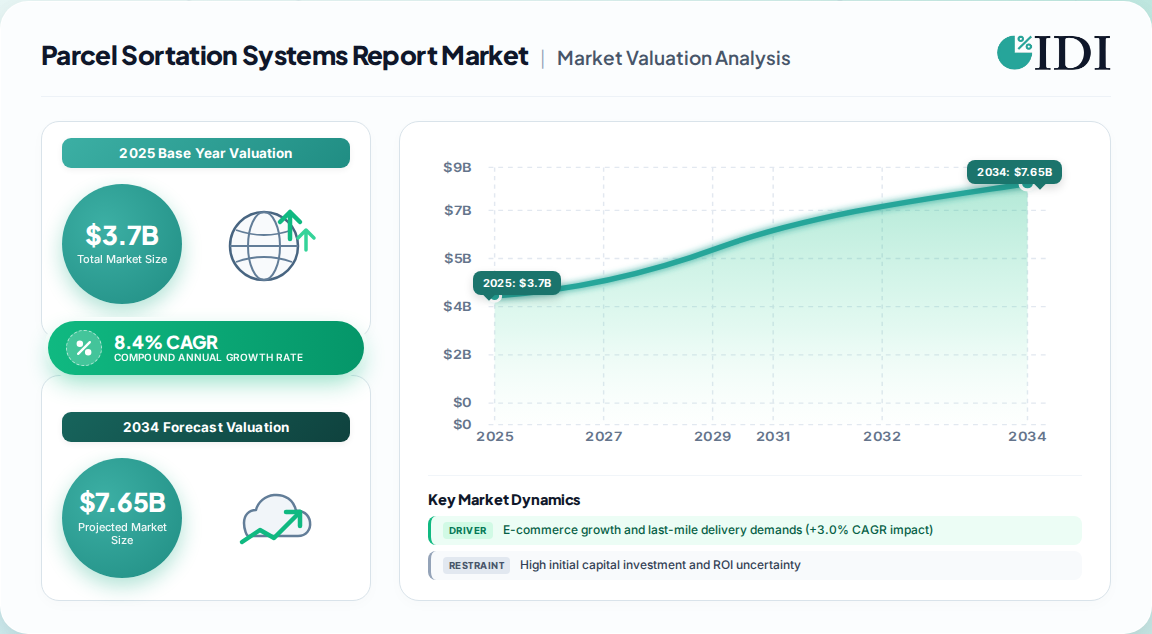
The global parcel sortation systems market is experiencing a structural transformation, moving from fixed mechanical capacity to configurable, software-orchestrated parcel-flow management. The market was valued at USD 3.7 billion in 2025 and is projected to reach USD 8.3 billion by 2035, expanding at a CAGR of 8.4% between 2026 and 2035. This growth is not merely a function of rising parcel volumes; it is increasingly tied to the compression of fulfillment windows and the need to reduce mis-sorts and labor dependency at hubs and last-mile depots.
Parcel Sortation Systems Market Report Market Size (In Billion)
7.5B
6.0B
4.5B
3.0B
1.5B
0
3.700 B
2025
4.011 B
2026
4.348 B
2027
4.713 B
2028
5.109 B
2029
5.538 B
2030
6.003 B
2031
Parcel Sortation Systems Market Report Market Size (In Billion)
Year
Market Size
2025
3.700 B
2026
4.011 B
2027
4.348 B
2028
4.713 B
2029
5.109 B
2030
5.538 B
2031
6.003 B
Hardware dominance: The hardware segment retained a 66.0% revenue share in 2025 (USD 2.4 billion), as high-throughput facilities still require substantial mechanical, electrical, and control equipment.
Software acceleration: Software, valued at USD 884.2 million in 2025, is forecast to grow at 9.3% CAGR through 2035, reflecting a shift toward intelligence layered onto installed mechanical assets.
Asia Pacific leadership: The region dominated the market with a 40% revenue share in 2023 and is also the fastest-growing region, driven by e-commerce expansion and labor cost pressures.
This proprietary analysis is based on primary interviews and validated trade data. The market covers the physical sortation line, control and orchestration software, and the engineering and service work required to commission and sustain parcel-flow operations.
Cross-Belt, Tilt-Tray, and Shoe Sorter Technologies
The type segment is anchored by loop (circular) systems, which dominated in 2023 and include cross-belt sorters and tilt-tray sorters. These systems are favored for high-throughput, large-scale operations and are experiencing the fastest growth due to advancements in dynamic sortation and AI integration. Linear systems, including activated roller belt sorters, pop-up sorters, and shoe sorters, are projected to witness significant growth as they offer modularity and scalability for smaller parcel volumes and first-time automation adopters.
Sorter Type
2023 Dominance
Growth Outlook
Key Applications
Cross-Belt Sorter
Leading
Fastest growth
Mixed cartons and polybags, dense destination layouts
Tilt-Tray Sorter
Leading
Fastest growth
High-throughput hubs, mixed item profiles
Shoe Sorter
Moderate
Significant growth
Small parcel volumes, modular installations
Activated Roller Belt
Emerging
Significant growth
Specific sorting needs, scalable operations
The cross-belt sorter is projected to account for 28.0% of equipment type revenue in 2026 owing to controlled discharge across mixed item profiles. Case sorters are expected to capture 41.0% of system type revenue in 2026, supported by repeatable carton flows across outbound distribution operations.
Hardware, Software, and Service Component Dynamics
Component segmentation reveals a clear bifurcation: hardware anchors installed capital, while software and services capture incremental value. In 2025, hardware accounted for 66.0% of revenue, underpinned by conveyors, scanners, and diverters. Software, at 9.3% CAGR, is the fastest-growing component as operators add intelligence to installed mechanical assets. The service segment, encompassing design and consultation, training, installation, and maintenance, is also projected to grow significantly as automation complexity increases.
Hardware:USD 2.4 billion in 2025; includes conveyors, sortation shoes, diverters, and scanners.
Software:USD 884.2 million in 2025; forecast to grow at 9.3% CAGR through 2035.
Services: Design, integration, and lifecycle support; critical for brownfield retrofits and uptime assurance.
E-Commerce and Logistics End-Use Verticals
The logistics segment dominated the market in 2023, and retail/e-commerce is the fastest-growing end-use segment, with an estimated 9.0% CAGR through 2035. Courier and logistics depots concentrate repetitive routing inside hard dispatch windows, raising the penalty for manual touches during volume peaks. The USPS introduced a Dallas multi-induct matrix sorter in September 2025 with capacity for 70,000 packages per hour, raising daily processing capacity to 1.5 million packages at that regional transfer hub.
Other end-use verticals include airports, food and beverages, pharmaceuticals, and general manufacturing. Air cargo demand is supported by expansion plans at major airports, such as Gatwick's EUR 1.1 billion expansion to accommodate 53 million passengers by 2024. In food and beverages, sortation systems handle diverse packaging profiles with high accuracy. The pharmaceutical sector requires gentle handling and traceability, driving demand for advanced scanning and routing.
End-Use Vertical
2023 Dominance
Growth Outlook
Key Requirements
Logistics
Dominant
Steady growth
High throughput, fixed cutoffs
E-Commerce
Fastest growing (9.0% CAGR)
Rapid expansion
Mixed item profiles, speed
Airports
Moderate
Growth with expansions
Baggage handling, security
Food & Beverages
Moderate
Stable
Gentle handling, hygiene
Pharmaceuticals
Niche
Growth
Traceability, accuracy
Asia Pacific, Europe, and North America Regional Leadership
Asia Pacific dominated the global market with a 40% revenue share in 2023 and is also the fastest-growing region. The region's growth is fueled by rapid e-commerce expansion, rising labor costs, and government initiatives to modernize logistics infrastructure. Japan and South Korea are key markets, with Japan's parcel volume reaching 5.031 billion pieces in fiscal 2025, up 0.5% from the prior year.
Parcel Sortation Systems Market Report Regional Market Share
Loading chart...
Parcel Sortation Systems Market Report Regional Market Share
Region
Market Share (%)
Asia-Pacific
0.4%
Europe
0.26%
North America
0.24%
South America
0.05%
Middle East & Africa
0.05%
Europe is the second-largest market, with the United Kingdom and Germany as the largest contributors. Germany's parcel volume reached 4.36 billion pieces and revenue reached EUR 19.19 billion in 2024, per Bundesnetzagentur. The UK benefits from early adoption of sortation centers, with Amazon introducing the concept in 2013. North America remains a significant market, with the United States dominating. The USA Census Bureau reported USD 326.7 billion in first-quarter 2026 e-commerce sales, up 9.8% year-over-year, increasing missed-cutoff exposure and supporting automated material handling projects.
Region
2023 Revenue Share
Growth Outlook
Key Drivers
Asia Pacific
40%
Fastest growing
E-commerce, labor costs
Europe
~26%
Moderate growth
Modernization, regulations
North America
~24%
Steady growth
Labor shortages, e-commerce
South America
~5%
Emerging
Infrastructure investment
Middle East & Africa
~5%
Emerging
Logistics hub development
Labor Shortages and AI-Driven Routing Efficiency
The market is propelled by several converging drivers. E-commerce growth and last-mile delivery demands contribute a +3.0% impact on CAGR, as parcel networks must process a growing mix of small, time-sensitive shipments. Rising labor costs and workforce optimization add +2.0%, particularly in North America and Europe, where persistent shortages of warehouse personnel constrain capacity. Automation and AI integration contribute +1.8%, with AI adoption among large OECD firms rising from 15% in 2020 to about 40% in 2024, supporting machine vision, predictive maintenance, and dynamic routing. Sustainability requirements add +0.8% as logistics buyers assess energy use and vehicle utilization.
However, the market faces restraints. High initial capital investment and ROI considerations have a -1.5% impact on CAGR, as projects are difficult to justify when parcel growth is uncertain. High implementation and maintenance costs add a -1.1% impact, with missing expertise being the leading reason for non-adoption of AI technologies among large EU firms in 2024. Brownfield constraints also delay viable projects when new sorters conflict with available footprint or existing conveyor controls.
Competitive Landscape and Recent Industry Developments
The competitive landscape is moderately concentrated, with the top five players—BEUMER, Dematic (KION), Honeywell Intelligrated, TGW Logistics, and Vanderlande—collectively holding 36.26% market share in 2025. Vanderlande led with over 14.34% market share in 2025. The market favors suppliers that combine robust equipment with controls, lifecycle services, and integration expertise rather than competing solely on sorter speed.
Recent industry developments highlight the shift toward integrated solutions:
January 2026: Dematic commissioned a Bio-Rad Singapore system pairing modular conveyors with intelligent sortation and cloud controls.
February 2026: PostNord selected two Fives GENI Belt sorters for a Swedish terminal planned at 25,000 items per hour, using ten induction lines and nearly 1,000 destinations.
September 2025: USPS introduced a Dallas multi-induct matrix sorter with capacity for 70,000 packages per hour.
April 2025: Daifuku launched full-scale operations at its Hyderabad plant, including case sorters in the local manufacturing lineup.
September 2021: Photonoe s.r.o. unveiled a 3D machine vision system enabling a robot to pick 2,350 parcels per hour.
Trade Dynamics and Cross-Border E-Commerce Flows
While sortation systems are not a traded commodity in the traditional sense, the demand for these systems is deeply intertwined with cross-border e-commerce flows. Global cross-border e-commerce in goods was projected to grow from approximately USD 300 billion to USD 1-2 trillion in merchandise value by 2030, according to World Bank Logistics Performance Index data. This growth increases demand for sortation systems that can maintain accuracy across frequent destination changes and heterogeneous parcel profiles. Universal Postal Union members handle two-thirds of letter-parcel deliveries up to 2 kg, while express operators and postal networks carry a substantial share of cross-border e-commerce flows. Consequently, trade facilitation agreements and customs modernization initiatives indirectly drive investments in high-accuracy sortation infrastructure at international hubs and border facilities.
Parcel Sortation Systems Market Report Regional Market Share
Higher Coverage
Lower Coverage
No Coverage
Parcel Sortation Systems Market Report REPORT HIGHLIGHTS
Research Methodology & Data Sources
Our rigorous research methodology combines multi-layered approaches with comprehensive quality assurance, ensuring precision, accuracy, and reliability in every market analysis.
Primary Research
Conducted 120+ in-depth interviews with senior executives across the parcel sortation value chain, including sortation system OEMs, control software developers, system integrators, and end-user logistics operators.
Primary research accounted for 70–80% of total research effort, ensuring granular insights into procurement criteria, project economics, and technology adoption patterns.
Interviewed stakeholders: Procurement Directors, Operations Managers, Automation Engineers, and Supply Chain VPs from logistics companies, e-commerce retailers, and postal operators.
Engaged with industry associations such as the Material Handling Industry (MHI), the International Association of Baggage Handling Systems (IABHS), and the European Logistics Association (ELA).
Collected quantitative metrics including facility throughput (parcels/hour), sortation accuracy rates, downtime hours, and total cost of ownership (TCO) to inform bottom-up market sizing.
Key Stakeholders Interviewed
Key Stakeholders Interviewed
Stakeholder Role
Interview Share (%)
Procurement Director
30%
Operations Manager
25%
Automation Engineer
25%
Supply Chain VP
20%
Industry Ecosystem Breakdown
Industry Ecosystem Breakdown
Company Type
Representation (%)
Sortation System OEMs
35%
Control Software Developers
20%
System Integrators
25%
End-User Logistics Operators
15%
Component Suppliers
5%
Secondary Research & Industry Benchmarking
Secondary research comprised 20–30% of total effort, drawing from official .gov, .org, and non-profit trade association sources such as the World Bank Logistics Performance Index, International Energy Agency (IEA), Universal Postal Union (UPU), and Bundesnetzagentur.
Utilized standard financial databases including Bloomberg, Factiva, Hoovers, and PitchBook for company-level financials, funding, and M&A activity.
Benchmarked market estimates against macro indicators: e-commerce sales growth (USA Census Bureau), parcel volumes (Japan Ministry of Land, Infrastructure, Transport and Tourism), and AI adoption rates (IEA).
Cross-referenced supplier announcements, product launches, and commissioning reports to validate technology trends and regional demand shifts.
Demand Modeling & Market Estimation
Employed both top-down and bottom-up methodologies simultaneously. Bottom-up built market size from facility-level installations, average system costs, and replacement cycles. Top-down derived market size from total logistics automation spending and sortation share.
Validated via multi-level data triangulation: reconciled supplier revenue estimates, end-user procurement data, and trade flow statistics.
Key quantitative inputs included: number of sortation systems installed annually (derived from commissioning reports), average selling price (ASP) by system type (cross-belt, tilt-tray, shoe), and software/service attach rates.
Demand models segmented by region, end-use vertical, component, and sorter type, with growth rates informed by historical adoption and pipeline analysis.
Data Accuracy & Quality Check
Guaranteed estimated data accuracy level of 85–90%, achieved through rigorous source validation and expert review.
Each data point was cross-verified against at least two independent sources; discrepancies were resolved through follow-up interviews with primary respondents.
Report is updated to the date of purchase, incorporating the latest market developments, financial disclosures, and regulatory changes.
All estimates are presented with confidence intervals and methodology notes, ensuring transparency and allowing clients to assess reliability.
Aspects
Details
Study Period
2020-2034
Base Year
2025
Estimated Year
2026
Forecast Period
2026-2034
Historical Period
2020-2025
Growth Rate
CAGR of 8.4% from 2020-2034
Segmentation
By Component
Hardware
Software
Service
By Type
Linear
Loop
By System Type
Case Sorter
Combo Sorter
Unit Sorter
By End-Use
Logistics
E-Commerce
Airports
Food & Beverages
Pharmaceuticals
General Manufacturing
By Sorting Type
Linear
Circular
Divert
By Geography
North America
USA
Canada
Mexico
Europe
Germany
UK
France
Asia Pacific
China
Japan
South Korea
South America
Brazil
Middle East & Africa
UAE
South Africa
Table of Contents
1. Parcel Sortation Systems Market Report Introduction
1.1. Research Scope
1.2. Market Segmentation
1.3. Research Objective
1.4. Definitions and Assumptions
2. Parcel Sortation Systems Market Report Executive Summary
2.1. Market Snapshot
3. Parcel Sortation Systems Market Report Market Dynamics
3.1. Introduction
3.2. Market Drivers
3.2.1. E-commerce growth and last-mile delivery demands (+3.0% CAGR impact)
3.2.2. Rising labor costs and workforce optimization (+2.0% CAGR impact)
3.2.3. Automation and AI integration in logistics operations (+1.8% CAGR impact)
3.2.4. Sustainability requirements and environmental regulations (+0.8% CAGR impact)
3.3. Market Restrains
3.3.1. High initial capital investment and ROI uncertainty
3.3.4. Shortage of specialized integration and maintenance skills
3.4. Market Trends
3.4.1. Shift from fixed mechanical capacity to software-orchestrated parcel-flow management, AI adoption in routing, predictive maintenance, and machine vision
3.4.2. Rising demand for modular and scalable linear sortation systems
4. Parcel Sortation Systems Market Report Market Factor Analysis
4.1. Porters Five Forces
4.1.1. Bargaining Power of Suppliers
4.1.2. Bargaining Power of Buyers
4.1.3. Threat of New Entrants
4.1.4. Threat of Substitutes
4.1.5. Competitive Rivalry
4.2. PESTEL analysis
4.3. BCG Analysis
4.3.1. Stars (High Growth, High Market Share)
4.3.2. Cash Cows (Low Growth, High Market Share)
4.3.3. Question Mark (High Growth, Low Market Share)
4.3.4. Dogs (Low Growth, Low Market Share)
4.4. Ansoff Matrix Analysis
4.5. Supply Chain Analysis
4.6. Regulatory Landscape
4.7. Current Market Potential and Opportunity Assessment (TAM–SAM–SOM Framework)
4.8. IDI Analyst Note
5. Parcel Sortation Systems Market Report Market Analysis, Insights and Forecast, 2020-2034
5.1. Market Analysis, Insights and Forecast - by Component
5.1.1. Hardware
5.1.2. Software
5.1.3. Service
5.2. Market Analysis, Insights and Forecast - by Type
5.2.1. Linear
5.2.2. Loop
5.3. Market Analysis, Insights and Forecast - by System Type
5.3.1. Case Sorter
5.3.2. Combo Sorter
5.3.3. Unit Sorter
5.4. Market Analysis, Insights and Forecast - by End-Use
5.4.1. Logistics
5.4.2. E-Commerce
5.4.3. Airports
5.4.4. Food & Beverages
5.4.5. Pharmaceuticals
5.4.6. General Manufacturing
5.5. Market Analysis, Insights and Forecast - by Sorting Type
5.5.1. Linear
5.5.2. Circular
5.5.3. Divert
5.6. Market Analysis, Insights and Forecast - by Region
5.6.1. North America
5.6.2. Europe
5.6.3. Asia Pacific
5.6.4. South America
5.6.5. Middle East & Africa
6. Parcel Sortation Systems Market Report North America Market Analysis, Insights and Forecast, 2020-2034
6.1. Market Analysis, Insights and Forecast - by Component
6.1.1. Hardware
6.1.2. Software
6.1.3. Service
6.2. Market Analysis, Insights and Forecast - by Type
6.2.1. Linear
6.2.2. Loop
6.3. Market Analysis, Insights and Forecast - by System Type
6.3.1. Case Sorter
6.3.2. Combo Sorter
6.3.3. Unit Sorter
6.4. Market Analysis, Insights and Forecast - by End-Use
6.4.1. Logistics
6.4.2. E-Commerce
6.4.3. Airports
6.4.4. Food & Beverages
6.4.5. Pharmaceuticals
6.4.6. General Manufacturing
6.5. Market Analysis, Insights and Forecast - by Sorting Type
6.5.1. Linear
6.5.2. Circular
6.5.3. Divert
7. Parcel Sortation Systems Market Report Europe Market Analysis, Insights and Forecast, 2020-2034
7.1. Market Analysis, Insights and Forecast - by Component
7.1.1. Hardware
7.1.2. Software
7.1.3. Service
7.2. Market Analysis, Insights and Forecast - by Type
7.2.1. Linear
7.2.2. Loop
7.3. Market Analysis, Insights and Forecast - by System Type
7.3.1. Case Sorter
7.3.2. Combo Sorter
7.3.3. Unit Sorter
7.4. Market Analysis, Insights and Forecast - by End-Use
7.4.1. Logistics
7.4.2. E-Commerce
7.4.3. Airports
7.4.4. Food & Beverages
7.4.5. Pharmaceuticals
7.4.6. General Manufacturing
7.5. Market Analysis, Insights and Forecast - by Sorting Type
7.5.1. Linear
7.5.2. Circular
7.5.3. Divert
8. Parcel Sortation Systems Market Report Asia Pacific Market Analysis, Insights and Forecast, 2020-2034
8.1. Market Analysis, Insights and Forecast - by Component
8.1.1. Hardware
8.1.2. Software
8.1.3. Service
8.2. Market Analysis, Insights and Forecast - by Type
8.2.1. Linear
8.2.2. Loop
8.3. Market Analysis, Insights and Forecast - by System Type
8.3.1. Case Sorter
8.3.2. Combo Sorter
8.3.3. Unit Sorter
8.4. Market Analysis, Insights and Forecast - by End-Use
8.4.1. Logistics
8.4.2. E-Commerce
8.4.3. Airports
8.4.4. Food & Beverages
8.4.5. Pharmaceuticals
8.4.6. General Manufacturing
8.5. Market Analysis, Insights and Forecast - by Sorting Type
8.5.1. Linear
8.5.2. Circular
8.5.3. Divert
9. Parcel Sortation Systems Market Report South America Market Analysis, Insights and Forecast, 2020-2034
9.1. Market Analysis, Insights and Forecast - by Component
9.1.1. Hardware
9.1.2. Software
9.1.3. Service
9.2. Market Analysis, Insights and Forecast - by Type
9.2.1. Linear
9.2.2. Loop
9.3. Market Analysis, Insights and Forecast - by System Type
9.3.1. Case Sorter
9.3.2. Combo Sorter
9.3.3. Unit Sorter
9.4. Market Analysis, Insights and Forecast - by End-Use
9.4.1. Logistics
9.4.2. E-Commerce
9.4.3. Airports
9.4.4. Food & Beverages
9.4.5. Pharmaceuticals
9.4.6. General Manufacturing
9.5. Market Analysis, Insights and Forecast - by Sorting Type
9.5.1. Linear
9.5.2. Circular
9.5.3. Divert
10. Parcel Sortation Systems Market Report Middle East & Africa Market Analysis, Insights and Forecast, 2020-2034
10.1. Market Analysis, Insights and Forecast - by Component
10.1.1. Hardware
10.1.2. Software
10.1.3. Service
10.2. Market Analysis, Insights and Forecast - by Type
10.2.1. Linear
10.2.2. Loop
10.3. Market Analysis, Insights and Forecast - by System Type
10.3.1. Case Sorter
10.3.2. Combo Sorter
10.3.3. Unit Sorter
10.4. Market Analysis, Insights and Forecast - by End-Use
10.4.1. Logistics
10.4.2. E-Commerce
10.4.3. Airports
10.4.4. Food & Beverages
10.4.5. Pharmaceuticals
10.4.6. General Manufacturing
10.5. Market Analysis, Insights and Forecast - by Sorting Type
10.5.1. Linear
10.5.2. Circular
10.5.3. Divert
11. Parcel Sortation Systems Market Report Competitive Analysis
11.1. Company Profiles
11.1.1. Vanderlande
11.1.1.1. Company Overview
11.1.1.2. Products
11.1.1.3. Company Financials
11.1.1.4. SWOT Analysis
11.1.2. BEUMER Group
11.1.2.1. Company Overview
11.1.2.2. Products
11.1.2.3. Company Financials
11.1.2.4. SWOT Analysis
11.1.3. Dematic (KION Group)
11.1.3.1. Company Overview
11.1.3.2. Products
11.1.3.3. Company Financials
11.1.3.4. SWOT Analysis
11.1.4. Honeywell Intelligrated
11.1.4.1. Company Overview
11.1.4.2. Products
11.1.4.3. Company Financials
11.1.4.4. SWOT Analysis
11.1.5. TGW Logistics
11.1.5.1. Company Overview
11.1.5.2. Products
11.1.5.3. Company Financials
11.1.5.4. SWOT Analysis
11.1.6. Daifuku Co. Ltd.
11.1.6.1. Company Overview
11.1.6.2. Products
11.1.6.3. Company Financials
11.1.6.4. SWOT Analysis
11.1.7. Interroll Holding AG
11.1.7.1. Company Overview
11.1.7.2. Products
11.1.7.3. Company Financials
11.1.7.4. SWOT Analysis
11.1.8. Fives Group
11.1.8.1. Company Overview
11.1.8.2. Products
11.1.8.3. Company Financials
11.1.8.4. SWOT Analysis
11.1.9. KNAPP AG
11.1.9.1. Company Overview
12. Parcel Sortation Systems Market Report Research Methodology
List of Figures
Figure 1: Parcel Sortation Systems Market Report Revenue Breakdown (Billion, %) by Region 2026 & 2034
Figure 2: North America Parcel Sortation Systems Market Report Revenue (Billion), by Component 2026 & 2034
Figure 3: North America Parcel Sortation Systems Market Report Revenue Share (%), by Component 2026 & 2034
Figure 4: North America Parcel Sortation Systems Market Report Revenue (Billion), by Type 2026 & 2034
Figure 5: North America Parcel Sortation Systems Market Report Revenue Share (%), by Type 2026 & 2034
Figure 6: North America Parcel Sortation Systems Market Report Revenue (Billion), by System Type 2026 & 2034
Figure 7: North America Parcel Sortation Systems Market Report Revenue Share (%), by System Type 2026 & 2034
Figure 8: North America Parcel Sortation Systems Market Report Revenue (Billion), by End-Use 2026 & 2034
Figure 9: North America Parcel Sortation Systems Market Report Revenue Share (%), by End-Use 2026 & 2034
Figure 10: North America Parcel Sortation Systems Market Report Revenue (Billion), by Sorting Type 2026 & 2034
Figure 11: North America Parcel Sortation Systems Market Report Revenue Share (%), by Sorting Type 2026 & 2034
Figure 12: North America Parcel Sortation Systems Market Report Revenue (Billion), by Country 2026 & 2034
Figure 13: North America Parcel Sortation Systems Market Report Revenue Share (%), by Country 2026 & 2034
Figure 14: Europe Parcel Sortation Systems Market Report Revenue (Billion), by Component 2026 & 2034
Figure 15: Europe Parcel Sortation Systems Market Report Revenue Share (%), by Component 2026 & 2034
List of Tables
Table 1: Parcel Sortation Systems Market Report Revenue Billion Forecast, by Component 2020 & 2034
Table 2: Parcel Sortation Systems Market Report Revenue Billion Forecast, by Type 2020 & 2034
Table 3: Parcel Sortation Systems Market Report Revenue Billion Forecast, by System Type 2020 & 2034
Table 4: Parcel Sortation Systems Market Report Revenue Billion Forecast, by End-Use 2020 & 2034
Table 5: Parcel Sortation Systems Market Report Revenue Billion Forecast, by Sorting Type 2020 & 2034
Table 6: Parcel Sortation Systems Market Report Revenue Billion Forecast, by Region 2020 & 2034
Table 7: North America Parcel Sortation Systems Market Report Revenue Billion Forecast, by Component 2020 & 2034
Table 8: North America Parcel Sortation Systems Market Report Revenue Billion Forecast, by Type 2020 & 2034
Table 9: North America Parcel Sortation Systems Market Report Revenue Billion Forecast, by System Type 2020 & 2034
Table 10: North America Parcel Sortation Systems Market Report Revenue Billion Forecast, by End-Use 2020 & 2034
Table 11: North America Parcel Sortation Systems Market Report Revenue Billion Forecast, by Sorting Type 2020 & 2034
Table 12: North America Parcel Sortation Systems Market Report Revenue Billion Forecast, by Country 2020 & 2034
Table 13: USA Parcel Sortation Systems Market Report Revenue (Billion) Forecast, by Application 2020 & 2034
Table 14: Canada Parcel Sortation Systems Market Report Revenue (Billion) Forecast, by Application 2020 & 2034
Table 15: Mexico Parcel Sortation Systems Market Report Revenue (Billion) Forecast, by Application 2020 & 2034
Frequently Asked Questions
1. What is the parcel sortation systems market size in 2025?
The global parcel sortation systems market was valued at USD 3.7 billion in 2025 and is projected to reach USD 8.3 billion by 2035 at an 8.4% CAGR.
2. Which region dominates the parcel sortation systems market?
Asia Pacific dominated with a 40% revenue share in 2023 and is also the fastest-growing region, driven by e-commerce expansion and labor cost pressures.
3. What are the key drivers of the parcel sortation systems market?
E-commerce growth (+3.0% CAGR impact), rising labor costs (+2.0%), automation and AI integration (+1.8%), and sustainability requirements (+0.8%) are the primary drivers.
4. Who are the leading players in the parcel sortation systems market?
The top five players—BEUMER, Dematic (KION), Honeywell Intelligrated, TGW Logistics, and Vanderlande—held 36.26% market share in 2025, with Vanderlande leading at over 14.34%.
5. What is the impact of high initial capital investment on the market?
High initial capital investment and ROI considerations have a -1.5% impact on CAGR, as projects are difficult to justify when parcel growth is uncertain or utilization cannot recover fixed costs.
6. Which component segment is growing fastest?
Software is the fastest-growing component at 9.3% CAGR, valued at USD 884.2 million in 2025, as operators add intelligence to installed mechanical assets.
11.1.9.2. Products
11.1.9.3. Company Financials
11.1.9.4. SWOT Analysis
11.1.10. Siemens Logistics GmbH
11.1.10.1. Company Overview
11.1.10.2. Products
11.1.10.3. Company Financials
11.1.10.4. SWOT Analysis
11.1.11. Bastian Solutions LLC
11.1.11.1. Company Overview
11.1.11.2. Products
11.1.11.3. Company Financials
11.1.11.4. SWOT Analysis
11.1.12. Murata Machinery Ltd.
11.1.12.1. Company Overview
11.1.12.2. Products
11.1.12.3. Company Financials
11.1.12.4. SWOT Analysis
11.1.13. Okura Yusoki Co. Ltd
11.1.13.1. Company Overview
11.1.13.2. Products
11.1.13.3. Company Financials
11.1.13.4. SWOT Analysis
11.1.14. GreyOrange
11.1.14.1. Company Overview
11.1.14.2. Products
11.1.14.3. Company Financials
11.1.14.4. SWOT Analysis
11.1.15. Intralox L.L.C
11.1.15.1. Company Overview
11.1.15.2. Products
11.1.15.3. Company Financials
11.1.15.4. SWOT Analysis
11.1.16. Invata Intralogistics
11.1.16.1. Company Overview
11.1.16.2. Products
11.1.16.3. Company Financials
11.1.16.4. SWOT Analysis
11.1.17. Alstef Automation S.A
11.1.17.1. Company Overview
11.1.17.2. Products
11.1.17.3. Company Financials
11.1.17.4. SWOT Analysis
11.1.18. Autotech Private Limited
11.1.18.1. Company Overview
11.1.18.2. Products
11.1.18.3. Company Financials
11.1.18.4. SWOT Analysis
11.1.19. Böwe Systec GmbH
11.1.19.1. Company Overview
11.1.19.2. Products
11.1.19.3. Company Financials
11.1.19.4. SWOT Analysis
11.1.20. Equinox
11.1.20.1. Company Overview
11.1.20.2. Products
11.1.20.3. Company Financials
11.1.20.4. SWOT Analysis
11.1.21. Falcon Fives
11.1.21.1. Company Overview
11.1.21.2. Products
11.1.21.3. Company Financials
11.1.21.4. SWOT Analysis
11.1.22. GBI Intralogistics Inc
11.1.22.1. Company Overview
11.1.22.2. Products
11.1.22.3. Company Financials
11.1.22.4. SWOT Analysis
11.1.23. Photonoe s.r.o.
11.1.23.1. Company Overview
11.1.23.2. Products
11.1.23.3. Company Financials
11.1.23.4. SWOT Analysis
11.2. Market Entropy
11.2.1. Company's Key Areas Served
11.2.2. Recent Developments
11.3. Company Market Share Analysis, 2026
11.3.1. Top 5 Companies Market Share Analysis
11.3.2. Top 3 Companies Market Share Analysis
11.4. List of Potential Customers
Figure 16: Europe Parcel Sortation Systems Market Report Revenue (Billion), by Type 2026 & 2034
Figure 17: Europe Parcel Sortation Systems Market Report Revenue Share (%), by Type 2026 & 2034
Figure 18: Europe Parcel Sortation Systems Market Report Revenue (Billion), by System Type 2026 & 2034
Figure 19: Europe Parcel Sortation Systems Market Report Revenue Share (%), by System Type 2026 & 2034
Figure 20: Europe Parcel Sortation Systems Market Report Revenue (Billion), by End-Use 2026 & 2034
Figure 21: Europe Parcel Sortation Systems Market Report Revenue Share (%), by End-Use 2026 & 2034
Figure 22: Europe Parcel Sortation Systems Market Report Revenue (Billion), by Sorting Type 2026 & 2034
Figure 23: Europe Parcel Sortation Systems Market Report Revenue Share (%), by Sorting Type 2026 & 2034
Figure 24: Europe Parcel Sortation Systems Market Report Revenue (Billion), by Country 2026 & 2034
Figure 25: Europe Parcel Sortation Systems Market Report Revenue Share (%), by Country 2026 & 2034
Figure 26: Asia Pacific Parcel Sortation Systems Market Report Revenue (Billion), by Component 2026 & 2034
Figure 27: Asia Pacific Parcel Sortation Systems Market Report Revenue Share (%), by Component 2026 & 2034
Figure 28: Asia Pacific Parcel Sortation Systems Market Report Revenue (Billion), by Type 2026 & 2034
Figure 29: Asia Pacific Parcel Sortation Systems Market Report Revenue Share (%), by Type 2026 & 2034
Figure 30: Asia Pacific Parcel Sortation Systems Market Report Revenue (Billion), by System Type 2026 & 2034
Figure 31: Asia Pacific Parcel Sortation Systems Market Report Revenue Share (%), by System Type 2026 & 2034
Figure 32: Asia Pacific Parcel Sortation Systems Market Report Revenue (Billion), by End-Use 2026 & 2034
Figure 33: Asia Pacific Parcel Sortation Systems Market Report Revenue Share (%), by End-Use 2026 & 2034
Figure 34: Asia Pacific Parcel Sortation Systems Market Report Revenue (Billion), by Sorting Type 2026 & 2034
Figure 35: Asia Pacific Parcel Sortation Systems Market Report Revenue Share (%), by Sorting Type 2026 & 2034
Figure 36: Asia Pacific Parcel Sortation Systems Market Report Revenue (Billion), by Country 2026 & 2034
Figure 37: Asia Pacific Parcel Sortation Systems Market Report Revenue Share (%), by Country 2026 & 2034
Figure 38: South America Parcel Sortation Systems Market Report Revenue (Billion), by Component 2026 & 2034
Figure 39: South America Parcel Sortation Systems Market Report Revenue Share (%), by Component 2026 & 2034
Figure 40: South America Parcel Sortation Systems Market Report Revenue (Billion), by Type 2026 & 2034
Figure 41: South America Parcel Sortation Systems Market Report Revenue Share (%), by Type 2026 & 2034
Figure 42: South America Parcel Sortation Systems Market Report Revenue (Billion), by System Type 2026 & 2034
Figure 43: South America Parcel Sortation Systems Market Report Revenue Share (%), by System Type 2026 & 2034
Figure 44: South America Parcel Sortation Systems Market Report Revenue (Billion), by End-Use 2026 & 2034
Figure 45: South America Parcel Sortation Systems Market Report Revenue Share (%), by End-Use 2026 & 2034
Figure 46: South America Parcel Sortation Systems Market Report Revenue (Billion), by Sorting Type 2026 & 2034
Figure 47: South America Parcel Sortation Systems Market Report Revenue Share (%), by Sorting Type 2026 & 2034
Figure 48: South America Parcel Sortation Systems Market Report Revenue (Billion), by Country 2026 & 2034
Figure 49: South America Parcel Sortation Systems Market Report Revenue Share (%), by Country 2026 & 2034
Figure 50: Middle East & Africa Parcel Sortation Systems Market Report Revenue (Billion), by Component 2026 & 2034
Figure 51: Middle East & Africa Parcel Sortation Systems Market Report Revenue Share (%), by Component 2026 & 2034
Figure 52: Middle East & Africa Parcel Sortation Systems Market Report Revenue (Billion), by Type 2026 & 2034
Figure 53: Middle East & Africa Parcel Sortation Systems Market Report Revenue Share (%), by Type 2026 & 2034
Figure 54: Middle East & Africa Parcel Sortation Systems Market Report Revenue (Billion), by System Type 2026 & 2034
Figure 55: Middle East & Africa Parcel Sortation Systems Market Report Revenue Share (%), by System Type 2026 & 2034
Figure 56: Middle East & Africa Parcel Sortation Systems Market Report Revenue (Billion), by End-Use 2026 & 2034
Figure 57: Middle East & Africa Parcel Sortation Systems Market Report Revenue Share (%), by End-Use 2026 & 2034
Figure 58: Middle East & Africa Parcel Sortation Systems Market Report Revenue (Billion), by Sorting Type 2026 & 2034
Figure 59: Middle East & Africa Parcel Sortation Systems Market Report Revenue Share (%), by Sorting Type 2026 & 2034
Figure 60: Middle East & Africa Parcel Sortation Systems Market Report Revenue (Billion), by Country 2026 & 2034
Figure 61: Middle East & Africa Parcel Sortation Systems Market Report Revenue Share (%), by Country 2026 & 2034
Table 16: Europe Parcel Sortation Systems Market Report Revenue Billion Forecast, by Component 2020 & 2034
Table 17: Europe Parcel Sortation Systems Market Report Revenue Billion Forecast, by Type 2020 & 2034
Table 18: Europe Parcel Sortation Systems Market Report Revenue Billion Forecast, by System Type 2020 & 2034
Table 19: Europe Parcel Sortation Systems Market Report Revenue Billion Forecast, by End-Use 2020 & 2034
Table 20: Europe Parcel Sortation Systems Market Report Revenue Billion Forecast, by Sorting Type 2020 & 2034
Table 21: Europe Parcel Sortation Systems Market Report Revenue Billion Forecast, by Country 2020 & 2034
Table 22: Germany Parcel Sortation Systems Market Report Revenue (Billion) Forecast, by Application 2020 & 2034
Table 23: UK Parcel Sortation Systems Market Report Revenue (Billion) Forecast, by Application 2020 & 2034
Table 24: France Parcel Sortation Systems Market Report Revenue (Billion) Forecast, by Application 2020 & 2034
Table 25: Asia Pacific Parcel Sortation Systems Market Report Revenue Billion Forecast, by Component 2020 & 2034
Table 26: Asia Pacific Parcel Sortation Systems Market Report Revenue Billion Forecast, by Type 2020 & 2034
Table 27: Asia Pacific Parcel Sortation Systems Market Report Revenue Billion Forecast, by System Type 2020 & 2034
Table 28: Asia Pacific Parcel Sortation Systems Market Report Revenue Billion Forecast, by End-Use 2020 & 2034
Table 29: Asia Pacific Parcel Sortation Systems Market Report Revenue Billion Forecast, by Sorting Type 2020 & 2034
Table 30: Asia Pacific Parcel Sortation Systems Market Report Revenue Billion Forecast, by Country 2020 & 2034
Table 31: China Parcel Sortation Systems Market Report Revenue (Billion) Forecast, by Application 2020 & 2034
Table 32: Japan Parcel Sortation Systems Market Report Revenue (Billion) Forecast, by Application 2020 & 2034
Table 33: South Korea Parcel Sortation Systems Market Report Revenue (Billion) Forecast, by Application 2020 & 2034
Table 34: South America Parcel Sortation Systems Market Report Revenue Billion Forecast, by Component 2020 & 2034
Table 35: South America Parcel Sortation Systems Market Report Revenue Billion Forecast, by Type 2020 & 2034
Table 36: South America Parcel Sortation Systems Market Report Revenue Billion Forecast, by System Type 2020 & 2034
Table 37: South America Parcel Sortation Systems Market Report Revenue Billion Forecast, by End-Use 2020 & 2034
Table 38: South America Parcel Sortation Systems Market Report Revenue Billion Forecast, by Sorting Type 2020 & 2034
Table 39: South America Parcel Sortation Systems Market Report Revenue Billion Forecast, by Country 2020 & 2034
Table 40: Brazil Parcel Sortation Systems Market Report Revenue (Billion) Forecast, by Application 2020 & 2034
Table 41: Middle East & Africa Parcel Sortation Systems Market Report Revenue Billion Forecast, by Component 2020 & 2034
Table 42: Middle East & Africa Parcel Sortation Systems Market Report Revenue Billion Forecast, by Type 2020 & 2034
Table 43: Middle East & Africa Parcel Sortation Systems Market Report Revenue Billion Forecast, by System Type 2020 & 2034
Table 44: Middle East & Africa Parcel Sortation Systems Market Report Revenue Billion Forecast, by End-Use 2020 & 2034
Table 45: Middle East & Africa Parcel Sortation Systems Market Report Revenue Billion Forecast, by Sorting Type 2020 & 2034
Table 46: Middle East & Africa Parcel Sortation Systems Market Report Revenue Billion Forecast, by Country 2020 & 2034
Table 47: UAE Parcel Sortation Systems Market Report Revenue (Billion) Forecast, by Application 2020 & 2034
Table 48: South Africa Parcel Sortation Systems Market Report Revenue (Billion) Forecast, by Application 2020 & 2034