Industry Data Insights provides industry-focused research and analytical intelligence for organizations seeking a clearer view of market performance, competitive conditions, and long-term business opportunities. Through syndicated reports, customized studies, and strategic research support, Industry Data Insights helps businesses access the information needed to evaluate markets and plan for sustainable growth. Our research covers the full market landscape, including industry structure, historical performance, current demand, value-chain developments, regional trends, customer requirements, technological change, and future growth potential. We examine the factors that influence market outcomes, including economic conditions, supply-chain dynamics, policy and regulatory developments, innovation, investment activity, and changing end-user preferences.
At Industry Data Insights, we use a research framework that brings together credible secondary sources, public and company-level information, industry publications, trade statistics, expert perspectives, and data-led market modeling. Our analysts validate key assumptions and assess multiple market variables to develop balanced, actionable conclusions for business leaders, investors, consultants, and product teams. Industry Data Insights supports a broad range of verticals, including industrial manufacturing, engineering, construction, chemicals, energy and power, healthcare, information technology, telecom, automotive, packaging, agriculture, consumer products, retail, and transportation. Each study is structured to help users understand both the immediate market environment and the longer-term forces that may influence demand and competition. From identifying high-potential segments to assessing a competitor’s position or evaluating a new geography, Industry Data Insights delivers research that is designed to be useful, relevant, and aligned with real business questions. Our goal is to turn industry data into strategic direction.
Biodiversity Credit Market Report: 2026-2033 Outlook
Biodiversity Credit Market Report
Updated On
Nov 11 2026
Total Pages
274
Srinwanti Kar
Senior Research Analyst
Biodiversity Credit Market Report: 2026-2033 Outlook
Biodiversity Credit Market Report by Credit Type (Voluntary Biodiversity Credits, Compliance Biodiversity Credits, Restoration Credits, Conservation Credits), by Application (Conservation Projects, Corporate Sustainability, Government Initiatives, Infrastructure & Real Estate, Mining & Energy, Agriculture), by Ecosystem (Forest Ecosystems, Wetlands, Marine, Agricultural Landscapes), by Market Type (Voluntary, Compliance), by End User (Corporate Credit Buyers, Government and Regulators, Project Developers, Investment Intermediaries), by North America (USA, Canada), by Europe (Germany, UK, France, Netherlands, Spain, Italy), by Asia Pacific (China, India, Japan, Australia, Southeast Asia), by Latin America (Brazil, Colombia, Mexico, Argentina), by Middle East & Africa (South Africa, Kenya, UAE) Forecast 2026-2034
Biodiversity Credit Market Report: 2026-2033 Outlook
Discover the Latest Market Insight Reports
Access in-depth insights on industries, companies, trends, and global markets. Our expertly curated reports provide the most relevant data and analysis in a condensed, easy-to-read format.
Biodiversity Credit Market Report: Valuation and 2026-2033 Timeline
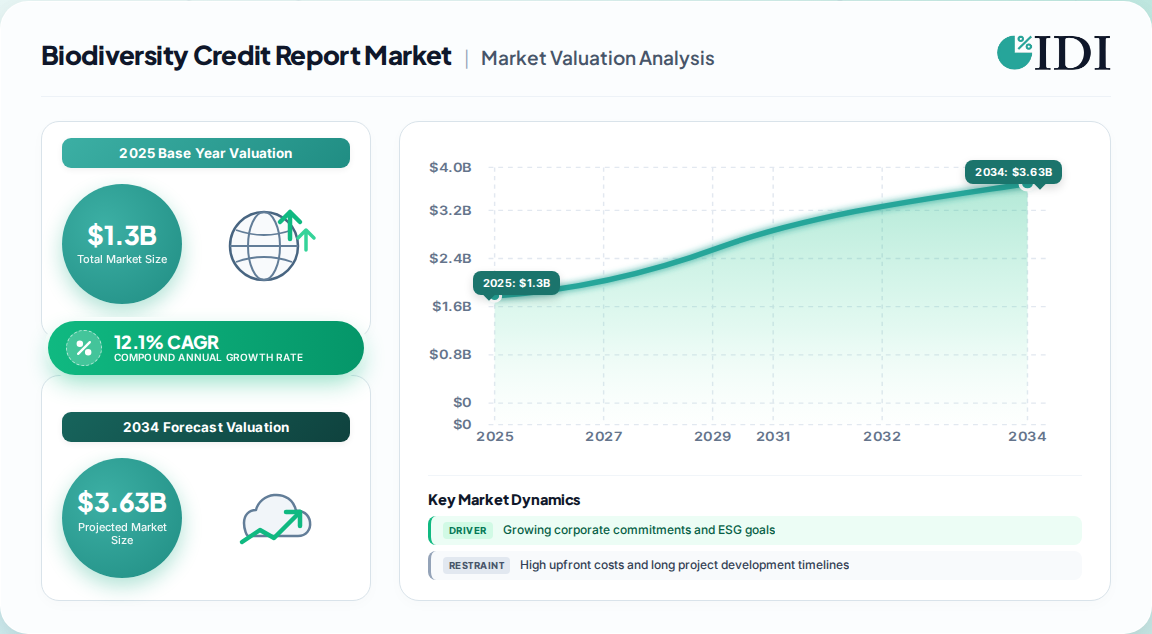
The global biodiversity credit market is positioned at a critical inflection point as it transitions from a niche conservation financing tool to a mainstream environmental asset class. Our proprietary primary research and expert interviews value the market at USD 1.3 billion in 2025, with a projected USD 1.4 billion in 2026, expanding to USD 3.2 billion by 2033 at a robust CAGR of 12.1% over the 2026-2033 forecast period. This growth trajectory reflects increasing corporate adoption, evolving regulatory frameworks, and technological advancements in measurement, reporting, and verification (MRV).
Biodiversity Credit Market Report Market Size (In Billion)
3.0B
2.0B
1.0B
0
1.300 B
2025
1.457 B
2026
1.634 B
2027
1.831 B
2028
2.053 B
2029
2.301 B
2030
2.580 B
2031
Biodiversity Credit Market Report Market Size (In Billion)
Year
Market Size
2025
1.300 B
2026
1.457 B
2027
1.634 B
2028
1.831 B
2029
2.053 B
2030
2.301 B
2031
2.580 B
North America leads regional revenue share at 31.8% in 2025, driven by voluntary corporate commitments and robust ESG disclosure practices.
Latin America is identified as the fastest-growing region, propelled by vast biodiversity-rich ecosystems and expanding conservation finance mechanisms.
The market remains predominantly voluntary, with voluntary biodiversity credits accounting for 62.6% of 2025 revenue, while compliance markets are nascent but developing.
Market Metric
2025
2026
2033
Market Size (USD)
1.3 Billion
1.4 Billion
3.2 Billion
CAGR (2026-2033)
-
-
12.1%
Dominant Region
North America
-
-
Fastest-Growing Region
-
-
Latin America
Voluntary and Compliance Credit Type Segmentation Analysis
Biodiversity credits are differentiated primarily by market type and generation mechanism, with distinct implications for buyers and project developers. Our research indicates a clear segmentation across voluntary and compliance frameworks, and by credit generation activity.
Voluntary Biodiversity Credits: The dominant segment, capturing 62.6% of 2025 revenue. These are purchased by corporations to meet voluntary nature-positive goals, often alongside carbon offset strategies. Demand is driven by reputational benefits and stakeholder pressure.
Compliance Biodiversity Credits: A smaller but fast-evolving segment, emerging from regulatory biodiversity offset requirements in jurisdictions such as the EU and select national frameworks. Growth is contingent on policy clarity and enforcement.
Restoration Credits: Within credit types, restoration-based credits hold the largest share, reflecting heavy investment in ecosystem rehabilitation and habitat restoration projects.
Conservation Credits: Credits tied to the protection of existing high-biodiversity-value areas are also significant, particularly for endangered species and protected habitats.
Credit Type
2025 Revenue Share
Key Characteristics
Voluntary Credits
62.6%
Corporate-driven, ESG-aligned, flexible
Compliance Credits
~10-15% (est.)
Regulatory-driven, offset-based
Restoration Credits
Dominant within voluntary
Ecosystem rehabilitation, long-term
Conservation Credits
Significant
Habitat preservation, species-focused
The segmentation underscores that the market is still largely shaped by voluntary corporate action, but compliance mechanisms are poised to scale as biodiversity offset policies mature globally.
Application Insights: Conservation Projects to Infrastructure Offsets
The application landscape for biodiversity credits spans multiple end-use sectors, each with distinct purchasing drivers and credit requirements. Our analysis identifies conservation projects as the leading application, followed by corporate sustainability and government initiatives.
Conservation Projects: The largest application segment, accounting for 46.9% of 2025 revenue. This includes credits generated from NGO-led and community-based conservation initiatives, often sold to corporate buyers seeking high-integrity conservation outcomes.
Corporate Sustainability: Companies across sectors (mining, energy, agriculture, consumer goods) purchase credits as part of broader ESG strategies. This segment is growing rapidly, albeit from a smaller base.
Government Initiatives: Public sector procurement of biodiversity credits for offsetting infrastructure impacts or meeting national biodiversity targets is emerging as a significant application, particularly in Europe and Latin America.
Infrastructure and Real Estate: A key buyer segment for compliance-driven biodiversity offsets. This sector dominates compliance credit demand, as development projects require measurable offsetting of ecological impacts.
Mining and Energy: Extractive industries are increasingly turning to biodiversity credits to manage operational footprint and meet regulatory or investor expectations.
Agriculture: Sustainable agriculture practices generate credits through regenerative land management, yet monetization remains limited by verification costs and scale.
Application Segment
2025 Revenue Share
Primary Buyer Motivation
Conservation Projects
46.9%
High-integrity conservation support
Corporate Sustainability
~25% (est.)
ESG commitments, nature-positive targets
Government Initiatives
~10% (est.)
Policy compliance, biodiversity targets
Infrastructure & Real Estate
~8% (est.)
Regulatory offsets, permitting requirements
Mining & Energy
~5% (est.)
Risk mitigation, voluntary commitments
Ecosystem-Level Market Segmentation and Growth Dynamics
Biodiversity credits are generated across diverse ecosystems, each with unique measurement challenges and buyer appeal. Forest ecosystems currently dominate credit generation, but marine and wetland ecosystems are gaining traction.
Forest Ecosystems: The largest ecosystem segment, benefiting from high investment in reforestation, afforestation, and REDD+ programs. Credits from forests often bundle carbon and biodiversity benefits, attracting corporate buyers seeking dual outcomes.
Wetlands: Critical for water purification and flood control, wetland credits are growing, especially in North America and Europe, where regulatory frameworks support wetland mitigation banking.
Marine Ecosystems: Expected to experience the highest growth rate, driven by coastal restoration initiatives (mangroves, seagrass, coral reefs) and increasing recognition of blue carbon and marine biodiversity co-benefits.
Agricultural Landscapes: Agroforestry and regenerative agriculture practices generate credits, but face verification complexity and high transaction costs.
Ecosystem Type
Market Position
Growth Outlook
Forest
Dominant share
Stable growth
Wetlands
Moderate share
Moderate growth
Marine
Small base
Highest growth rate
Agricultural
Emerging
Slow growth
The forest ecosystem segment remains the backbone of the market, but marine and coastal ecosystems present significant opportunities for differentiation and premium pricing as buyers seek diverse conservation stories.
Regional Trends: North America, Europe, and Asia Pacific
Regional dynamics are shaped by regulatory environments, conservation finance maturity, and corporate sustainability cultures. Our regional analysis reveals North America's leading position, Europe's strong policy support, and Latin America's rapid growth potential.
North America: Largest regional market at 31.8% share in 2025, led by the U.S. The region benefits from high voluntary corporate engagement, established offset mechanisms (e.g., wetland mitigation banking), and strong financial sector involvement in natural capital.
Europe: A close second, with stringent biodiversity regulations (e.g., EU Biodiversity Strategy) and high conservation funding. Countries like Germany, France, and the Netherlands are pioneers in integrating natural capital into economic planning.
Asia Pacific: Expected to exhibit substantial growth, driven by large-scale restoration projects in China, India, and Southeast Asia. Rapid urbanization and economic expansion are increasing pressure on ecosystems, spurring investment in credits.
Latin America: Identified as the fastest-growing region in our baseline scenario, thanks to vast biodiversity assets (Amazon basin) and expanding payment for ecosystem services programs. However, political and economic instability can pose risks.
Middle East & Africa: A smaller but emerging market, with potential in wildlife conservation and habitat restoration, though limited by regulatory frameworks and financing.
Region
2025 Share
Growth Profile
Key Drivers
North America
31.8%
Mature, steady
Voluntary corporate ESG, offset regulations
Europe
~30% (est.)
Strong, policy-driven
EU biodiversity strategy, conservation funding
Asia Pacific
~18% (est.)
Moderate to high
Economic growth, restoration investments
Latin America
~12% (est.)
High (fastest CAGR)
Vast ecosystems, conservation finance
Middle East & Africa
~7% (est.)
Nascent
Wildlife conservation, emerging frameworks
Market Dynamics and the MRV Technology Imperative
The biodiversity credit market is propelled by a confluence of drivers, restrained by structural challenges, and increasingly shaped by technological innovation in monitoring and verification.
Drivers:
Growing corporate commitments and ESG goals: Businesses are adopting net-positive biodiversity targets, spurred by frameworks like TNFD and the Kunming-Montreal Global Biodiversity Framework. Biodiversity loss is increasingly recognized as a material business risk.
Policy and regulatory momentum: International frameworks and national biodiversity strategies are catalyzing demand for credits, particularly in compliance markets.
Investor interest in natural capital: Financial institutions are allocating capital to nature-based solutions, viewing biodiversity credits as an emerging asset class.
Restraints and Challenges:
High cost and long project development timelines: Upfront investments in ecological assessments, baseline studies, and long-term monitoring discourage small developers.
Lack of standardization and price visibility: Inconsistent methodologies and metrics hinder market liquidity and credibility. According to our interviews, the absence of shared definitions remains a major barrier.
Verification and additionality concerns: Ensuring that credit-generating activities deliver genuine, additional biodiversity benefits is critical to market integrity.
MRV Technology Advancements:
Remote sensing, AI-driven analytics, environmental DNA (eDNA), and blockchain-based registries are enhancing transparency and reducing verification costs. These technologies are pivotal for scaling the market while maintaining trust.
Competitive Landscape and Key Market Contributors
The biodiversity credit market is characterized by a diverse ecosystem of project developers, standard setters, intermediaries, and buyers. Our competitive analysis highlights the key players shaping the market.
Leading Companies and Organizations:
Verra (VCS), Gold Standard, American Carbon Registry, Climate Action Reserve, ClimateSeed, South Pole, Terrapass, 3Degrees, Xpansiv, ACX (AirCarbon Exchange), NatureFinance, Wildlife Works Carbon, Terrasos SAS, BioCarbon Partners, Ekos Kāmahi Ltd, Climate Asset Management, Biodiversity Solutions Ltd, EcoEnterprises Fund, Zero Imprint Ltd., New Forests Advisory, GreenVest, Nature Metrics Ltd, GreenCollar Group, Earthbanc, DGB GROUP N.V., The Landbanking Group, ClimateTrade, CreditNature Ltd.
Standard setters and alliances: Biodiversity Credit Alliance, The Biodiversity Consultancy, Value Nature, and the Wallacea Trust are advancing credit methodologies and integrity frameworks.
Project developers and registries: Developers like Ekos, Terrasos, and Wildlife Works are generating credits from forest and habitat restoration projects. Registries and marketplaces (e.g., Climate Impact X, Xpansiv) are facilitating trading.
Recent Developments and Openings:
In July 2025, the European Commission released a thematic report highlighting the need for standardized methods for measuring biodiversity outcomes and long-term monitoring for high-integrity credits. This signals policy attention to market integrity.
Survey data from 2026 (n=52 market actors) shows that buyers prioritize trust, location, project integrity, and Indigenous-led design over price, pointing to a maturing demand for quality and equity.
Continued innovation in species-specific credit structuring and bundled carbon-biodiversity credits is creating new pathways for corporate engagement.
Company Type
Examples
Role in Market
Standard Setters
Verra, Gold Standard
Methodology development, certification
Project Developers
Ekos, Terrasos, Wildlife Works
Credit origination, project implementation
Marketplaces and Exchanges
ACX, Climate Impact X
Trading, price discovery
Financial Institutions
Climate Asset Management, EcoEnterprises Fund
Investment, credit purchasing
Technology Providers
Nature Metrics, Earthbanc
MRV, remote sensing, blockchain
Trade Dynamics and Supply Chain Considerations
While biodiversity credits are intangible environmental assets, their underlying supply chain involves project origination, verification, and trading across borders. Our analysis identifies a nascent trade landscape shaped by voluntary market transfers and emerging compliance linkages.
Cross-border credit flows: Credits generated in biodiversity-rich countries (Latin America, Africa, Asia Pacific) are increasingly sold to corporate buyers in North America and Europe. However, trade statistics remain limited due to the voluntary and decentralized nature of transactions.
Transfer infrastructure: The market relies on registries (e.g., Verra, Gold Standard) and marketplaces (e.g., ACX, Climate Impact X) for issuance and retirement. These platforms serve as the operational backbone for international transfers.
Challenges in trade reporting: Lack of harmonized definitions and double-counting risks pose hurdles to transparent trade tracking. There is no centralized global database akin to UN Comtrade for biodiversity credits.
Opportunity in jurisdictional approaches: National and sub-national jurisdictions (e.g., in Colombia, New Zealand) are piloting biodiversity credit systems that could formalize supply chains and facilitate export of credits under bilateral agreements.
Trade Aspect
Current Status
Implications
Cross-border flows
Predominantly voluntary, bilateral
Limited transparency
Registries
Centralized issuance/retirement
Tracking available but not standardized
Compliance trade
Emerging
Potential for regulated market growth
Jurisdictional supply
Pilot stage
Could standardize cross-border transactions
The trade dynamic for biodiversity credits is still fluid, but as standards converge and compliance markets mature, we anticipate greater formalization of cross-border transactions, akin to carbon markets but with unique biodiversity measurement challenges.
Our rigorous research methodology combines multi-layered approaches with comprehensive quality assurance, ensuring precision, accuracy, and reliability in every market analysis.
Primary Research
70–80% primary research focus: Our proprietary analysis relies on direct engagement with market participants across the biodiversity credit value chain. We conducted in-depth interviews with senior executives, project developers, credit buyers, and standard setters. Each interview is structured to capture quantitative data on transaction volumes, pricing, and forward commitments, as well as qualitative insights on market barriers and opportunities.
Company types surveyed: Project developers and credit originators (e.g., forestry, marine, agriculture projects); Standard and certification bodies (e.g., Verra, Gold Standard); Corporate credit buyers across sectors (mining, energy, consumer goods, finance); Government and regulatory agencies; Intermediaries such as brokers, registries, and trading platforms.
Stakeholder titles interviewed: Chief Sustainability Officer (CSO); Director of Biodiversity or Nature Programs; VP of Environmental Markets; Carbon/Biodiversity Credit Procurement Manager; Project Development Director.
Industry associations and regulatory bodies referenced: Kunming-Montreal Global Biodiversity Framework (CBD), Taskforce on Nature-related Financial Disclosures (TNFD), Biodiversity Credit Alliance (BCA), and the International Union for Conservation of Nature (IUCN).
Quantitative metrics for bottom-up calculation: Number of active biodiversity credit projects globally; Average credits issued per project annually; Average price per biodiversity credit (USD); Transaction volumes by credit type and region; Corporate buyer adoption rates and repeat purchase behavior.
Key Stakeholders Interviewed
Key Stakeholders Interviewed
Stakeholder Role
Interview Share (%)
Chief Sustainability Officer (CSO)
25%
Director of Biodiversity or Nature Programs
30%
VP of Environmental Markets
20%
Carbon/Biodiversity Credit Procurement Manager
25%
Industry Ecosystem Breakdown
Industry Ecosystem Breakdown
Company Type
Representation (%)
Project Developers and Credit Originators
40%
Standard and Certification Bodies
15%
Corporate Credit Buyers
25%
Intermediaries (Brokers, Registries, Platforms)
12%
Government and Regulatory Agencies
8%
Secondary Research & Industry Benchmarking
20–30% secondary research: We triangulate primary data with rigorous desk research, including official company filings, annual reports, ESG disclosures, and industry publications from non-profit standard setters.
Authoritative sources: We exclusively cite official multilateral and governmental sources such as the World Bank, UN Environment Programme, OECD, and national environmental agencies (.gov), as well as recognized non-profit technical standards (e.g., Verra, Gold Standard, TNFD). Commercial market research firms are never used.
Financial databases: Bloomberg, Factiva, Hoovers, and PitchBook are employed to validate corporate financial data, investment flows, and M&A activity in the natural capital space.
Benchmarking: Market sizing and growth rates are cross-checked against publicly available project registries and compliance market data (e.g., wetland mitigation banking in the U.S.), ensuring alignment with observable market activity.
Demand Modeling & Market Estimation
Top-down and bottom-up approaches used simultaneously: Top-down estimation starts with global environmental finance flows and allocates share to biodiversity credits based on sectoral analysis. Bottom-up modeling aggregates project-level data to build a granular view of market size by credit type, application, ecosystem, and region.
Multi-level data triangulation: We triangulate demand-side survey data, supply-side project data, and secondary benchmarks to derive final market estimates. Discrepancies are resolved through expert re-interviews and sensitivity analysis.
Forecast methodology: Growth projections (CAGR 12.1%) are based on diffusion of voluntary corporate commitments, expected regulatory developments, and anticipated cost reductions in MRV technologies. Scenario analysis is performed to account for policy uncertainty.
Data Accuracy & Quality Check
Guaranteed accuracy level of 85–90%: All market estimates are subject to a multi-stage verification process, including outlier detection, logic checks, and cross-validation with independent third-party sources.
Date of purchase update: Every report is updated to the date of purchase, ensuring clients receive the most current market intelligence, including recent transactions, policy changes, and competitive developments.
Quality assurance: Data is reviewed by a senior analyst panel and validated against known market events (e.g., major credit issuances, price benchmarks). Any revisions to historical data are documented and explained.
Table 15: Europe Biodiversity Credit Market Report Revenue Billion Forecast, by Credit Type 2020 & 2034
Europe Biodiversity Credit Market Report Revenue Billion Forecast, by Application 2020 & 2034
Frequently Asked Questions
1. What is the current size of the biodiversity credit market?
The global biodiversity credit market was valued at USD 1.3 billion in 2025 and is projected to reach USD 1.4 billion in 2026, growing to USD 3.2 billion by 2033 at a CAGR of 12.1%.
2. Which region dominates the biodiversity credit market?
North America held the largest revenue share at 31.8% in 2025, driven by strong voluntary corporate commitments and favorable ESG disclosure practices. However, Latin America is expected to be the fastest-growing region.
3. What are the main drivers of the biodiversity credit market?
Key drivers include growing corporate ESG commitments and net-positive biodiversity goals, supportive international frameworks like the Kunming-Montreal Global Biodiversity Framework, and increasing investor interest in natural capital.
4. What are the challenges hindering market growth?
High upfront costs and long project development timelines, lack of standardized measurement methodologies, and verification and additionality concerns are major restraints limiting faster market expansion.
5. Who are the key players in the biodiversity credit market?
Key players include Verra, Gold Standard, South Pole, Wildlife Works, Terrasos, Ekos Kāmahi, Climate Impact X, and the Biodiversity Credit Alliance, among others.
11.1.9.2. Products
11.1.9.3. Company Financials
11.1.9.4. SWOT Analysis
11.1.10. ACX (AirCarbon Exchange)
11.1.10.1. Company Overview
11.1.10.2. Products
11.1.10.3. Company Financials
11.1.10.4. SWOT Analysis
11.1.11. NatureFinance
11.1.11.1. Company Overview
11.1.11.2. Products
11.1.11.3. Company Financials
11.1.11.4. SWOT Analysis
11.1.12. Wildlife Works Carbon
11.1.12.1. Company Overview
11.1.12.2. Products
11.1.12.3. Company Financials
11.1.12.4. SWOT Analysis
11.1.13. Terrasos SAS
11.1.13.1. Company Overview
11.1.13.2. Products
11.1.13.3. Company Financials
11.1.13.4. SWOT Analysis
11.1.14. BioCarbon Partners LP
11.1.14.1. Company Overview
11.1.14.2. Products
11.1.14.3. Company Financials
11.1.14.4. SWOT Analysis
11.1.15. Ekos Kāmahi Ltd
11.1.15.1. Company Overview
11.1.15.2. Products
11.1.15.3. Company Financials
11.1.15.4. SWOT Analysis
11.1.16. Climate Asset Management Limited
11.1.16.1. Company Overview
11.1.16.2. Products
11.1.16.3. Company Financials
11.1.16.4. SWOT Analysis
11.1.17. Biodiversity Solutions Ltd
11.1.17.1. Company Overview
11.1.17.2. Products
11.1.17.3. Company Financials
11.1.17.4. SWOT Analysis
11.1.18. EcoEnterprises Fund
11.1.18.1. Company Overview
11.1.18.2. Products
11.1.18.3. Company Financials
11.1.18.4. SWOT Analysis
11.1.19. Zero Imprint Ltd
11.1.19.1. Company Overview
11.1.19.2. Products
11.1.19.3. Company Financials
11.1.19.4. SWOT Analysis
11.1.20. New Forests Advisory Pty Limited
11.1.20.1. Company Overview
11.1.20.2. Products
11.1.20.3. Company Financials
11.1.20.4. SWOT Analysis
11.1.21. GreenVest
11.1.21.1. Company Overview
11.1.21.2. Products
11.1.21.3. Company Financials
11.1.21.4. SWOT Analysis
11.1.22. Nature Metrics Ltd
11.1.22.1. Company Overview
11.1.22.2. Products
11.1.22.3. Company Financials
11.1.22.4. SWOT Analysis
11.1.23. GreenCollar Group
11.1.23.1. Company Overview
11.1.23.2. Products
11.1.23.3. Company Financials
11.1.23.4. SWOT Analysis
11.1.24. Earthbanc
11.1.24.1. Company Overview
11.1.24.2. Products
11.1.24.3. Company Financials
11.1.24.4. SWOT Analysis
11.1.25. DGB GROUP N.V.
11.1.25.1. Company Overview
11.1.25.2. Products
11.1.25.3. Company Financials
11.1.25.4. SWOT Analysis
11.1.26. The Landbanking Group
11.1.26.1. Company Overview
11.1.26.2. Products
11.1.26.3. Company Financials
11.1.26.4. SWOT Analysis
11.1.27. ClimateTrade
11.1.27.1. Company Overview
11.1.27.2. Products
11.1.27.3. Company Financials
11.1.27.4. SWOT Analysis
11.1.28. CreditNature Ltd
11.1.28.1. Company Overview
11.1.28.2. Products
11.1.28.3. Company Financials
11.1.28.4. SWOT Analysis
11.1.29. Biodiversity Credit Alliance
11.1.29.1. Company Overview
11.1.29.2. Products
11.1.29.3. Company Financials
11.1.29.4. SWOT Analysis
11.1.30. The Biodiversity Consultancy
11.1.30.1. Company Overview
11.1.30.2. Products
11.1.30.3. Company Financials
11.1.30.4. SWOT Analysis
11.1.31. Value Nature
11.1.31.1. Company Overview
11.1.31.2. Products
11.1.31.3. Company Financials
11.1.31.4. SWOT Analysis
11.1.32. Mossy Earth
11.1.32.1. Company Overview
11.1.32.2. Products
11.1.32.3. Company Financials
11.1.32.4. SWOT Analysis
11.1.33. Bioneers
11.1.33.1. Company Overview
11.1.33.2. Products
11.1.33.3. Company Financials
11.1.33.4. SWOT Analysis
11.2. Market Entropy
11.2.1. Company's Key Areas Served
11.2.2. Recent Developments
11.3. Company Market Share Analysis, 2026
11.3.1. Top 5 Companies Market Share Analysis
11.3.2. Top 3 Companies Market Share Analysis
11.4. List of Potential Customers
Figure 16:
Figure 17: Europe Biodiversity Credit Market Report Revenue Share (%), by Application 2026 & 2034
Figure 18: Europe Biodiversity Credit Market Report Revenue (Billion), by Ecosystem 2026 & 2034
Figure 19: Europe Biodiversity Credit Market Report Revenue Share (%), by Ecosystem 2026 & 2034
Figure 20: Europe Biodiversity Credit Market Report Revenue (Billion), by Market Type 2026 & 2034
Figure 21: Europe Biodiversity Credit Market Report Revenue Share (%), by Market Type 2026 & 2034
Figure 22: Europe Biodiversity Credit Market Report Revenue (Billion), by End User 2026 & 2034
Figure 23: Europe Biodiversity Credit Market Report Revenue Share (%), by End User 2026 & 2034
Figure 24: Europe Biodiversity Credit Market Report Revenue (Billion), by Country 2026 & 2034
Figure 25: Europe Biodiversity Credit Market Report Revenue Share (%), by Country 2026 & 2034
Figure 26: Asia Pacific Biodiversity Credit Market Report Revenue (Billion), by Credit Type 2026 & 2034
Figure 27: Asia Pacific Biodiversity Credit Market Report Revenue Share (%), by Credit Type 2026 & 2034
Figure 28: Asia Pacific Biodiversity Credit Market Report Revenue (Billion), by Application 2026 & 2034
Figure 29: Asia Pacific Biodiversity Credit Market Report Revenue Share (%), by Application 2026 & 2034
Figure 30: Asia Pacific Biodiversity Credit Market Report Revenue (Billion), by Ecosystem 2026 & 2034
Figure 31: Asia Pacific Biodiversity Credit Market Report Revenue Share (%), by Ecosystem 2026 & 2034
Figure 32: Asia Pacific Biodiversity Credit Market Report Revenue (Billion), by Market Type 2026 & 2034
Figure 33: Asia Pacific Biodiversity Credit Market Report Revenue Share (%), by Market Type 2026 & 2034
Figure 34: Asia Pacific Biodiversity Credit Market Report Revenue (Billion), by End User 2026 & 2034
Figure 35: Asia Pacific Biodiversity Credit Market Report Revenue Share (%), by End User 2026 & 2034
Figure 36: Asia Pacific Biodiversity Credit Market Report Revenue (Billion), by Country 2026 & 2034
Figure 37: Asia Pacific Biodiversity Credit Market Report Revenue Share (%), by Country 2026 & 2034
Figure 38: Latin America Biodiversity Credit Market Report Revenue (Billion), by Credit Type 2026 & 2034
Figure 39: Latin America Biodiversity Credit Market Report Revenue Share (%), by Credit Type 2026 & 2034
Figure 40: Latin America Biodiversity Credit Market Report Revenue (Billion), by Application 2026 & 2034
Figure 41: Latin America Biodiversity Credit Market Report Revenue Share (%), by Application 2026 & 2034
Figure 42: Latin America Biodiversity Credit Market Report Revenue (Billion), by Ecosystem 2026 & 2034
Figure 43: Latin America Biodiversity Credit Market Report Revenue Share (%), by Ecosystem 2026 & 2034
Figure 44: Latin America Biodiversity Credit Market Report Revenue (Billion), by Market Type 2026 & 2034
Figure 45: Latin America Biodiversity Credit Market Report Revenue Share (%), by Market Type 2026 & 2034
Figure 46: Latin America Biodiversity Credit Market Report Revenue (Billion), by End User 2026 & 2034
Figure 47: Latin America Biodiversity Credit Market Report Revenue Share (%), by End User 2026 & 2034
Figure 48: Latin America Biodiversity Credit Market Report Revenue (Billion), by Country 2026 & 2034
Figure 49: Latin America Biodiversity Credit Market Report Revenue Share (%), by Country 2026 & 2034
Figure 50: Middle East & Africa Biodiversity Credit Market Report Revenue (Billion), by Credit Type 2026 & 2034
Figure 51: Middle East & Africa Biodiversity Credit Market Report Revenue Share (%), by Credit Type 2026 & 2034
Figure 52: Middle East & Africa Biodiversity Credit Market Report Revenue (Billion), by Application 2026 & 2034
Figure 53: Middle East & Africa Biodiversity Credit Market Report Revenue Share (%), by Application 2026 & 2034
Figure 54: Middle East & Africa Biodiversity Credit Market Report Revenue (Billion), by Ecosystem 2026 & 2034
Figure 55: Middle East & Africa Biodiversity Credit Market Report Revenue Share (%), by Ecosystem 2026 & 2034
Figure 56: Middle East & Africa Biodiversity Credit Market Report Revenue (Billion), by Market Type 2026 & 2034
Figure 57: Middle East & Africa Biodiversity Credit Market Report Revenue Share (%), by Market Type 2026 & 2034
Figure 58: Middle East & Africa Biodiversity Credit Market Report Revenue (Billion), by End User 2026 & 2034
Figure 59: Middle East & Africa Biodiversity Credit Market Report Revenue Share (%), by End User 2026 & 2034
Figure 60: Middle East & Africa Biodiversity Credit Market Report Revenue (Billion), by Country 2026 & 2034
Figure 61: Middle East & Africa Biodiversity Credit Market Report Revenue Share (%), by Country 2026 & 2034
Table 16:
Table 17: Europe Biodiversity Credit Market Report Revenue Billion Forecast, by Ecosystem 2020 & 2034
Table 18: Europe Biodiversity Credit Market Report Revenue Billion Forecast, by Market Type 2020 & 2034
Table 19: Europe Biodiversity Credit Market Report Revenue Billion Forecast, by End User 2020 & 2034
Table 20: Europe Biodiversity Credit Market Report Revenue Billion Forecast, by Country 2020 & 2034