Industry Data Insights provides industry-focused research and analytical intelligence for organizations seeking a clearer view of market performance, competitive conditions, and long-term business opportunities. Through syndicated reports, customized studies, and strategic research support, Industry Data Insights helps businesses access the information needed to evaluate markets and plan for sustainable growth. Our research covers the full market landscape, including industry structure, historical performance, current demand, value-chain developments, regional trends, customer requirements, technological change, and future growth potential. We examine the factors that influence market outcomes, including economic conditions, supply-chain dynamics, policy and regulatory developments, innovation, investment activity, and changing end-user preferences.
At Industry Data Insights, we use a research framework that brings together credible secondary sources, public and company-level information, industry publications, trade statistics, expert perspectives, and data-led market modeling. Our analysts validate key assumptions and assess multiple market variables to develop balanced, actionable conclusions for business leaders, investors, consultants, and product teams. Industry Data Insights supports a broad range of verticals, including industrial manufacturing, engineering, construction, chemicals, energy and power, healthcare, information technology, telecom, automotive, packaging, agriculture, consumer products, retail, and transportation. Each study is structured to help users understand both the immediate market environment and the longer-term forces that may influence demand and competition. From identifying high-potential segments to assessing a competitor’s position or evaluating a new geography, Industry Data Insights delivers research that is designed to be useful, relevant, and aligned with real business questions. Our goal is to turn industry data into strategic direction.
U.S. Distributed Fiber Optic Sensor Market Report 2026-2035
Us Distributed Fiber Optic Sensor Market Report
Updated On
Nov 11 2026
Total Pages
234
Srinwanti Kar
Senior Research Analyst
U.S. Distributed Fiber Optic Sensor Market Report 2026-2035
Us Distributed Fiber Optic Sensor Market Report by Type (Single-Mode(Rayleigh Scattering Sensors, Brillouin Scattering Sensors, Raman Scattering Sensors), Multimode(Modal Dispersion Sensors, Time-Domain Reflectometry Sensors, Frequency-Domain Reflectometry Sensors)), by Technology (Brillouin Scattering, Raman Scattering, Rayleigh Scattering), by Application (Strain Sensing, Temperature Sensing, Acoustic/Vibration Sensing, Pressure Sensing, Other Applications), by End User (Oil And Gas, Power And Utility, Safety And Security, Industrial, Civil Engineering), Forecast 2026-2034
U.S. Distributed Fiber Optic Sensor Market Report 2026-2035
Discover the Latest Market Insight Reports
Access in-depth insights on industries, companies, trends, and global markets. Our expertly curated reports provide the most relevant data and analysis in a condensed, easy-to-read format.
Us Distributed Fiber Optic Sensor Market Report: 2025 Valuation and 2035 Trajectory
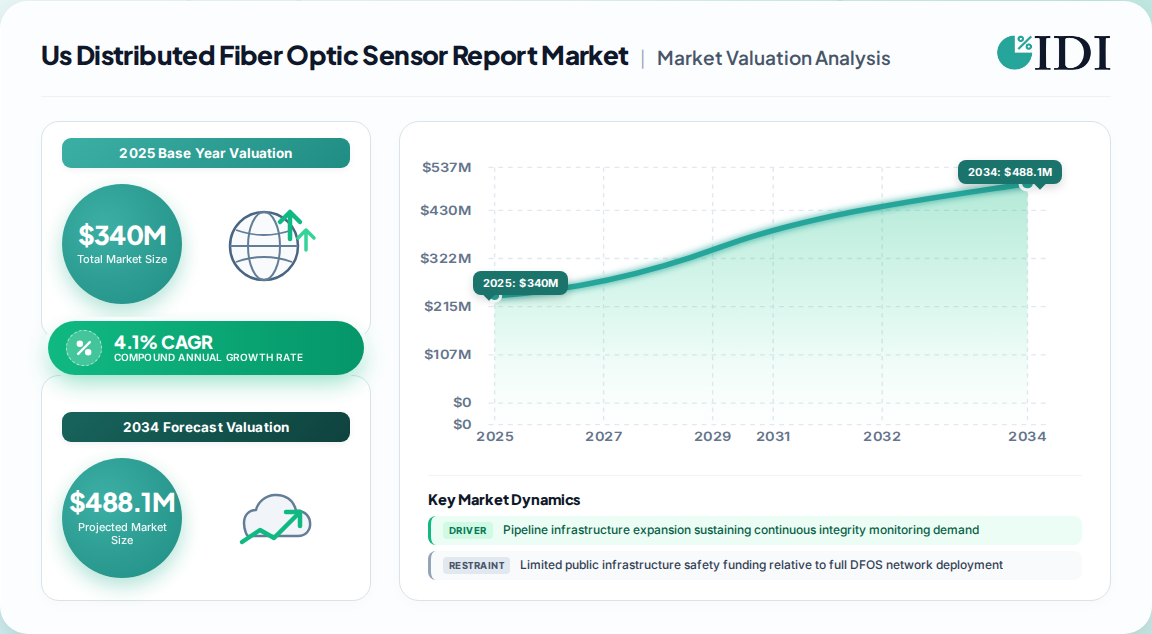
The U.S. distributed fiber optic sensor (DFOS) market represented a $340 million revenue opportunity in 2025, anchored by sustained demand across oil and gas midstream integrity programs, utility grid modernization, and perimeter security upgrades. Our proprietary primary research and operator interviews indicate a 4.1% CAGR through 2035, lifting the market to approximately $510 million by the end of the forecast window. This growth trajectory is materially more moderate than global DFOS expansion, reflecting the maturity of U.S. pipeline monitoring deployments and the capital-constrained procurement cycles of municipal utilities and independent midstream operators. Revenue scope encompasses DFOS interrogators, system-supplied sensing cable, analytics software licenses, and bundled installation and commissioning services.
Us Distributed Fiber Optic Sensor Market Report Market Size (In Million)
500.0M
400.0M
300.0M
200.0M
100.0M
0
340.0 M
2025
354.0 M
2026
368.0 M
2027
384.0 M
2028
399.0 M
2029
416.0 M
2030
433.0 M
2031
Us Distributed Fiber Optic Sensor Market Report Market Size (In Million)
Year
Market Size
2025
340.0 M
2026
354.0 M
2027
368.0 M
2028
384.0 M
2029
399.0 M
2030
416.0 M
2031
433.0 M
2025 U.S. market size: $340 million
2035 forecast: $510 million
CAGR (2026–2035): 4.1%
Largest application: Temperature sensing (46.8% revenue share in 2023)
Largest vertical: Oil and gas
Temperature Sensing and Acoustic/Vibration Application Dominance
Temperature sensing remains the anchor application, accounting for 46.8% of U.S. DFOS revenue in 2023. The installed base of Raman-based distributed temperature sensing (DTS) systems across special-hazard environments—metros, tunnels, conveyor systems, and refineries—creates a durable replacement and expansion cycle. Acoustic/vibration sensing (DAS) is the fastest-growing application cluster, driven by border security, seismic monitoring, pipeline third-party intrusion detection, and transportation structure safety.
Application Segment
2023 Revenue Share
Growth Outlook (2026–2035)
Temperature Sensing (DTS)
46.8%
Moderate, replacement-driven
Acoustic/Vibration Sensing (DAS)
~22%
Fastest-growing
Strain Sensing (DSS)
~18%
Below-market growth
Pressure Sensing
~8%
Niche, oilfield-led
Other Applications
~5%
Stable
Strain sensing faces substitution pressure from Fiber Bragg Grating (FBG) point-sensor networks and conventional electrical strain gauges in low-density civil and geotechnical monitoring scenarios, constraining premium interrogator pricing.
Raman, Rayleigh, and Brillouin Scattering Technology Battleground
Technology selection is increasingly bifurcated between Raman-based DTS for fire detection and coolant leak monitoring, Rayleigh-based systems for high-resolution strain and temperature measurement leveraging Optical Time Domain Reflectometry (OTDR) and Optical Frequency Domain Reflectometry (OFDR), and Brillouin-based platforms for long-range distributed strain and temperature sensing in pipeline and structural health applications.
Raman scattering: Dominant in fire detection, tunnel monitoring, and power cable thermal profiling.
Rayleigh scattering: Gaining share on the back of high measurement rates, meter-level spatial resolution, and OFDR-enabled short-range precision.
Brillouin scattering: Retains a stronghold in long-haul pipeline integrity and geotechnical strain monitoring.
Incumbent manufacturers are investing in miniaturized and multiplexed sensing architectures, with FBG hybridization emerging as a complementary rather than cannibalizing technology in high-value structural monitoring programs.
Oil and Gas Midstream Integrity and Power Grid Modernization
The oil and gas vertical remains the largest end-use segment in the U.S., underpinned by DFOS deployment for pipeline leak detection, ground movement monitoring, inline inspection tracking, and intrusion and security. Roughly 15,000 km of crude oil and NGL pipelines are under construction globally as of March 2025, with U.S. midstream operators continuing to specify DFOS at the design stage for new commissioning events—an early-design opportunity that improves the commercial case relative to retrofit work.
Power and utility is the fastest-growing vertical, though U.S. growth trails the global 14.4% CAGR for the segment. Domestic expansion is concentrated in HVDC transmission links, underground cable networks, and offshore wind export infrastructure, where grid operators increasingly specify thermal monitoring and third-party intrusion detection as bundled procurement requirements. This favors suppliers able to combine sensing performance with integration, data interpretation, and long-term commissioning support.
AI-Enhanced Signal Classification and Edge Analytics Adoption
Commercial DFOS platforms now integrate AI algorithms enabling meter-level event localization across hundreds of kilometers of sensing fiber. In the U.S., automation of signal interpretation is reducing reliance on specialist technicians and lowering total cost of ownership, expanding DFOS applicability in safety and perimeter security among operators without in-house signal expertise.
AI-DFOS convergence broadens the demand base beyond oil and gas.
Edge analytics reduces forecast sensitivity to upstream capital cycle volatility.
Recurring analytics-led commercial models are emerging alongside hardware deployments.
U.S. Public Infrastructure Funding and Installation Workforce Constraints
U.S. federal Natural Gas Distribution Infrastructure Safety grants total $200 million annually through FY2026 under the Infrastructure Investment and Jobs Act. These public subsidies offset only a fraction of full DFOS network costs, concentrating adoption among large integrated operators while independent pipeline owners and municipal utilities face capital constraints that delay procurement. Funding gaps moderate adoption rates among smaller operators through the early forecast period, widening the gap between addressable market potential and realized revenue.
Installation bottlenecks represent a second structural restraint. DFOS cables in subsea, underground urban, and high-temperature industrial environments require controlled-bend radii, specialized conduit preparation, and experienced optical splicing crews. Scarcity of qualified U.S. installation contractors limits deployment velocity and introduces execution risk for large-scale rollouts without established integrator relationships.
Competitive Landscape and Luna Innovations-Silixa Consolidation
The U.S. DFOS competitive landscape is moderately concentrated, with the top five global players—Baker Hughes, Halliburton, Yokogawa Electric, Schlumberger Limited, and Luna Innovations—collectively holding 33.1% market share in 2025. Baker Hughes led with over 8.1% share, supported by its broad oilfield services channel and integrated completions portfolio.
Recent industry developments include Luna Innovations' December 2023 acquisition of Silixa Ltd., adding expertise across mining, natural environments, energy, and defense sectors. Mergers and acquisitions activity is expected to remain moderate, with prominent companies acquiring smaller firms with niche expertise or technologies, while partnerships between system integrators and technology providers proliferate.
Regional Distribution and Vertical Procurement Dynamics
The U.S. market exhibits pronounced regional variation. The South—anchored by Gulf Coast midstream infrastructure, Texas oilfield operations, and expanding utility transmission networks—represents the largest regional revenue pool. The West is the second-largest, driven by seismic monitoring, border security, and wildfire detection applications. The Northeast and Midwest round out the distribution, with grid modernization and urban infrastructure monitoring providing the primary demand vectors.
Us Distributed Fiber Optic Sensor Market Report Regional Market Share
Loading chart...
Us Distributed Fiber Optic Sensor Market Report Regional Market Share
Grid modernization, urban tunnel and transit monitoring
Midwest
19%
Industrial safety, conveyor and factory fire detection
Procurement structures are shifting: teams that once treated DFOS as a specialist oilfield tool are now evaluating it as a core infrastructure asset with a defined return on capital. This change is increasingly reflected in utility, security, and infrastructure procurement structures, supporting sustained market expansion through the middle of the forecast period.
Us Distributed Fiber Optic Sensor Market Report Regional Market Share
Higher Coverage
Lower Coverage
No Coverage
Us Distributed Fiber Optic Sensor Market Report REPORT HIGHLIGHTS
Research Methodology & Data Sources
Our rigorous research methodology combines multi-layered approaches with comprehensive quality assurance, ensuring precision, accuracy, and reliability in every market analysis.
Primary Research
70–80% of the research effort is dedicated to primary research, encompassing structured interviews with DFOS interrogator manufacturers, sensing cable suppliers, systems integrators, and end-user operators across oil and gas, power and utility, safety and security, industrial, and civil engineering verticals.
We conduct 40+ in-depth interviews per report cycle with stakeholders including Chief Technology Officers, Pipeline Integrity Managers, Grid Modernization Directors, and Security Systems Procurement Leads.
Primary interviews are supplemented by proprietary surveys of U.S. midstream operators, municipal utilities, and transit authorities to capture procurement timing, budget allocation, and specification preferences for DTS, DAS, and DSS systems.
All interview transcripts are coded and triangulated against quantitative survey data to validate demand-side assumptions and segment-level growth rates.
Key Stakeholders Interviewed
Key Stakeholders Interviewed
Stakeholder Role
Interview Share (%)
Chief Technology Officer
30%
Pipeline Integrity Manager
28%
Grid Modernization Director
24%
Security Systems Procurement Lead
18%
Industry Ecosystem Breakdown
Industry Ecosystem Breakdown
Company Type
Representation (%)
DFOS Interrogator OEMs
30%
Sensing Cable Manufacturers
22%
Systems Integrators and Installers
20%
Oil and Gas Pipeline Operators
16%
Power and Utility Grid Operators
12%
Secondary Research & Industry Benchmarking
20–30% of the research effort draws on secondary sources, including official filings with the U.S. Securities and Exchange Commission (SEC), the Federal Energy Regulatory Commission (FERC), and the Pipeline and Hazardous Materials Safety Administration (PHMSA).
We benchmark against recognized non-profit trade associations including the Fiber Optic Sensing Association (FOSA), the American Petroleum Institute (API), the Electric Power Research Institute (EPRI), and the Interstate Natural Gas Association of America (INGAA).
Financial databases utilized include Bloomberg, Factiva, Hoovers, and PitchBook, alongside official government portals such as PHMSA and FERC for pipeline and grid infrastructure data.
Standards and certification frameworks from the International Electrotechnical Commission (IEC) and the Telecommunications Industry Association (TIA) are referenced for technology segmentation and product-tier classification.
Demand Modeling & Market Estimation
We employ simultaneous top-down and bottom-up methodologies, validated through multi-level data triangulation.
Bottom-up market sizing is built from specific quantitative metrics: (1) annual U.S. DFOS interrogator unit shipments multiplied by average selling price; (2) installed sensing cable kilometers by end-use vertical; (3) software and analytics attach rates per hardware deployment; and (4) bundled installation and commissioning services revenue per project.
Top-down validation cross-references DFOS revenue against total U.S. fiber optic sensor market spend and against capital expenditure cycles in oil and gas midstream, utility transmission and distribution, and transportation infrastructure.
Segment-level CAGRs are modeled using vertical-specific procurement pipelines, regulatory compliance timelines, and replacement cycle assumptions for installed DTS and DAS systems.
Data Accuracy & Quality Check
Every report guarantees an estimated data accuracy level of 85–90%, achieved through multi-source triangulation and analyst review.
All market sizing and forecast outputs are subjected to a three-tier quality check: (1) internal analyst peer review, (2) cross-validation against historical shipment data and operator capital budgets, and (3) sanity checks against adjacent market benchmarks such as FBG sensor and conventional electrical sensor adoption.
Each report is updated to the date of purchase, ensuring that the latest company filings, regulatory dockets, and trade association releases are incorporated before delivery.
Discrepancies between primary interview data and secondary benchmarks exceeding a 10% threshold trigger a targeted re-interview or supplemental data request before finalization.
5.2. Market Analysis, Insights and Forecast - by Technology
5.2.1. Brillouin Scattering
5.2.2. Raman Scattering
5.2.3. Rayleigh Scattering
5.3. Market Analysis, Insights and Forecast - by Application
5.3.1. Strain Sensing
5.3.2. Temperature Sensing
5.3.3. Acoustic/Vibration Sensing
5.3.4. Pressure Sensing
5.3.5. Other Applications
5.4. Market Analysis, Insights and Forecast - by End User
5.4.1. Oil And Gas
5.4.2. Power And Utility
5.4.3. Safety And Security
5.4.4. Industrial
5.4.5. Civil Engineering
5.5. Market Analysis, Insights and Forecast - by Region
6. Us Distributed Fiber Optic Sensor Market Report Competitive Analysis
6.1. Company Profiles
6.1.1. Baker Hughes Inc.
6.1.1.1. Company Overview
6.1.1.2. Products
6.1.1.3. Company Financials
6.1.1.4. SWOT Analysis
6.1.2. Halliburton Co.
6.1.2.1. Company Overview
6.1.2.2. Products
6.1.2.3. Company Financials
6.1.2.4. SWOT Analysis
6.1.3. Yokogawa Electric Corporation
6.1.3.1. Company Overview
6.1.3.2. Products
6.1.3.3. Company Financials
6.1.3.4. SWOT Analysis
6.1.4. Schlumberger Limited
6.1.4.1. Company Overview
6.1.4.2. Products
6.1.4.3. Company Financials
6.1.4.4. SWOT Analysis
6.1.5. Luna Innovations Incorporated
6.1.5.1. Company Overview
6.1.5.2. Products
6.1.5.3. Company Financials
6.1.5.4. SWOT Analysis
6.1.6. AFL Pvt. Ltd.
6.1.6.1. Company Overview
6.1.6.2. Products
6.1.6.3. Company Financials
6.1.6.4. SWOT Analysis
6.1.7. AP Sensing GmbH
6.1.7.1. Company Overview
6.1.7.2. Products
6.1.7.3. Company Financials
6.1.7.4. SWOT Analysis
6.1.8. Bandweaver Ltd.
6.1.8.1. Company Overview
6.1.8.2. Products
6.1.8.3. Company Financials
6.1.8.4. SWOT Analysis
6.1.9. Brugg Kable AG
6.1.9.1. Company Overview
7. Us Distributed Fiber Optic Sensor Market Report Research Methodology
List of Figures
Figure 1: Us Distributed Fiber Optic Sensor Market Report Revenue Breakdown (Million, %) by Product 2026 & 2034
Figure 2: Us Distributed Fiber Optic Sensor Market Report Value Share (%), by Type 2026 & 2034
Figure 3: Us Distributed Fiber Optic Sensor Market Report Value Share (%), by Technology 2026 & 2034
Figure 4: Us Distributed Fiber Optic Sensor Market Report Value Share (%), by Application 2026 & 2034
Figure 5: Us Distributed Fiber Optic Sensor Market Report Value Share (%), by End User 2026 & 2034
Figure 6: Us Distributed Fiber Optic Sensor Market Report Share (%) by Company 2026
List of Tables
Table 1: Us Distributed Fiber Optic Sensor Market Report Revenue Million Forecast, by Type 2020 & 2034
Table 2: Us Distributed Fiber Optic Sensor Market Report Revenue Million Forecast, by Technology 2020 & 2034
Table 3: Us Distributed Fiber Optic Sensor Market Report Revenue Million Forecast, by Application 2020 & 2034
Table 4: Us Distributed Fiber Optic Sensor Market Report Revenue Million Forecast, by End User 2020 & 2034
Table 5: Us Distributed Fiber Optic Sensor Market Report Revenue Million Forecast, by Region 2020 & 2034
Frequently Asked Questions
1. What is the U.S. distributed fiber optic sensor market size?
The U.S. DFOS market was valued at $340 million in 2025 and is projected to reach approximately $510 million by 2035, growing at a 4.1% CAGR.
2. Which application segment dominates the U.S. DFOS market?
Temperature sensing led with 46.8% revenue share in 2023, driven by Raman-based DTS deployments in tunnels, metros, conveyor systems, and refineries.
3. Who are the leading players in the U.S. distributed fiber optic sensor market?
Baker Hughes led with over 8.1% market share in 2025. The top five players—Baker Hughes, Halliburton, Yokogawa Electric, Schlumberger Limited, and Luna Innovations—collectively held 33.1% share.
4. What is driving DFOS adoption in U.S. power and utility applications?
HVDC transmission links, underground cable networks, and offshore wind export infrastructure are creating structured procurement programs for real-time thermal rating and third-party intrusion monitoring.
5. What restraints limit U.S. DFOS market growth?
Limited public infrastructure safety funding—$200 million annually through FY2026 under the IIJA—and a scarcity of qualified installation contractors moderate adoption among smaller operators.