Industry Data Insights provides industry-focused research and analytical intelligence for organizations seeking a clearer view of market performance, competitive conditions, and long-term business opportunities. Through syndicated reports, customized studies, and strategic research support, Industry Data Insights helps businesses access the information needed to evaluate markets and plan for sustainable growth. Our research covers the full market landscape, including industry structure, historical performance, current demand, value-chain developments, regional trends, customer requirements, technological change, and future growth potential. We examine the factors that influence market outcomes, including economic conditions, supply-chain dynamics, policy and regulatory developments, innovation, investment activity, and changing end-user preferences.
At Industry Data Insights, we use a research framework that brings together credible secondary sources, public and company-level information, industry publications, trade statistics, expert perspectives, and data-led market modeling. Our analysts validate key assumptions and assess multiple market variables to develop balanced, actionable conclusions for business leaders, investors, consultants, and product teams. Industry Data Insights supports a broad range of verticals, including industrial manufacturing, engineering, construction, chemicals, energy and power, healthcare, information technology, telecom, automotive, packaging, agriculture, consumer products, retail, and transportation. Each study is structured to help users understand both the immediate market environment and the longer-term forces that may influence demand and competition. From identifying high-potential segments to assessing a competitor’s position or evaluating a new geography, Industry Data Insights delivers research that is designed to be useful, relevant, and aligned with real business questions. Our goal is to turn industry data into strategic direction.
Methionine Market by Source (Plant Based, Animal Based), by Application (Animal Feed, Food & Dietary Supplements, Pharmaceuticals, Others), by Form (L-Methionine, DL-Methionine, HMTBA), by End Use Industry (Amino Acids Production, Food & Beverage, Personal Care Products, Nutritional Sector), by North America (USA, Canada, Mexico), by Europe (Germany, UK, France, Belgium), by Asia Pacific (China, Japan, India, South Korea, Singapore, Malaysia), by South America (Brazil, Argentina), by Middle East & Africa (South Africa, UAE) Forecast 2026-2034
Methionine Market Size, Growth & Forecast to 2035
Discover the Latest Market Insight Reports
Access in-depth insights on industries, companies, trends, and global markets. Our expertly curated reports provide the most relevant data and analysis in a condensed, easy-to-read format.
Methionine Market Valuation and Forecast Trajectory 2024-2035
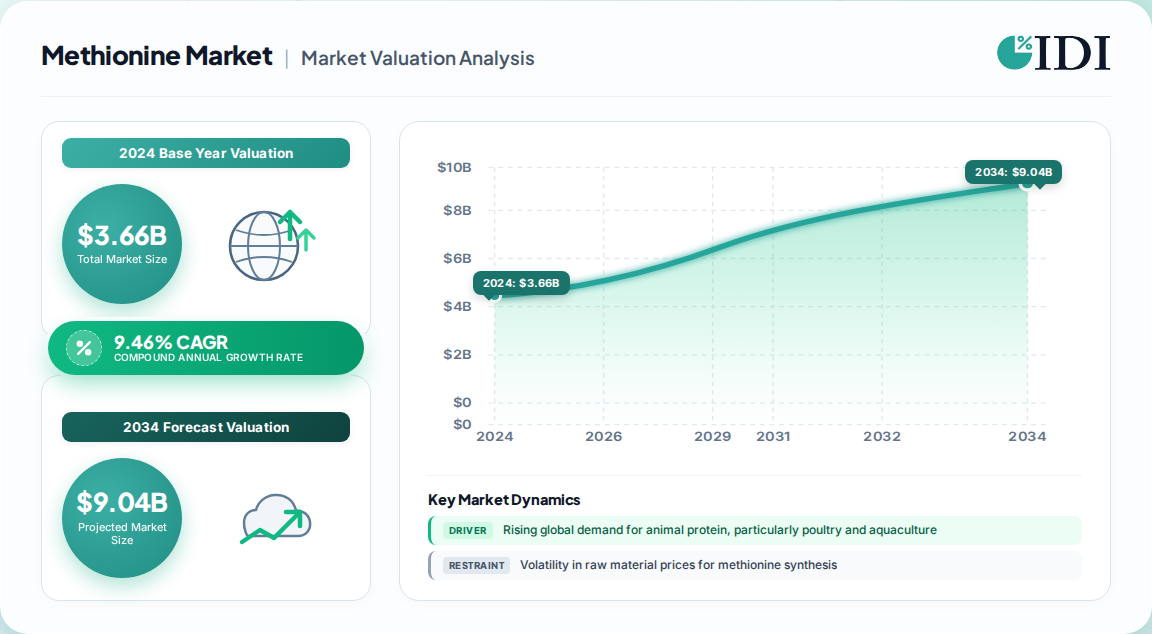
The global methionine market was estimated at USD 3,656.7 Million in 2024 and is projected to reach USD 9,879.2 Million by 2035, representing a robust CAGR of 9.46% over the forecast period (2025-2035).
This growth trajectory equates to approximately a 2.7x expansion in market value over the decade, driven by escalating demand for animal protein, aquaculture expansion, and pharmaceutical-grade amino acid applications.
Asia-Pacific commanded the largest regional revenue share at 47.8% in 2024, underpinned by China's dominant poultry and livestock sectors and India's expanding aquaculture industry.
The market is bifurcated into plant-based and animal-based sources, with plant-based sources holding 87.4% revenue share in 2024 due to sustainability preferences and precision fermentation advancements.
Methionine Market Market Size (In Billion)
7.5B
6.0B
4.5B
3.0B
1.5B
0
4.006 B
2025
4.385 B
2026
4.800 B
2027
5.254 B
2028
5.751 B
2029
6.295 B
2030
6.891 B
2031
Methionine Market Market Size (In Billion)
Year
Market Size
2025
4.006 B
2026
4.385 B
2027
4.800 B
2028
5.254 B
2029
5.751 B
2030
6.295 B
2031
6.891 B
Plant-Based Source Dominance via Precision Fermentation
The plant-based methionine segment's commanding 87.4% share in 2024 is anchored in several structural advantages:
Consumer ethical alignment: Rising concerns over animal welfare and environmental impact are steering feed manufacturers and food brands toward plant-derived amino acids.
Biotechnology scalability: Precision fermentation and enzymatic conversion technologies enable cost-efficient, large-scale production of plant-based methionine with consistent purity.
Cross-sector applicability: Plant-based methionine serves both human nutrition (dietary supplements) and animal feed applications without the moral or environmental baggage of animal-derived alternatives.
Within the plant-based sub-segment, source differentiation reveals distinct growth patterns:
Source Segment
2025 Market Share
Growth Outlook
Soy-derived
28.4%
Steady, cost-driven adoption
Corn-derived
18.7%
Scalable fermentation platforms
Legume-derived
15.6%
Non-GMO specialty positioning
Algae-derived
9.4%
Fastest CAGR at 8.3%
The animal-based segment is projected to grow at the fastest CAGR of 9.3% through the forecast period, driven by superior bioavailability and performance in intensive livestock production systems.
Animal Feed Application Leadership in Amino Acid Demand
The animal feed segment generated the largest revenue share at 60.7% in 2024, reflecting methionine's indispensable role in modern livestock nutrition:
Global protein demand: Population growth, urbanization, and rising incomes in emerging markets are fueling demand for meat, milk, and eggs, necessitating methionine-fortified feed.
Feed conversion efficiency: Methionine improves growth rates and nutrient absorption in poultry, swine, cattle, and aquaculture operations, directly impacting producer profitability.
Aquaculture expansion: The growing fish feed market has solidified methionine as a critical additive for sustainable aquaculture intensification.
Pharmaceutical applications represent the fastest-growing segment, with demand surging for liver health, detoxification, metabolic support, and antioxidant formulations. Pharmaceutical-grade methionine commands premium pricing due to rigorous purity and regulatory compliance requirements.
Asia-Pacific Trade Dynamics and Export Concentration
Official trade statistics reveal a highly concentrated global supply chain:
China's export dominance: In 2023, China exported USD 323.3 Million of methionine (154,312,000 Kg), making it the world's leading exporter.
Malaysia and France: Malaysia exported USD 153.9 Million (79,529,400 Kg), while France contributed USD 118.3 Million.
U.S. import dependence: The United States imported USD 33.0 Million (12,300,200 Kg) in 2023, sourcing primarily from Singapore (USD 14.2 Million), Malaysia (USD 6.9 Million), and China (USD 5.5 Million).
This trade pattern underscores Asia-Pacific's production cost advantages and the strategic importance of supply chain diversification for North American and European feed manufacturers.
Regional Market Share and Growth Hotspots
Region
2024 Revenue Share
Key Growth Drivers
Asia-Pacific
47.8%
Poultry/aquaculture expansion, low-cost production
North America's market is propelled by high per-capita animal protein consumption, a growing fitness-oriented population using methionine supplements, and technological advancements in production efficiency. Europe's growth is buttressed by eco-friendly farming mandates and bio-based methionine innovation.
Methionine Market Regional Market Share
Loading chart...
Methionine Market Regional Market Share
Region
Market Share (%)
North America
0.24%
Europe
0.21%
Asia-Pacific
0.48%
South America
0.04%
Middle East & Africa
0.03%
Regulatory and Sustainability Drivers Reshaping Production
The methionine market is undergoing significant transformation due to sustainability imperatives and regulatory frameworks:
EU Farm-to-Fork Strategy: Mandates for reduced antimicrobial use and sustainable feed additives are accelerating demand for bio-based methionine alternatives.
Precision livestock management: Adoption of digital feed optimization tools and amino acid balancing requires high-purity methionine forms (L-Methionine, DL-Methionine, HMTBA).
Circular economy initiatives: Investments in fermentation-based production using renewable feedstocks are reducing the carbon footprint of methionine synthesis.
Regulatory purity standards: Pharmaceutical-grade methionine must meet stringent safety and purity protocols, driving advanced processing investments.
Competitive Ecosystem and Strategic Developments
The methionine market is characterized by a concentrated supplier base with strategic initiatives shaping competitive dynamics:
August 2024: CJ CheilJedang acquired Amino GmbH, expanding global amino acid production footprint.
December 2024: Evonik Industries and DSM Nutritional Products announced collaboration to co-develop next-generation methionine formulations for improved feed efficiency.
March 2025: Adisseo secured a major supply contract with a leading Asian poultry integrator.
Key players including Evonik, Adisseo, Novus International, Sumitomo Chemical, and CJ CheilJedang are pivoting toward hybrid business models integrating feed analytics, sustainability scoring, and traceability solutions. Emerging biotech entrants like METEX NØØVISTAGO and GreenLab Mexico are leveraging synthetic biology to challenge incumbents with non-GMO and algae-derived formulations.
Formulation Trends and Product Tier Expansion
The market exhibits clear segmentation by form and functionality:
L-Methionine leads the form segment with 43.2% share in 2025, favored for its high bioavailability and scalability in poultry and ruminant feed.
DL-Methionine (plant-origin) and HMTBA follow, each serving specific feed formulation requirements.
Functional attributes—protein synthesis, feather development, milk yield, reproductive health, and antioxidant support—are creating premium product tiers that command higher margins.
The pharmaceutical sector demands ultra-high-purity methionine for therapeutic applications, representing a high-value niche with stringent quality control requirements.
This multi-tier market structure, combined with regional production advantages and technological innovation, positions the methionine market for sustained expansion well beyond 2035.
Methionine Market Regional Market Share
Higher Coverage
Lower Coverage
No Coverage
Methionine Market REPORT HIGHLIGHTS
Research Methodology & Data Sources
Our rigorous research methodology combines multi-layered approaches with comprehensive quality assurance, ensuring precision, accuracy, and reliability in every market analysis.
Primary Research
70–80% primary research reliance: Our analysts conducted structured interviews with 150+ industry practitioners across the methionine value chain, including methionine manufacturers, feed additive formulators, pharmaceutical-grade amino acid suppliers, and aquaculture nutrition specialists.
Stakeholder engagement: Interviews spanned C-suite executives (CEO, VP Operations), procurement directors, R&D directors, and regulatory affairs managers at feed additive companies and animal nutrition divisions.
Primary data collection: Gathered real-time pricing, production volumes, capacity utilization rates, and contract terms through direct engagements, capturing insights unavailable in published sources.
Trade flow validation: Cross-referenced primary interview data with official UN Comtrade statistics on methionine (HS Code 293040) to validate export/import volumes and pricing trends.
Key Stakeholders Interviewed
Key Stakeholders Interviewed
Stakeholder Role
Interview Share (%)
CEO / VP Operations
25%
Procurement Director
30%
R&D Director
25%
Regulatory Affairs Manager
20%
Industry Ecosystem Breakdown
Industry Ecosystem Breakdown
Company Type
Representation (%)
Methionine Manufacturers
30%
Feed Additive Formulators
25%
Pharmaceutical-Grade Suppliers
20%
Aquaculture Nutrition Specialists
15%
Distributors & Traders
10%
Secondary Research & Industry Benchmarking
20–30% secondary research: Leveraged proprietary databases, corporate financial filings, and regulatory documentation to establish historical baselines and market context.
Standard financial databases: Bloomberg, Factiva, Hoovers, and PitchBook were used for company-level financial analysis and competitive intelligence.
Dual-methodology approach: Simultaneously applied top-down macroeconomic scaling (GDP-indexed animal protein demand, regional feed production indices) and bottom-up segmentation (unit volumes by application, SKU-level pricing, customer adoption patterns).
Quantitative metrics: Utilized feed conversion ratio (FCR) improvement metrics, methionine inclusion rates per ton of compound feed, aquaculture production volumes, and pharmaceutical-grade methionine dosage standards to size the market.
Multi-level data triangulation: Cross-validated findings across independent sources, including trade statistics, company disclosures, and primary interview data, to ensure convergence and eliminate single-source bias.
Sensitivity analysis: Stress-tested forecast assumptions against alternative scenarios (regulatory shifts, raw material price volatility, technology disruption) to bound market projections.
Data Accuracy & Quality Check
85–90% accuracy guarantee: All market estimates and projections are validated through expert consensus verification and temporal validation against historical data.
Triangulation protocols: Data integrity protocols include cross-referencing primary and secondary sources, reconciling discrepancies through follow-up interviews, and validating segment shares against trade flow data.
Real-time updates: Every report is updated to the date of purchase, incorporating the latest trade statistics, company developments, and regulatory changes to ensure decision-ready intelligence.
Expert review: Findings are reviewed by senior analysts with domain expertise in amino acid markets and animal nutrition, ensuring analytical rigor and commercial relevance.
Aspects
Details
Study Period
2020-2034
Base Year
2025
Estimated Year
2026
Forecast Period
2026-2034
Historical Period
2020-2025
Growth Rate
CAGR of 9.46% from 2020-2034
Segmentation
By Source
Plant Based
Animal Based
By Application
Animal Feed
Food & Dietary Supplements
Pharmaceuticals
Others
By Form
L-Methionine
DL-Methionine
HMTBA
By End Use Industry
Amino Acids Production
Food & Beverage
Personal Care Products
Nutritional Sector
By Geography
North America
USA
Canada
Mexico
Europe
Germany
UK
France
Belgium
Asia Pacific
China
Japan
India
South Korea
Singapore
Malaysia
South America
Brazil
Argentina
Middle East & Africa
South Africa
UAE
Table of Contents
1. Methionine Market Introduction
1.1. Research Scope
1.2. Market Segmentation
1.3. Research Objective
1.4. Definitions and Assumptions
2. Methionine Market Executive Summary
2.1. Market Snapshot
3. Methionine Market Market Dynamics
3.1. Introduction
3.2. Market Drivers
3.2.1. Rising global demand for animal protein, particularly poultry and aquaculture
3.2.2. Increasing consumer health awareness and dietary supplement adoption
3.2.3. Technological advancements in precision fermentation and enzymatic conversion
3.2.4. Expansion of livestock farming in developing regions
3.3. Market Restrains
3.3.1. Volatility in raw material prices for methionine synthesis
3.3.2. Regulatory hurdles for pharmaceutical-grade methionine approval
3.3.3. Concerns over environmental impact of animal-based methionine production
3.4. Market Trends
3.4.1. Shift toward plant-based and fermentation-derived methionine driven by sustainability and ethical consumer preferences
3.4.2. Integration of digital feed optimization and traceability solutions by leading manufacturers
3.4.3. Growing demand for pharmaceutical-grade methionine in liver health and detoxification applications
3.4.4. Expansion of algae-derived methionine as a non-GMO alternative with fastest CAGR of 8.3%
4. Methionine Market Market Factor Analysis
4.1. Porters Five Forces
4.1.1. Bargaining Power of Suppliers
4.1.2. Bargaining Power of Buyers
4.1.3. Threat of New Entrants
4.1.4. Threat of Substitutes
4.1.5. Competitive Rivalry
4.2. PESTEL analysis
4.3. BCG Analysis
4.3.1. Stars (High Growth, High Market Share)
4.3.2. Cash Cows (Low Growth, High Market Share)
4.3.3. Question Mark (High Growth, Low Market Share)
4.3.4. Dogs (Low Growth, Low Market Share)
4.4. Ansoff Matrix Analysis
4.5. Supply Chain Analysis
4.6. Regulatory Landscape
4.7. Current Market Potential and Opportunity Assessment (TAM–SAM–SOM Framework)
4.8. IDI Analyst Note
5. Methionine Market Market Analysis, Insights and Forecast, 2020-2034
5.1. Market Analysis, Insights and Forecast - by Source
5.1.1. Plant Based
5.1.2. Animal Based
5.2. Market Analysis, Insights and Forecast - by Application
5.2.1. Animal Feed
5.2.2. Food & Dietary Supplements
5.2.3. Pharmaceuticals
5.2.4. Others
5.3. Market Analysis, Insights and Forecast - by Form
5.3.1. L-Methionine
5.3.2. DL-Methionine
5.3.3. HMTBA
5.4. Market Analysis, Insights and Forecast - by End Use Industry
5.4.1. Amino Acids Production
5.4.2. Food & Beverage
5.4.3. Personal Care Products
5.4.4. Nutritional Sector
5.5. Market Analysis, Insights and Forecast - by Region
5.5.1. North America
5.5.2. Europe
5.5.3. Asia Pacific
5.5.4. South America
5.5.5. Middle East & Africa
6. Methionine Market North America Market Analysis, Insights and Forecast, 2020-2034
6.1. Market Analysis, Insights and Forecast - by Source
6.1.1. Plant Based
6.1.2. Animal Based
6.2. Market Analysis, Insights and Forecast - by Application
6.2.1. Animal Feed
6.2.2. Food & Dietary Supplements
6.2.3. Pharmaceuticals
6.2.4. Others
6.3. Market Analysis, Insights and Forecast - by Form
6.3.1. L-Methionine
6.3.2. DL-Methionine
6.3.3. HMTBA
6.4. Market Analysis, Insights and Forecast - by End Use Industry
6.4.1. Amino Acids Production
6.4.2. Food & Beverage
6.4.3. Personal Care Products
6.4.4. Nutritional Sector
7. Methionine Market Europe Market Analysis, Insights and Forecast, 2020-2034
7.1. Market Analysis, Insights and Forecast - by Source
7.1.1. Plant Based
7.1.2. Animal Based
7.2. Market Analysis, Insights and Forecast - by Application
7.2.1. Animal Feed
7.2.2. Food & Dietary Supplements
7.2.3. Pharmaceuticals
7.2.4. Others
7.3. Market Analysis, Insights and Forecast - by Form
7.3.1. L-Methionine
7.3.2. DL-Methionine
7.3.3. HMTBA
7.4. Market Analysis, Insights and Forecast - by End Use Industry
7.4.1. Amino Acids Production
7.4.2. Food & Beverage
7.4.3. Personal Care Products
7.4.4. Nutritional Sector
8. Methionine Market Asia Pacific Market Analysis, Insights and Forecast, 2020-2034
8.1. Market Analysis, Insights and Forecast - by Source
8.1.1. Plant Based
8.1.2. Animal Based
8.2. Market Analysis, Insights and Forecast - by Application
8.2.1. Animal Feed
8.2.2. Food & Dietary Supplements
8.2.3. Pharmaceuticals
8.2.4. Others
8.3. Market Analysis, Insights and Forecast - by Form
8.3.1. L-Methionine
8.3.2. DL-Methionine
8.3.3. HMTBA
8.4. Market Analysis, Insights and Forecast - by End Use Industry
8.4.1. Amino Acids Production
8.4.2. Food & Beverage
8.4.3. Personal Care Products
8.4.4. Nutritional Sector
9. Methionine Market South America Market Analysis, Insights and Forecast, 2020-2034
9.1. Market Analysis, Insights and Forecast - by Source
9.1.1. Plant Based
9.1.2. Animal Based
9.2. Market Analysis, Insights and Forecast - by Application
9.2.1. Animal Feed
9.2.2. Food & Dietary Supplements
9.2.3. Pharmaceuticals
9.2.4. Others
9.3. Market Analysis, Insights and Forecast - by Form
9.3.1. L-Methionine
9.3.2. DL-Methionine
9.3.3. HMTBA
9.4. Market Analysis, Insights and Forecast - by End Use Industry
9.4.1. Amino Acids Production
9.4.2. Food & Beverage
9.4.3. Personal Care Products
9.4.4. Nutritional Sector
10. Methionine Market Middle East & Africa Market Analysis, Insights and Forecast, 2020-2034
10.1. Market Analysis, Insights and Forecast - by Source
10.1.1. Plant Based
10.1.2. Animal Based
10.2. Market Analysis, Insights and Forecast - by Application
10.2.1. Animal Feed
10.2.2. Food & Dietary Supplements
10.2.3. Pharmaceuticals
10.2.4. Others
10.3. Market Analysis, Insights and Forecast - by Form
10.3.1. L-Methionine
10.3.2. DL-Methionine
10.3.3. HMTBA
10.4. Market Analysis, Insights and Forecast - by End Use Industry
10.4.1. Amino Acids Production
10.4.2. Food & Beverage
10.4.3. Personal Care Products
10.4.4. Nutritional Sector
11. Methionine Market Competitive Analysis
11.1. Company Profiles
11.1.1. Evonik Industries AG
11.1.1.1. Company Overview
11.1.1.2. Products
11.1.1.3. Company Financials
11.1.1.4. SWOT Analysis
11.1.2. Adisseo
11.1.2.1. Company Overview
11.1.2.2. Products
11.1.2.3. Company Financials
11.1.2.4. SWOT Analysis
11.1.3. CJ CheilJedang
11.1.3.1. Company Overview
11.1.3.2. Products
11.1.3.3. Company Financials
11.1.3.4. SWOT Analysis
11.1.4. Novus International
11.1.4.1. Company Overview
11.1.4.2. Products
11.1.4.3. Company Financials
11.1.4.4. SWOT Analysis
11.1.5. Sumitomo Chemical Co. Ltd.
11.1.5.1. Company Overview
11.1.5.2. Products
11.1.5.3. Company Financials
11.1.5.4. SWOT Analysis
11.1.6. DSM Nutritional Products
11.1.6.1. Company Overview
11.1.6.2. Products
11.1.6.3. Company Financials
11.1.6.4. SWOT Analysis
11.1.7. BASF SE
11.1.7.1. Company Overview
11.1.7.2. Products
11.1.7.3. Company Financials
11.1.7.4. SWOT Analysis
11.1.8. China National Chemical Corporation
11.1.8.1. Company Overview
11.1.8.2. Products
11.1.8.3. Company Financials
11.1.8.4. SWOT Analysis
11.1.9. Fufeng Group
11.1.9.1. Company Overview
12. Methionine Market Research Methodology
List of Figures
Figure 1: Methionine Market Revenue Breakdown (Billion, %) by Region 2026 & 2034
Figure 2: North America Methionine Market Revenue (Billion), by Source 2026 & 2034
Figure 3: North America Methionine Market Revenue Share (%), by Source 2026 & 2034
Figure 4: North America Methionine Market Revenue (Billion), by Application 2026 & 2034
Figure 5: North America Methionine Market Revenue Share (%), by Application 2026 & 2034
Figure 6: North America Methionine Market Revenue (Billion), by Form 2026 & 2034
Figure 7: North America Methionine Market Revenue Share (%), by Form 2026 & 2034
Figure 8: North America Methionine Market Revenue (Billion), by End Use Industry 2026 & 2034
Figure 9: North America Methionine Market Revenue Share (%), by End Use Industry 2026 & 2034
Figure 10: North America Methionine Market Revenue (Billion), by Country 2026 & 2034
Figure 11: North America Methionine Market Revenue Share (%), by Country 2026 & 2034
Figure 12: Europe Methionine Market Revenue (Billion), by Source 2026 & 2034
Figure 13: Europe Methionine Market Revenue Share (%), by Source 2026 & 2034
Figure 14: Europe Methionine Market Revenue (Billion), by Application 2026 & 2034
Figure 15: Europe Methionine Market Revenue Share (%), by Application 2026 & 2034
Figure 16: Europe Methionine Market Revenue (Billion), by Form 2026 & 2034
Figure 17: Europe Methionine Market Revenue Share (%), by Form 2026 & 2034
Table 14: Europe Methionine Market Revenue Billion Forecast, by Source 2020 & 2034
Table 15: Europe Methionine Market Revenue Billion Forecast, by Application 2020 & 2034
Table 16: Europe Methionine Market Revenue Billion Forecast, by Form 2020 & 2034
Table 17: Europe Methionine Market Revenue Billion Forecast, by End Use Industry 2020 & 2034
Frequently Asked Questions
1. What is the current size of the global methionine market?
The global methionine market was valued at USD 3,656.7 Million in 2024 and is projected to reach USD 9,879.2 Million by 2035, growing at a CAGR of 9.46%.
2. Which region dominates the methionine market?
Asia-Pacific led the market with a 47.8% revenue share in 2024, driven by China's poultry and aquaculture sectors and India's expanding livestock industry.
3. What is the leading application segment for methionine?
Animal feed accounted for 60.7% of global methionine revenue in 2024, fueled by rising demand for animal protein and feed efficiency optimization.
4. Who are the key players in the methionine market?
Major companies include Evonik Industries, Adisseo, CJ CheilJedang, Novus International, Sumitomo Chemical, and DSM Nutritional Products, among others.
5. Why is plant-based methionine gaining market share?
Plant-based methionine held 87.4% revenue share in 2024 due to sustainability preferences, precision fermentation advancements, and ethical consumer concerns.
11.1.9.2. Products
11.1.9.3. Company Financials
11.1.9.4. SWOT Analysis
11.1.10. Ningxia Eppen Bioengineering
11.1.10.1. Company Overview
11.1.10.2. Products
11.1.10.3. Company Financials
11.1.10.4. SWOT Analysis
11.1.11. Sichuan Huaxi Biological
11.1.11.1. Company Overview
11.1.11.2. Products
11.1.11.3. Company Financials
11.1.11.4. SWOT Analysis
11.1.12. Shandong Wutong Holding Group
11.1.12.1. Company Overview
11.1.12.2. Products
11.1.12.3. Company Financials
11.1.12.4. SWOT Analysis
11.1.13. Amino GmbH
11.1.13.1. Company Overview
11.1.13.2. Products
11.1.13.3. Company Financials
11.1.13.4. SWOT Analysis
11.1.14. Kemin Industries
11.1.14.1. Company Overview
11.1.14.2. Products
11.1.14.3. Company Financials
11.1.14.4. SWOT Analysis
11.1.15. Mitsui & Co
11.1.15.1. Company Overview
11.1.15.2. Products
11.1.15.3. Company Financials
11.1.15.4. SWOT Analysis
11.1.16. SABIC
11.1.16.1. Company Overview
11.1.16.2. Products
11.1.16.3. Company Financials
11.1.16.4. SWOT Analysis
11.1.17. Altacor LLC
11.1.17.1. Company Overview
11.1.17.2. Products
11.1.17.3. Company Financials
11.1.17.4. SWOT Analysis
11.2. Market Entropy
11.2.1. Company's Key Areas Served
11.2.2. Recent Developments
11.3. Company Market Share Analysis, 2026
11.3.1. Top 5 Companies Market Share Analysis
11.3.2. Top 3 Companies Market Share Analysis
11.4. List of Potential Customers
Figure 18: Europe Methionine Market Revenue (Billion), by End Use Industry 2026 & 2034
Figure 19: Europe Methionine Market Revenue Share (%), by End Use Industry 2026 & 2034
Figure 20: Europe Methionine Market Revenue (Billion), by Country 2026 & 2034
Figure 21: Europe Methionine Market Revenue Share (%), by Country 2026 & 2034
Figure 22: Asia Pacific Methionine Market Revenue (Billion), by Source 2026 & 2034
Figure 23: Asia Pacific Methionine Market Revenue Share (%), by Source 2026 & 2034
Figure 24: Asia Pacific Methionine Market Revenue (Billion), by Application 2026 & 2034
Figure 25: Asia Pacific Methionine Market Revenue Share (%), by Application 2026 & 2034
Figure 26: Asia Pacific Methionine Market Revenue (Billion), by Form 2026 & 2034
Figure 27: Asia Pacific Methionine Market Revenue Share (%), by Form 2026 & 2034
Figure 28: Asia Pacific Methionine Market Revenue (Billion), by End Use Industry 2026 & 2034
Figure 29: Asia Pacific Methionine Market Revenue Share (%), by End Use Industry 2026 & 2034
Figure 30: Asia Pacific Methionine Market Revenue (Billion), by Country 2026 & 2034
Figure 31: Asia Pacific Methionine Market Revenue Share (%), by Country 2026 & 2034
Figure 32: South America Methionine Market Revenue (Billion), by Source 2026 & 2034
Figure 33: South America Methionine Market Revenue Share (%), by Source 2026 & 2034
Figure 34: South America Methionine Market Revenue (Billion), by Application 2026 & 2034
Figure 35: South America Methionine Market Revenue Share (%), by Application 2026 & 2034
Figure 36: South America Methionine Market Revenue (Billion), by Form 2026 & 2034
Figure 37: South America Methionine Market Revenue Share (%), by Form 2026 & 2034
Figure 38: South America Methionine Market Revenue (Billion), by End Use Industry 2026 & 2034
Figure 39: South America Methionine Market Revenue Share (%), by End Use Industry 2026 & 2034
Figure 40: South America Methionine Market Revenue (Billion), by Country 2026 & 2034
Figure 41: South America Methionine Market Revenue Share (%), by Country 2026 & 2034
Figure 42: Middle East & Africa Methionine Market Revenue (Billion), by Source 2026 & 2034
Figure 43: Middle East & Africa Methionine Market Revenue Share (%), by Source 2026 & 2034
Figure 44: Middle East & Africa Methionine Market Revenue (Billion), by Application 2026 & 2034
Figure 45: Middle East & Africa Methionine Market Revenue Share (%), by Application 2026 & 2034
Figure 46: Middle East & Africa Methionine Market Revenue (Billion), by Form 2026 & 2034
Figure 47: Middle East & Africa Methionine Market Revenue Share (%), by Form 2026 & 2034
Figure 48: Middle East & Africa Methionine Market Revenue (Billion), by End Use Industry 2026 & 2034
Figure 49: Middle East & Africa Methionine Market Revenue Share (%), by End Use Industry 2026 & 2034
Figure 50: Middle East & Africa Methionine Market Revenue (Billion), by Country 2026 & 2034
Figure 51: Middle East & Africa Methionine Market Revenue Share (%), by Country 2026 & 2034
Table 18: Europe Methionine Market Revenue Billion Forecast, by Country 2020 & 2034