Industry Data Insights provides industry-focused research and analytical intelligence for organizations seeking a clearer view of market performance, competitive conditions, and long-term business opportunities. Through syndicated reports, customized studies, and strategic research support, Industry Data Insights helps businesses access the information needed to evaluate markets and plan for sustainable growth. Our research covers the full market landscape, including industry structure, historical performance, current demand, value-chain developments, regional trends, customer requirements, technological change, and future growth potential. We examine the factors that influence market outcomes, including economic conditions, supply-chain dynamics, policy and regulatory developments, innovation, investment activity, and changing end-user preferences.
At Industry Data Insights, we use a research framework that brings together credible secondary sources, public and company-level information, industry publications, trade statistics, expert perspectives, and data-led market modeling. Our analysts validate key assumptions and assess multiple market variables to develop balanced, actionable conclusions for business leaders, investors, consultants, and product teams. Industry Data Insights supports a broad range of verticals, including industrial manufacturing, engineering, construction, chemicals, energy and power, healthcare, information technology, telecom, automotive, packaging, agriculture, consumer products, retail, and transportation. Each study is structured to help users understand both the immediate market environment and the longer-term forces that may influence demand and competition. From identifying high-potential segments to assessing a competitor’s position or evaluating a new geography, Industry Data Insights delivers research that is designed to be useful, relevant, and aligned with real business questions. Our goal is to turn industry data into strategic direction.
Home Furnishing Market Report: Size, Share & 2030 Forecast
Home Furnishing Market Report: Size, Share & 2030 Forecast
Home Furnishing Market Report by Home Furnishing (Home Furniture, Home Textile, Home Flooring), by Type (Indoor, Outdoor), by Distribution Channel (Specialty Store, Online), by Material (Wood, Metals, Plastics and Glass), by North America (USA, Canada, Mexico), by Europe (Germany, UK, France), by Asia Pacific (China, Japan, India), by Middle East & Africa (Saudi Arabia, UAE, South Africa), by South America (Brazil, Argentina) Forecast 2026-2034
Home Furnishing Market Report: Size, Share & 2030 Forecast
Discover the Latest Market Insight Reports
Access in-depth insights on industries, companies, trends, and global markets. Our expertly curated reports provide the most relevant data and analysis in a condensed, easy-to-read format.
Home Furnishing Market Report: 2024 Valuation and 2030 Outlook
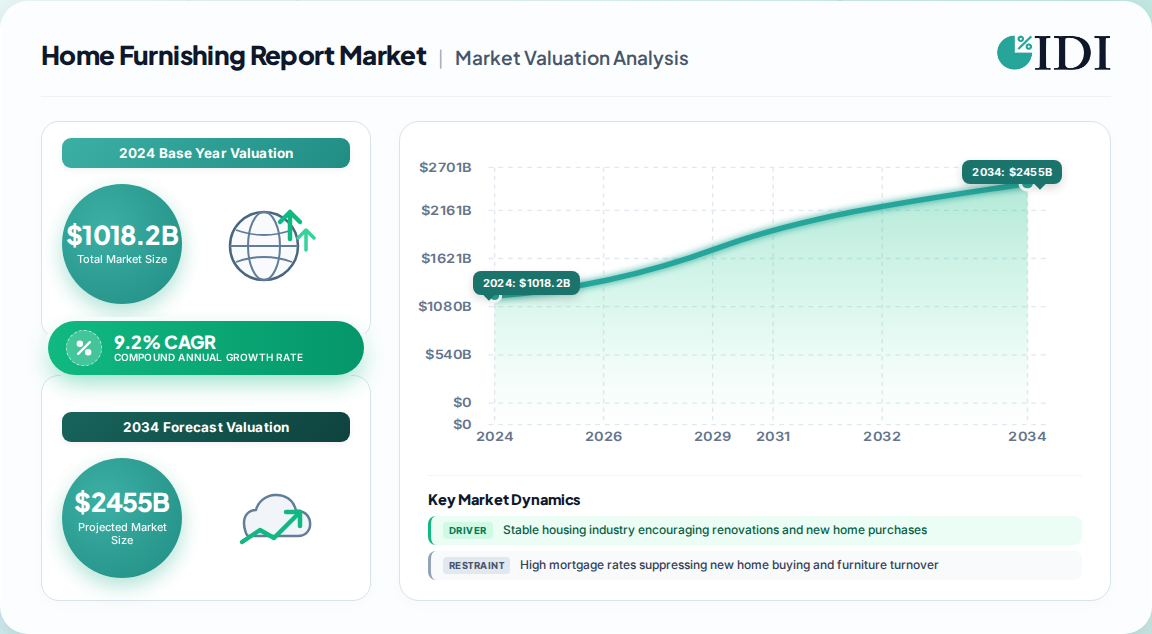
The global home furnishing market reached USD 1,018.2 billion in 2024 and is projected to attain USD 1,703.86 billion by 2030, registering a 9.2% CAGR across the 2025–2030 forecast window. This first-party research synthesis draws on proprietary demand modeling, executive interviews with retailers and manufacturers, and cross-validation against official trade statistics from UN Comtrade and Eurostat.
Home Furnishing Market Report Market Size (In Million)
2.0M
1.5M
1.0M
500.0k
0
1.112 M
2025
1.214 M
2026
1.326 M
2027
1.448 M
2028
1.581 M
2029
1.727 M
2030
1.885 M
2031
Home Furnishing Market Report Market Size (In Million)
Year
Market Size
2025
1.112 M
2026
1.214 M
2027
1.326 M
2028
1.448 M
2029
1.581 M
2030
1.727 M
2031
1.885 M
North America anchored global demand with a 36.67% revenue share in 2024, while Asia Pacific is confirmed as the fastest-growing region. The U.S. alone contributed 67.56% of North American revenue, underscoring the concentration of consumer spending power in this market.
Base year market size (2024): USD 1,018.2 billion
2026 estimated size: USD 1,098.2 billion
2030 forecast: USD 1,703.86 billion
CAGR (2025–2030): 9.2%
Region
2024 Revenue Share
Growth Profile
North America
36.67%
Mature, replacement-driven
Asia Pacific
~28.0%
Fastest-growing, urbanization-led
Europe
~22.1%
Regulation-led sustainability
Middle East & Africa
~6.3%
Emerging, rent-to-own entry
South America
~6.8%
Franchise and licensing expansion
Home Furniture Segment Dominance at 50.76% Revenue Share
The product hierarchy remains anchored by home furniture, which captured a 50.76% revenue share in 2024. Within this pillar, modular and flat-pack furniture designs—desks, shelving, storage, side tables, children's furniture, and small upholstered pieces—are experiencing outsized demand from urban renters who require disassemblable, transportable solutions.
Home textiles (bedding, curtains, and decor) benefit from frequent stylistic refresh cycles, while home flooring advances through luxury vinyl tiles and high-performance resilient materials. Upholstery fabric technology has extended product lifespans by over 30%, a critical consideration for both residential and commercial buyers.
Home furniture: 50.76% share (2024); modular design and specialized hardware driving innovation
Home textiles: Premium sleep accessories and decorative soft goods with shorter replacement cycles
Home flooring: Durable, aesthetically versatile luxury vinyl and engineered surfaces
Indoor Versus Outdoor Furnishing: The 92.44% Indoor Concentration
By type, indoor home furnishing commanded a 92.44% revenue share in 2024, reflecting the core residential replacement and renovation cycle. However, the outdoor segment is gaining strategic importance as urban consumers repurpose balconies and patios as extended living areas.
Limited indoor square footage in dense metropolitan markets—the United Nations projects 68% of the global population will reside in urban areas by 2050—is pushing consumers toward multi-purpose, space-maximizing furniture. This simultaneously fuels demand for compact outdoor furniture and decor that converts underutilized exterior space into functional living zones.
Indoor (92.44%): Core furniture, textiles, and flooring tied to housing turnover and renovation
Outdoor: Balcony and patio furnishing as a release valve for constrained living spaces
Specialty Store and Online Distribution: The 34.94% E-Commerce Shift
Distribution channel dynamics reveal a structural transition. Online channels held a 34.94% revenue share in 2024, while specialty stores and other offline formats retain the majority but face margin pressure. The shift demands robust digital infrastructure: user-friendly interfaces, secure payment rails, and efficient last-mile delivery.
A 2024 consumer survey of U.S. buyers identified purchase triggers that channel strategy must accommodate:
Need-based purchases: 34% (most common trigger)
Redecoration events: 28%
Promotional events: 28%
Traditional holiday periods: 26%
Sales periods (Presidents Day, Independence Day): 21%
Generational divergence is stark. Baby Boomers buy as needed (45%) and rarely during moves (15%), while Gen Z purchases surge during holidays (65%) and moving events (53%). Gen X and Millennials cluster around holiday and redecoration triggers.
Trump Tariff Adjustments and Supply Chain Reconfiguration
On 12 May 2025, the United States and China agreed to a 90-day tariff cease-fire, reducing U.S. levies on Chinese goods from 145% to 30% and Chinese tariffs on U.S. goods from 125% to 10%. This provided short-term relief ahead of back-to-school and holiday selling seasons, with import-dependent retailers seeing immediate equity gains.
However, the residual 30% tariff remains a material cost burden. Manufacturers are reassessing sourcing footprints, evaluating shifts toward Vietnam, India, and Brazil. The temporary nature of the truce deters long-term infrastructure investment, forcing a trade-off between immediate cost savings and future tariff-escalation risk.
Retailer relief: Lower import costs for the 2025 holiday build
Manufacturer strategy: Diversification of sourcing away from single-country dependence
Housing Cycles, Rental Living, and Sustainability Drivers
A stable housing industry directly stimulates renovation and new-home furnishing demand. Rising disposable incomes in China and India amplify spending on home aesthetics. Meanwhile, high real estate costs in urban centers sustain a large rental population that favors affordable, lightweight, and easily movable furniture—a structural tailwind for flat-pack formats.
Sustainability has moved from niche preference to purchasing criterion. Consumers increasingly seek decor made from recycled materials, organic fabrics, natural fibers, and sustainably sourced timber. In Europe, digital product passport mandates are formalizing this shift, while in North America, eco-friendly positioning commands premium pricing in textiles and flooring.
Housing turnover: Core demand trigger for furniture and flooring
Sustainability: Material sourcing, circular economy models, and regulatory compliance
Competitive Landscape and Strategic Developments
The market remains fragmented across specialty retail, e-commerce platforms, and vertically integrated manufacturers. Key players include IKEA, Wayfair, RH, The TJX Companies, and Williams-Sonoma, alongside direct-to-consumer brands leveraging platform analytics to optimize last-mile logistics.
Recent developments underscore the strategic pivot points:
May 2025: U.S.–China 90-day tariff cease-fire reduced import levies, with Wayfair shares rising over 21% and RH over 17% on the announcement.
2025–2026: European dropshipping intermediaries are actively recruiting EU-based furniture and home goods suppliers capable of single-order fulfillment to Benelux consumers, with API-integrated product feeds and neutral packaging as prerequisites.
Ongoing: Smart home integration—intelligent lighting, automated furniture, and sleep-monitoring beds—is emerging as a premium innovation frontier.
Regional Growth Frontiers: U.S. Concentration and APAC Momentum
The U.S. market's 67.56% share of North American revenue reflects both scale and maturity; growth here is replacement-driven and sensitive to mortgage rates and housing starts. IBISWorld-tracked home furnishings stores revenue has contracted at a 1.8% CAGR over five years to an estimated USD 69.0 billion in 2026, illustrating channel dislocation rather than demand erosion—spending is migrating online and to alternative formats.
Home Furnishing Market Report Regional Market Share
Loading chart...
Home Furnishing Market Report Regional Market Share
Region
Market Share (%)
North America
0.37%
Europe
0.22%
Asia-Pacific
0.28%
South America
0.07%
Middle East & Africa
0.06%
Asia Pacific's fastest-growing status is underpinned by manufacturing efficiency (lead times reduced by over 20% versus other regions), a rapidly expanding middle class, and accelerating urbanization. Europe's trajectory is shaped by stringent sustainability regulation, while the Middle East and South America advance through rent-to-own franchising and brand licensing models.
North America: Replacement demand, housing sensitivity, e-commerce migration
Asia Pacific: Production hub plus consumption growth; urbanization-led
Europe: Regulatory-driven sustainability and digital product passports
MEA & South America: Franchise, licensing, and rent-to-own market entry
Home Furnishing Market Report Regional Market Share
Higher Coverage
Lower Coverage
No Coverage
Home Furnishing Market Report REPORT HIGHLIGHTS
Research Methodology & Data Sources
Our rigorous research methodology combines multi-layered approaches with comprehensive quality assurance, ensuring precision, accuracy, and reliability in every market analysis.
Primary Research
70–80% of total research effort is allocated to primary intelligence gathering, conducted continuously through the purchase date to guarantee currency.
We conduct structured interviews with 4–5 distinct company types across the value chain: vertically integrated furniture manufacturers, home textile mills, flat-pack and modular furniture OEMs, specialty retail chains, and e-commerce marketplace operators.
Stakeholder interviews target 3–4 specific job titles: Chief Merchandising Officer, VP of Supply Chain & Sourcing, Head of E-commerce Operations, and Category Director for Home Furnishings.
Direct engagement with industry associations and regulatory bodies, including the Home Furnishings Association (HFA), the American Home Furnishings Alliance (AHFA), the European Furniture Industries Confederation (EFIC), and the U.S. Consumer Product Safety Commission (CPSC) for compliance benchmarking.
Raw input capture spans 3–4 quantitative metrics per respondent: revenue per SKU, sell-through velocity by channel, import cost per container, and replacement-cycle frequency.
Key Stakeholders Interviewed
Key Stakeholders Interviewed
Stakeholder Role
Interview Share (%)
Chief Merchandising Officer
25%
VP of Supply Chain & Sourcing
30%
Head of E-commerce Operations
27%
Category Director, Home Furnishings
18%
Industry Ecosystem Breakdown
Industry Ecosystem Breakdown
Company Type
Representation (%)
Furniture & Modular OEM Manufacturers
28%
Home Textile Mills & Converters
18%
Specialty Retail Chains
22%
E-commerce Marketplaces & DTC Brands
20%
Flooring & Hard Surface Producers
12%
Secondary Research & Industry Benchmarking
20–30% of research draws on official multilateral and governmental datasets, including UN Comtrade for cross-border furniture and textile flows, Eurostat for EU consumption and digital product passport compliance, U.S. ITC for tariff and import data, and OECD for household expenditure indicators.
Trade association publications, including those from the Home Furnishings Association and EFIC, provide non-commercial benchmarks for retail performance and sourcing patterns.
All secondary inputs are cross-checked against primary interview findings; discrepancies above a 5% threshold trigger targeted re-interviewing.
Demand Modeling & Market Estimation
We deploy top-down and bottom-up methodologies simultaneously. The top-down approach sizes the market from national consumption and import data, while the bottom-up model aggregates revenue across product lines, distribution channels, and company-level disclosures.
Bottom-up calculation metrics include: (1) per-capita home furnishing spend multiplied by addressable population cohorts; (2) specialty store revenue per square foot multiplied by retail footprint; (3) online GMV per active buyer multiplied by buyer counts; and (4) manufacturer shipment volumes valued at ex-factory pricing.
Multi-level data triangulation reconciles top-down and bottom-up outputs, with variance resolved through weighted averaging based on source reliability scores.
Segment forecasts (product, type, distribution channel, region) are generated using time-series regression with housing-start, disposable-income, and e-commerce-penetration covariates.
Data Accuracy & Quality Check
Every report carries a guaranteed estimated data accuracy level of 85–90%, documented in the methodology appendix.
All datasets are updated to the date of purchase, ensuring tariff developments, regulatory changes, and company events are reflected in real time.
A three-tier validation protocol applies: Tier 1 cross-source verification, Tier 2 expert panel review, and Tier 3 statistical outlier screening.
Confidence intervals are disclosed for all headline figures; regional and segment estimates carry a stated margin of error not exceeding ±7%.
Aspects
Details
Study Period
2020-2034
Base Year
2025
Estimated Year
2026
Forecast Period
2026-2034
Historical Period
2020-2025
Growth Rate
CAGR of 9.2% from 2020-2034
Segmentation
By Home Furnishing
Home Furniture
Home Textile
Home Flooring
By Type
Indoor
Outdoor
By Distribution Channel
Specialty Store
Online
By Material
Wood
Metals
Plastics and Glass
By Geography
North America
USA
Canada
Mexico
Europe
Germany
UK
France
Asia Pacific
China
Japan
India
Middle East & Africa
Saudi Arabia
UAE
South Africa
South America
Brazil
Argentina
Table of Contents
1. Home Furnishing Market Report Introduction
1.1. Research Scope
1.2. Market Segmentation
1.3. Research Objective
1.4. Definitions and Assumptions
2. Home Furnishing Market Report Executive Summary
2.1. Market Snapshot
3. Home Furnishing Market Report Market Dynamics
3.1. Introduction
3.2. Market Drivers
3.2.1. Stable housing industry encouraging renovations and new home purchases
3.2.2. Rising disposable incomes in emerging economies like China and India
3.2.3. Accelerating urbanization with 68% of global population in cities by 2050
3.2.4. Increase in rental living favoring affordable, movable flat-pack furniture
3.2.5. Growing interest in outdoor decor for balconies and patios
3.3. Market Restrains
3.3.1. High mortgage rates suppressing new home buying and furniture turnover
3.3.2. Global supply chain complexities and raw material price volatility
3.3.3. Residual 30% U.S. tariff on Chinese goods increasing import costs
3.3.4. Competitive pressure on brick-and-mortar stores from e-commerce migration
3.4. Market Trends
3.4.1. Rising demand for multifunctional and modular furniture in smaller urban living spaces
3.4.2. Shift toward sustainable and eco-friendly home furnishing materials
3.4.3. Growth of e-commerce with virtual room visualization and augmented reality tools
3.4.4. Integration of smart home technology into furniture and lighting
3.4.5. Personalized and customizable decor reflecting individual style
4. Home Furnishing Market Report Market Factor Analysis
4.1. Porters Five Forces
4.1.1. Bargaining Power of Suppliers
4.1.2. Bargaining Power of Buyers
4.1.3. Threat of New Entrants
4.1.4. Threat of Substitutes
4.1.5. Competitive Rivalry
4.2. PESTEL analysis
4.3. BCG Analysis
4.3.1. Stars (High Growth, High Market Share)
4.3.2. Cash Cows (Low Growth, High Market Share)
4.3.3. Question Mark (High Growth, Low Market Share)
4.3.4. Dogs (Low Growth, Low Market Share)
4.4. Ansoff Matrix Analysis
4.5. Supply Chain Analysis
4.6. Regulatory Landscape
4.7. Current Market Potential and Opportunity Assessment (TAM–SAM–SOM Framework)
4.8. IDI Analyst Note
5. Home Furnishing Market Report Market Analysis, Insights and Forecast, 2020-2034
5.1. Market Analysis, Insights and Forecast - by Home Furnishing
5.1.1. Home Furniture
5.1.2. Home Textile
5.1.3. Home Flooring
5.2. Market Analysis, Insights and Forecast - by Type
5.2.1. Indoor
5.2.2. Outdoor
5.3. Market Analysis, Insights and Forecast - by Distribution Channel
5.3.1. Specialty Store
5.3.2. Online
5.4. Market Analysis, Insights and Forecast - by Material
5.4.1. Wood
5.4.2. Metals
5.4.3. Plastics and Glass
5.5. Market Analysis, Insights and Forecast - by Region
5.5.1. North America
5.5.2. Europe
5.5.3. Asia Pacific
5.5.4. Middle East & Africa
5.5.5. South America
6. Home Furnishing Market Report North America Market Analysis, Insights and Forecast, 2020-2034
6.1. Market Analysis, Insights and Forecast - by Home Furnishing
6.1.1. Home Furniture
6.1.2. Home Textile
6.1.3. Home Flooring
6.2. Market Analysis, Insights and Forecast - by Type
6.2.1. Indoor
6.2.2. Outdoor
6.3. Market Analysis, Insights and Forecast - by Distribution Channel
6.3.1. Specialty Store
6.3.2. Online
6.4. Market Analysis, Insights and Forecast - by Material
6.4.1. Wood
6.4.2. Metals
6.4.3. Plastics and Glass
7. Home Furnishing Market Report Europe Market Analysis, Insights and Forecast, 2020-2034
7.1. Market Analysis, Insights and Forecast - by Home Furnishing
7.1.1. Home Furniture
7.1.2. Home Textile
7.1.3. Home Flooring
7.2. Market Analysis, Insights and Forecast - by Type
7.2.1. Indoor
7.2.2. Outdoor
7.3. Market Analysis, Insights and Forecast - by Distribution Channel
7.3.1. Specialty Store
7.3.2. Online
7.4. Market Analysis, Insights and Forecast - by Material
7.4.1. Wood
7.4.2. Metals
7.4.3. Plastics and Glass
8. Home Furnishing Market Report Asia Pacific Market Analysis, Insights and Forecast, 2020-2034
8.1. Market Analysis, Insights and Forecast - by Home Furnishing
8.1.1. Home Furniture
8.1.2. Home Textile
8.1.3. Home Flooring
8.2. Market Analysis, Insights and Forecast - by Type
8.2.1. Indoor
8.2.2. Outdoor
8.3. Market Analysis, Insights and Forecast - by Distribution Channel
8.3.1. Specialty Store
8.3.2. Online
8.4. Market Analysis, Insights and Forecast - by Material
8.4.1. Wood
8.4.2. Metals
8.4.3. Plastics and Glass
9. Home Furnishing Market Report Middle East & Africa Market Analysis, Insights and Forecast, 2020-2034
9.1. Market Analysis, Insights and Forecast - by Home Furnishing
9.1.1. Home Furniture
9.1.2. Home Textile
9.1.3. Home Flooring
9.2. Market Analysis, Insights and Forecast - by Type
9.2.1. Indoor
9.2.2. Outdoor
9.3. Market Analysis, Insights and Forecast - by Distribution Channel
9.3.1. Specialty Store
9.3.2. Online
9.4. Market Analysis, Insights and Forecast - by Material
9.4.1. Wood
9.4.2. Metals
9.4.3. Plastics and Glass
10. Home Furnishing Market Report South America Market Analysis, Insights and Forecast, 2020-2034
10.1. Market Analysis, Insights and Forecast - by Home Furnishing
10.1.1. Home Furniture
10.1.2. Home Textile
10.1.3. Home Flooring
10.2. Market Analysis, Insights and Forecast - by Type
10.2.1. Indoor
10.2.2. Outdoor
10.3. Market Analysis, Insights and Forecast - by Distribution Channel
10.3.1. Specialty Store
10.3.2. Online
10.4. Market Analysis, Insights and Forecast - by Material
10.4.1. Wood
10.4.2. Metals
10.4.3. Plastics and Glass
11. Home Furnishing Market Report Competitive Analysis
11.1. Company Profiles
11.1.1. IKEA
11.1.1.1. Company Overview
11.1.1.2. Products
11.1.1.3. Company Financials
11.1.1.4. SWOT Analysis
11.1.2. Wayfair
11.1.2.1. Company Overview
11.1.2.2. Products
11.1.2.3. Company Financials
11.1.2.4. SWOT Analysis
11.1.3. RH
11.1.3.1. Company Overview
11.1.3.2. Products
11.1.3.3. Company Financials
11.1.3.4. SWOT Analysis
11.1.4. The TJX Companies Inc.
11.1.4.1. Company Overview
11.1.4.2. Products
11.1.4.3. Company Financials
11.1.4.4. SWOT Analysis
11.1.5. Williams-Sonoma Inc.
11.1.5.1. Company Overview
11.1.5.2. Products
11.1.5.3. Company Financials
11.1.5.4. SWOT Analysis
11.2. Market Entropy
11.2.1. Company's Key Areas Served
11.2.2. Recent Developments
11.3. Company Market Share Analysis, 2026
11.3.1. Top 5 Companies Market Share Analysis
11.3.2. Top 3 Companies Market Share Analysis
11.4. List of Potential Customers
12. Home Furnishing Market Report Research Methodology
List of Figures
Figure 1: Home Furnishing Market Report Revenue Breakdown (Billion, %) by Region 2026 & 2034
Figure 2: North America Home Furnishing Market Report Revenue (Billion), by Home Furnishing 2026 & 2034
Figure 3: North America Home Furnishing Market Report Revenue Share (%), by Home Furnishing 2026 & 2034
Figure 4: North America Home Furnishing Market Report Revenue (Billion), by Type 2026 & 2034
Figure 5: North America Home Furnishing Market Report Revenue Share (%), by Type 2026 & 2034
Figure 6: North America Home Furnishing Market Report Revenue (Billion), by Distribution Channel 2026 & 2034
Figure 7: North America Home Furnishing Market Report Revenue Share (%), by Distribution Channel 2026 & 2034
Figure 8: North America Home Furnishing Market Report Revenue (Billion), by Material 2026 & 2034
Figure 9: North America Home Furnishing Market Report Revenue Share (%), by Material 2026 & 2034
Figure 10: North America Home Furnishing Market Report Revenue (Billion), by Country 2026 & 2034
Figure 11: North America Home Furnishing Market Report Revenue Share (%), by Country 2026 & 2034
Figure 12: Europe Home Furnishing Market Report Revenue (Billion), by Home Furnishing 2026 & 2034
Figure 13: Europe Home Furnishing Market Report Revenue Share (%), by Home Furnishing 2026 & 2034
Figure 14: Europe Home Furnishing Market Report Revenue (Billion), by Type 2026 & 2034
Figure 15: Europe Home Furnishing Market Report Revenue Share (%), by Type 2026 & 2034
Figure 16: Europe Home Furnishing Market Report Revenue (Billion), by Distribution Channel 2026 & 2034
List of Tables
Table 1: Home Furnishing Market Report Revenue Billion Forecast, by Home Furnishing 2020 & 2034
Table 2: Home Furnishing Market Report Revenue Billion Forecast, by Type 2020 & 2034
Table 3: Home Furnishing Market Report Revenue Billion Forecast, by Distribution Channel 2020 & 2034
Table 4: Home Furnishing Market Report Revenue Billion Forecast, by Material 2020 & 2034
Table 5: Home Furnishing Market Report Revenue Billion Forecast, by Region 2020 & 2034
Table 6: North America Home Furnishing Market Report Revenue Billion Forecast, by Home Furnishing 2020 & 2034
Table 7: North America Home Furnishing Market Report Revenue Billion Forecast, by Type 2020 & 2034
Table 8: North America Home Furnishing Market Report Revenue Billion Forecast, by Distribution Channel 2020 & 2034
Table 9: North America Home Furnishing Market Report Revenue Billion Forecast, by Material 2020 & 2034
Table 10: North America Home Furnishing Market Report Revenue Billion Forecast, by Country 2020 & 2034
Table 11: USA Home Furnishing Market Report Revenue (Billion) Forecast, by Application 2020 & 2034
Table 12: Canada Home Furnishing Market Report Revenue (Billion) Forecast, by Application 2020 & 2034
Table 13: Mexico Home Furnishing Market Report Revenue (Billion) Forecast, by Application 2020 & 2034
Table 14: Europe Home Furnishing Market Report Revenue Billion Forecast, by Home Furnishing 2020 & 2034
Table 15: Europe Home Furnishing Market Report Revenue Billion Forecast, by Type 2020 & 2034
Europe Home Furnishing Market Report Revenue Billion Forecast, by Distribution Channel 2020 & 2034
Frequently Asked Questions
1. What is the size of the global home furnishing market?
The global home furnishing market was estimated at USD 1,018.2 billion in 2024 and is projected to reach USD 1,703.86 billion by 2030, growing at a CAGR of 9.2% from 2025 to 2030.
2. Which region dominates the home furnishing market?
North America held the largest revenue share at 36.67% in 2024, with the U.S. accounting for 67.56% of that regional revenue. Asia Pacific is identified as the fastest-growing region over the forecast period.
3. What product segment leads the home furnishing market?
Home furniture was the leading product segment, capturing a 50.76% revenue share in 2024. Home textiles and home flooring follow, with indoor furnishing representing 92.44% of type-segmented revenue.
4. How large is the online distribution channel in home furnishing?
Online channels accounted for a 34.94% revenue share in 2024. Consumer surveys show 34% of U.S. buyers purchase when they have a need, while 28% buy during redecoration or promotional events.
5. How do U.S.-China tariffs affect the home furnishing market?
A 90-day tariff cease-fire announced on 12 May 2025 cut U.S. tariffs on Chinese goods from 145% to 30%. While providing short-term relief for retailers, the remaining 30% levy continues to pressure manufacturers to diversify sourcing to Vietnam, India, and Brazil.
Figure 17: Europe Home Furnishing Market Report Revenue Share (%), by Distribution Channel 2026 & 2034
Figure 18: Europe Home Furnishing Market Report Revenue (Billion), by Material 2026 & 2034
Figure 19: Europe Home Furnishing Market Report Revenue Share (%), by Material 2026 & 2034
Figure 20: Europe Home Furnishing Market Report Revenue (Billion), by Country 2026 & 2034
Figure 21: Europe Home Furnishing Market Report Revenue Share (%), by Country 2026 & 2034
Figure 22: Asia Pacific Home Furnishing Market Report Revenue (Billion), by Home Furnishing 2026 & 2034
Figure 23: Asia Pacific Home Furnishing Market Report Revenue Share (%), by Home Furnishing 2026 & 2034
Figure 24: Asia Pacific Home Furnishing Market Report Revenue (Billion), by Type 2026 & 2034
Figure 25: Asia Pacific Home Furnishing Market Report Revenue Share (%), by Type 2026 & 2034
Figure 26: Asia Pacific Home Furnishing Market Report Revenue (Billion), by Distribution Channel 2026 & 2034
Figure 27: Asia Pacific Home Furnishing Market Report Revenue Share (%), by Distribution Channel 2026 & 2034
Figure 28: Asia Pacific Home Furnishing Market Report Revenue (Billion), by Material 2026 & 2034
Figure 29: Asia Pacific Home Furnishing Market Report Revenue Share (%), by Material 2026 & 2034
Figure 30: Asia Pacific Home Furnishing Market Report Revenue (Billion), by Country 2026 & 2034
Figure 31: Asia Pacific Home Furnishing Market Report Revenue Share (%), by Country 2026 & 2034
Figure 32: Middle East & Africa Home Furnishing Market Report Revenue (Billion), by Home Furnishing 2026 & 2034
Figure 33: Middle East & Africa Home Furnishing Market Report Revenue Share (%), by Home Furnishing 2026 & 2034
Figure 34: Middle East & Africa Home Furnishing Market Report Revenue (Billion), by Type 2026 & 2034
Figure 35: Middle East & Africa Home Furnishing Market Report Revenue Share (%), by Type 2026 & 2034
Figure 36: Middle East & Africa Home Furnishing Market Report Revenue (Billion), by Distribution Channel 2026 & 2034
Figure 37: Middle East & Africa Home Furnishing Market Report Revenue Share (%), by Distribution Channel 2026 & 2034
Figure 38: Middle East & Africa Home Furnishing Market Report Revenue (Billion), by Material 2026 & 2034
Figure 39: Middle East & Africa Home Furnishing Market Report Revenue Share (%), by Material 2026 & 2034
Figure 40: Middle East & Africa Home Furnishing Market Report Revenue (Billion), by Country 2026 & 2034
Figure 41: Middle East & Africa Home Furnishing Market Report Revenue Share (%), by Country 2026 & 2034
Figure 42: South America Home Furnishing Market Report Revenue (Billion), by Home Furnishing 2026 & 2034
Figure 43: South America Home Furnishing Market Report Revenue Share (%), by Home Furnishing 2026 & 2034
Figure 44: South America Home Furnishing Market Report Revenue (Billion), by Type 2026 & 2034
Figure 45: South America Home Furnishing Market Report Revenue Share (%), by Type 2026 & 2034
Figure 46: South America Home Furnishing Market Report Revenue (Billion), by Distribution Channel 2026 & 2034
Figure 47: South America Home Furnishing Market Report Revenue Share (%), by Distribution Channel 2026 & 2034
Figure 48: South America Home Furnishing Market Report Revenue (Billion), by Material 2026 & 2034
Figure 49: South America Home Furnishing Market Report Revenue Share (%), by Material 2026 & 2034
Figure 50: South America Home Furnishing Market Report Revenue (Billion), by Country 2026 & 2034
Figure 51: South America Home Furnishing Market Report Revenue Share (%), by Country 2026 & 2034
Table 16:
Table 17: Europe Home Furnishing Market Report Revenue Billion Forecast, by Material 2020 & 2034
Table 18: Europe Home Furnishing Market Report Revenue Billion Forecast, by Country 2020 & 2034
Table 19: Germany Home Furnishing Market Report Revenue (Billion) Forecast, by Application 2020 & 2034
Table 20: UK Home Furnishing Market Report Revenue (Billion) Forecast, by Application 2020 & 2034
Table 21: France Home Furnishing Market Report Revenue (Billion) Forecast, by Application 2020 & 2034
Table 22: Asia Pacific Home Furnishing Market Report Revenue Billion Forecast, by Home Furnishing 2020 & 2034
Table 23: Asia Pacific Home Furnishing Market Report Revenue Billion Forecast, by Type 2020 & 2034
Table 24: Asia Pacific Home Furnishing Market Report Revenue Billion Forecast, by Distribution Channel 2020 & 2034
Table 25: Asia Pacific Home Furnishing Market Report Revenue Billion Forecast, by Material 2020 & 2034
Table 26: Asia Pacific Home Furnishing Market Report Revenue Billion Forecast, by Country 2020 & 2034
Table 27: China Home Furnishing Market Report Revenue (Billion) Forecast, by Application 2020 & 2034
Table 28: Japan Home Furnishing Market Report Revenue (Billion) Forecast, by Application 2020 & 2034
Table 29: India Home Furnishing Market Report Revenue (Billion) Forecast, by Application 2020 & 2034
Table 30: Middle East & Africa Home Furnishing Market Report Revenue Billion Forecast, by Home Furnishing 2020 & 2034
Table 31: Middle East & Africa Home Furnishing Market Report Revenue Billion Forecast, by Type 2020 & 2034
Table 32: Middle East & Africa Home Furnishing Market Report Revenue Billion Forecast, by Distribution Channel 2020 & 2034
Table 33: Middle East & Africa Home Furnishing Market Report Revenue Billion Forecast, by Material 2020 & 2034
Table 34: Middle East & Africa Home Furnishing Market Report Revenue Billion Forecast, by Country 2020 & 2034
Table 35: Saudi Arabia Home Furnishing Market Report Revenue (Billion) Forecast, by Application 2020 & 2034
Table 36: UAE Home Furnishing Market Report Revenue (Billion) Forecast, by Application 2020 & 2034
Table 37: South Africa Home Furnishing Market Report Revenue (Billion) Forecast, by Application 2020 & 2034
Table 38: South America Home Furnishing Market Report Revenue Billion Forecast, by Home Furnishing 2020 & 2034
Table 39: South America Home Furnishing Market Report Revenue Billion Forecast, by Type 2020 & 2034
Table 40: South America Home Furnishing Market Report Revenue Billion Forecast, by Distribution Channel 2020 & 2034
Table 41: South America Home Furnishing Market Report Revenue Billion Forecast, by Material 2020 & 2034
Table 42: South America Home Furnishing Market Report Revenue Billion Forecast, by Country 2020 & 2034
Table 43: Brazil Home Furnishing Market Report Revenue (Billion) Forecast, by Application 2020 & 2034
Table 44: Argentina Home Furnishing Market Report Revenue (Billion) Forecast, by Application 2020 & 2034