Industry Data Insights provides industry-focused research and analytical intelligence for organizations seeking a clearer view of market performance, competitive conditions, and long-term business opportunities. Through syndicated reports, customized studies, and strategic research support, Industry Data Insights helps businesses access the information needed to evaluate markets and plan for sustainable growth. Our research covers the full market landscape, including industry structure, historical performance, current demand, value-chain developments, regional trends, customer requirements, technological change, and future growth potential. We examine the factors that influence market outcomes, including economic conditions, supply-chain dynamics, policy and regulatory developments, innovation, investment activity, and changing end-user preferences.
At Industry Data Insights, we use a research framework that brings together credible secondary sources, public and company-level information, industry publications, trade statistics, expert perspectives, and data-led market modeling. Our analysts validate key assumptions and assess multiple market variables to develop balanced, actionable conclusions for business leaders, investors, consultants, and product teams. Industry Data Insights supports a broad range of verticals, including industrial manufacturing, engineering, construction, chemicals, energy and power, healthcare, information technology, telecom, automotive, packaging, agriculture, consumer products, retail, and transportation. Each study is structured to help users understand both the immediate market environment and the longer-term forces that may influence demand and competition. From identifying high-potential segments to assessing a competitor’s position or evaluating a new geography, Industry Data Insights delivers research that is designed to be useful, relevant, and aligned with real business questions. Our goal is to turn industry data into strategic direction.
Epharmacies Market by Drug Type (Prescription Drugs, Over-The-Counter Drugs), by Product Type (Vitamins, Skin Care, Cold and Flu, Dental Care, Weight Loss, Others), by End-user (Primary Care Centers, Home Care Settings, Individuals, Commercial), by Platform (App-based, Online Platforms), by Payment Method (Online Payment, Cash on Delivery), by North America (USA, Canada, Mexico), by Europe (Germany, UK, France, Spain, Italy, Russia, Sweden, Denmark, Switzerland, Netherlands, Turkey, Czech Republic), by Asia Pacific (China, Japan, India, South Korea, Australia, Indonesia), by Latin America (Brazil, Argentina, Chile), by Middle East & Africa (Saudi Arabia, UAE, South Africa, Israel, Turkey) Forecast 2026-2034
Epharmacies Market Size 2025: CAGR 12.8% to 2035
Discover the Latest Market Insight Reports
Access in-depth insights on industries, companies, trends, and global markets. Our expertly curated reports provide the most relevant data and analysis in a condensed, easy-to-read format.
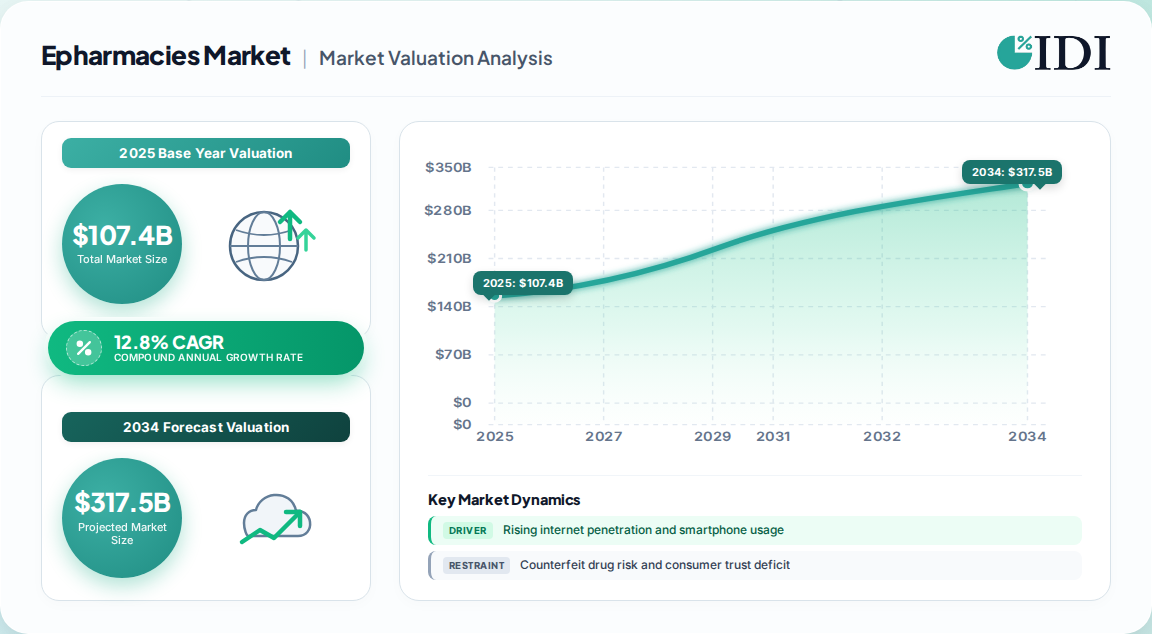
Epharmacies Market Valuation Timeline and Growth Trajectory
The global Epharmacies Market was valued at USD 107.4 billion in 2025 and is projected to reach USD 357.2 billion by 2035, expanding at a 12.8% CAGR from 2026 to 2035. This trajectory reflects a structural shift in medication procurement, where digital discovery converts into dependable prescription fulfillment.
Epharmacies Market Market Size (In Billion)
250.0B
200.0B
150.0B
100.0B
50.0B
0
107.4 B
2025
121.1 B
2026
136.7 B
2027
154.1 B
2028
173.9 B
2029
196.1 B
2030
221.2 B
2031
Epharmacies Market Market Size (In Billion)
Year
Market Size
2025
107.4 B
2026
121.1 B
2027
136.7 B
2028
154.1 B
2029
173.9 B
2030
196.1 B
2031
221.2 B
2025 market size: USD 107.4 billion
2026 estimate: USD 120.4 billion
2035 forecast: USD 357.2 billion
CAGR (2026–2035): 12.8%
North America remains the largest regional market, while Asia Pacific is the fastest-growing, supported by expanding internet infrastructure and e-prescription rollouts. The top five players collectively held 25% market share in 2025, with the market leader commanding over 9%.
Metric
Value
2025 valuation
USD 107.4 Billion
2026 estimate
USD 120.4 Billion
2035 projection
USD 357.2 Billion
CAGR (2026–2035)
12.8%
Largest region
North America
Fastest-growing region
Asia Pacific
Drug Type Segmentation: OTC Dominance and Prescription Acceleration
The market is bifurcated into over-the-counter (OTC) drugs and prescription drugs. OTC commanded the largest share in 2025, exceeding 60% of revenue, driven by self-medication trends and low prescription friction. Prescription drugs represent the fastest-growing segment, propelled by chronic disease management and telehealth integration.
Prescription drugs: Expanding at a rapid pace; e-prescription rollouts and refill subscription models are key catalysts.
Analyst view: Durable growth hinges on converting intermittent OTC purchases into recurring chronic-care relationships. Platforms that combine medication management, refill prompts, and pharmacist review command higher retention.
Platform and Payment Method Dynamics Reshaping Digital Fulfillment
App-based platforms are projected to register the highest CAGR, as smartphone penetration and user-friendly interfaces drive adoption. Online payment methods dominated in 2025, supported by secure gateways and digital wallets.
App-based platforms: Fastest-growing, benefiting from push notifications and loyalty integration.
Online payment: Leading payment method; cash-on-delivery persists in emerging markets.
Fulfillment speed is a competitive battleground. Same-day prescription delivery launches in major metropolitan areas illustrate how digital pharmacies compete on service continuity. AI-assisted prescription processing and inventory forecasting reduce time between prescription receipt and dispatch, improving order processing efficiency by approximately 22% across integrated platforms.
Chronic Care, Telehealth Integration, and Geriatric Demand Drivers
Key demand drivers include the rising prevalence of chronic diseases, an aging global population, and expanding digital health infrastructure. Over 44% of EU adults live with at least one chronic condition, necessitating long-term maintenance medication. The global population aged 60 and older is projected to reach 1.4 billion by 2030, up from 1.1 billion in 2023, amplifying demand for home delivery and adherence support.
Cosmetics and beauty adoptions: +0.9% impact on CAGR (short term)
Healthcare expansion in APAC: +0.7% impact on CAGR (medium term)
E-commerce and retail accessibility: +0.5% impact on CAGR (short term)
Telehealth integration creates end-to-end digital care journeys. In Europe, 18 countries allow ePharmacies to fulfill prescriptions issued during virtual consultations. Germany's digital health application framework has approved 38 apps with e-prescription and pharmacy fulfillment modules, enabling reimbursement pathways.
Regulatory Fragmentation and Counterfeit Risk Restraints
Market growth is bounded by trust and regulatory complexity. Counterfeit drug risk and consumer trust deficits impose a -0.8% impact on CAGR, particularly in developing markets. Strict and fragmented digital pharmacy regulations add a -0.6% drag, while data privacy concerns contribute -0.4%.
Only 15 of 27 EU member states permit cross-border online medicine sales; Spain and Italy restrict ePharmacies to domestic operations.
Prescription verification protocols vary widely: France requires a unique secure token, while Poland accepts a simple digital signature.
Public awareness of safety features like the EU Falsified Medicines Directive remains low, perpetuating skepticism.
These disparities force country-specific compliance architectures, increasing operational complexity. Platforms with direct inventory control and verified seller networks mitigate reputational risk more effectively than open marketplace models.
Regional Market Share: North America Leads, Asia Pacific Accelerates
North America dominated the global market with 38–42% revenue share in 2025, supported by advanced digital health architecture and robust pharmacy benefit management networks. The U.S. market alone reached USD 34.69 billion in 2025.
Epharmacies Market Regional Market Share
Loading chart...
Epharmacies Market Regional Market Share
Region
Market Share (%)
North America
0.38%
Europe
0.26%
Asia-Pacific
0.28%
Latin America
0.04%
Middle East & Africa
0.04%
Europe represents a mature but rapidly standardizing market, with Germany capturing 26.3% of regional share, followed by the UK at 19.2%. National e-prescription systems are operational in 21 EU member states, reducing paper-based inefficiencies.
Asia Pacific is the fastest-growing region, driven by mobile-first demographics and government digital infrastructure. India's internet connections exceeded 970 million in 2025, supported by 481,000 5G base stations, illustrating the scale of the addressable transition.
Region
2025 Share
Growth Outlook
North America
38–42%
Mature, steady growth
Europe
24–26%
Standardizing, moderate growth
Asia Pacific
26–28%
Fastest-growing
Latin America
4–5%
Emerging
Middle East & Africa
4–5%
Early-stage, high potential
Competitive Landscape and Recent Industry Developments
The market is moderately concentrated, with the top five players holding 25% share in 2025. Leading companies include CVS Health, Walgreens Boots Alliance, Amazon Pharmacy, JD Health, and Alibaba Health. The market leader commanded over 9% share.
Recent developments signal strategic shifts toward fulfillment speed and AI integration:
March 2024: Amazon Pharmacy launched same-day prescription delivery in New York City and Los Angeles, leveraging AI and machine learning to assist pharmacists.
August 2025: Zepto launched Zepto Pharmacy in select Indian cities, offering ultra-fast medicine delivery.
January 2026: Pharmacy2U reported a 64.5% rise in NHS prescriptions dispensed for the financial year to April 2025.
2023: CDSCO issued show-cause notices to pharmaceutical firms selling drugs online in India, underscoring regulatory scrutiny of intermediary platforms.
Strategic imperatives include verified dispensing, transparent pricing, and delivery reliability. Platforms that integrate telehealth, AI-powered prescription management, and personalized engagement are best positioned to capture recurring chronic-care relationships.
Trade Dynamics and Cross-Border Fulfillment Considerations
While ePharmacies are primarily a service-based digital channel, cross-border medicine sales introduce trade-like flows governed by national regulations. Only 15 of 27 EU countries permit cross-border online medicine sales to consumers, creating a fragmented landscape for pan-European operators.
Germany's DocMorris and Sweden's Apotea leverage domestic regulatory clarity to scale, while operators in restrictive markets develop country-specific compliance architectures.
Saudi Arabia saw online pharmacy utilization surge from approximately 3% in 2017 to nearly 60% in 2023, prompting regulatory review and alignment requirements for foreign entrants.
India's National Digital Health Ecosystem initiative aims to standardize digital prescription tokens, potentially reducing friction for cross-border telehealth and fulfillment partnerships.
These dynamics favor hybrid models that combine local licensed dispensing with centralized digital infrastructure, balancing regulatory compliance with operational efficiency.
Epharmacies Market Regional Market Share
Higher Coverage
Lower Coverage
No Coverage
Epharmacies Market REPORT HIGHLIGHTS
Research Methodology & Data Sources
Our rigorous research methodology combines multi-layered approaches with comprehensive quality assurance, ensuring precision, accuracy, and reliability in every market analysis.
Primary Research
We conduct 70–80% of our research through primary interviews and surveys with senior executives across the ePharmacy value chain.
Target respondents include Chief Pharmacy Officers, Digital Health Product Managers, Regulatory Affairs Directors, and Supply Chain Heads at licensed online pharmacies, telehealth platforms, and pharmacy benefit managers.
We interview 4–5 specific company types: licensed online pharmacy operators, pharmacy benefit management (PBM) firms, telehealth platform providers, last-mile cold-chain logistics providers, and e-prescription software vendors.
Primary research captures granular data on prescription volumes, average order values, refill rates, delivery latency, and platform-specific adoption metrics.
Key Stakeholders Interviewed
Key Stakeholders Interviewed
Stakeholder Role
Interview Share (%)
Chief Pharmacy Officer
30%
Digital Health Product Manager
25%
Regulatory Affairs Director
25%
Supply Chain Head
20%
Industry Ecosystem Breakdown
Industry Ecosystem Breakdown
Company Type
Representation (%)
Licensed Online Pharmacy Operators
40%
Pharmacy Benefit Management Firms
20%
Telehealth Platform Providers
15%
Last-Mile Cold-Chain Logistics Providers
15%
E-Prescription Software Vendors
10%
Secondary Research & Industry Benchmarking
20–30% of research draws from secondary sources including official government databases, regulatory filings, and recognized non-profit trade associations.
Financial databases including Bloomberg, Factiva, Hoovers, and PitchBook are used for company-level revenue verification and market share validation.
All sources are rigorously vetted; no commercial market research firm data is used in the final synthesis.
Demand Modeling & Market Estimation
We employ a simultaneous top-down and bottom-up methodology, validated through multi-level data triangulation.
Bottom-up market sizing aggregates platform-level prescription volumes, OTC transaction values, and average order values across 3,000+ licensed ePharmacy platforms globally.
Key quantitative metrics include: e-prescription fulfillment rate, average refill interval (days), OTC basket size (USD), and delivery cost per order (USD).
Regional demand models incorporate internet penetration rates, chronic disease prevalence, and regulatory permissiveness scores.
Data Accuracy & Quality Check
We guarantee an estimated data accuracy level of 85–90%, validated through multi-level triangulation and expert review.
Every report is updated to the date of purchase, ensuring the latest market developments and regulatory changes are reflected.
Quality checks include cross-validation of company-reported financials against Bloomberg and Factiva, and reconciliation of regional totals with trade association benchmarks.
Final data sets undergo a three-tier review: analyst-level validation, senior director sign-off, and independent fact-checking.
Aspects
Details
Study Period
2020-2034
Base Year
2025
Estimated Year
2026
Forecast Period
2026-2034
Historical Period
2020-2025
Growth Rate
CAGR of 12.8% from 2020-2034
Segmentation
By Drug Type
Prescription Drugs
Over-The-Counter Drugs
By Product Type
Vitamins
Skin Care
Cold and Flu
Dental Care
Weight Loss
Others
By End-user
Primary Care Centers
Home Care Settings
Individuals
Commercial
By Platform
App-based
Online Platforms
By Payment Method
Online Payment
Cash on Delivery
By Geography
North America
USA
Canada
Mexico
Europe
Germany
UK
France
Spain
Italy
Russia
Sweden
Denmark
Switzerland
Netherlands
Turkey
Czech Republic
Asia Pacific
China
Japan
India
South Korea
Australia
Indonesia
Latin America
Brazil
Argentina
Chile
Middle East & Africa
Table of Contents
1. Epharmacies Market Introduction
1.1. Research Scope
1.2. Market Segmentation
1.3. Research Objective
1.4. Definitions and Assumptions
2. Epharmacies Market Executive Summary
2.1. Market Snapshot
3. Epharmacies Market Market Dynamics
3.1. Introduction
3.2. Market Drivers
3.2.1. Rising internet penetration and smartphone usage
3.2.2. Increasing prevalence of chronic diseases and aging population
3.2.3. Convenience of home delivery and cost savings versus physical pharmacies
3.2.4. Expansion of national e-prescription infrastructure
3.3. Market Restrains
3.3.1. Counterfeit drug risk and consumer trust deficit
3.3.2. Strict and fragmented digital pharmacy regulations across markets
3.3.3. Data privacy and patient health information concerns
Table 16: Europe Epharmacies Market Revenue Billion Forecast, by Drug Type 2020 & 2034
Europe Epharmacies Market Revenue Billion Forecast, by Product Type 2020 & 2034
Frequently Asked Questions
1. What is the current size of the global Epharmacies Market?
The global Epharmacies Market was valued at USD 107.4 billion in 2025 and is projected to reach USD 357.2 billion by 2035, growing at a 12.8% CAGR according to our proprietary research.
2. Which region dominates the Epharmacies Market?
North America held the largest revenue share at approximately 38–42% in 2025, supported by advanced digital health infrastructure. Asia Pacific is the fastest-growing region, driven by expanding internet access and e-prescription adoption.
3. What are the key drivers of the Epharmacies Market?
Key drivers include rising internet penetration, convenience and smartphone usage, the increasing prevalence of chronic diseases, and an aging global population. Over 44% of EU adults live with at least one chronic condition, fueling demand for maintenance medications via home delivery.
4. What are the main restraints facing the Epharmacies Market?
Counterfeit drug risk and consumer trust deficits (impacting CAGR by -0.8%), fragmented digital pharmacy regulations (-0.6%), and data privacy concerns (-0.4%) are the primary restraints. Regulatory variation across markets forces country-specific compliance architectures.
5. Who are the leading companies in the Epharmacies Market?
Leading players include CVS Health, Walgreens Boots Alliance, Amazon Pharmacy, JD Health, and Alibaba Health. The top five collectively held 25% market share in 2025, with the market leader commanding over 9%.
Saudi Arabia
UAE
South Africa
Israel
Turkey
11.1.9.2. Products
11.1.9.3. Company Financials
11.1.9.4. SWOT Analysis
11.1.10. Express Scripts Holding Company
11.1.10.1. Company Overview
11.1.10.2. Products
11.1.10.3. Company Financials
11.1.10.4. SWOT Analysis
11.1.11. The Kroger Co.
11.1.11.1. Company Overview
11.1.11.2. Products
11.1.11.3. Company Financials
11.1.11.4. SWOT Analysis
11.1.12. Rowlands Pharmacy
11.1.12.1. Company Overview
11.1.12.2. Products
11.1.12.3. Company Financials
11.1.12.4. SWOT Analysis
11.1.13. OptumRx Inc.
11.1.13.1. Company Overview
11.1.13.2. Products
11.1.13.3. Company Financials
11.1.13.4. SWOT Analysis
11.1.14. Giant Eagle Inc.
11.1.14.1. Company Overview
11.1.14.2. Products
11.1.14.3. Company Financials
11.1.14.4. SWOT Analysis
11.2. Market Entropy
11.2.1. Company's Key Areas Served
11.2.2. Recent Developments
11.3. Company Market Share Analysis, 2026
11.3.1. Top 5 Companies Market Share Analysis
11.3.2. Top 3 Companies Market Share Analysis
11.4. List of Potential Customers
Figure 17:
Figure 18: Europe Epharmacies Market Revenue (Billion), by End-user 2026 & 2034
Figure 19: Europe Epharmacies Market Revenue Share (%), by End-user 2026 & 2034
Figure 20: Europe Epharmacies Market Revenue (Billion), by Platform 2026 & 2034
Figure 21: Europe Epharmacies Market Revenue Share (%), by Platform 2026 & 2034
Figure 22: Europe Epharmacies Market Revenue (Billion), by Payment Method 2026 & 2034
Figure 23: Europe Epharmacies Market Revenue Share (%), by Payment Method 2026 & 2034
Figure 24: Europe Epharmacies Market Revenue (Billion), by Country 2026 & 2034
Figure 25: Europe Epharmacies Market Revenue Share (%), by Country 2026 & 2034
Figure 26: Asia Pacific Epharmacies Market Revenue (Billion), by Drug Type 2026 & 2034
Figure 27: Asia Pacific Epharmacies Market Revenue Share (%), by Drug Type 2026 & 2034
Figure 28: Asia Pacific Epharmacies Market Revenue (Billion), by Product Type 2026 & 2034
Figure 29: Asia Pacific Epharmacies Market Revenue Share (%), by Product Type 2026 & 2034
Figure 30: Asia Pacific Epharmacies Market Revenue (Billion), by End-user 2026 & 2034
Figure 31: Asia Pacific Epharmacies Market Revenue Share (%), by End-user 2026 & 2034
Figure 32: Asia Pacific Epharmacies Market Revenue (Billion), by Platform 2026 & 2034
Figure 33: Asia Pacific Epharmacies Market Revenue Share (%), by Platform 2026 & 2034
Figure 34: Asia Pacific Epharmacies Market Revenue (Billion), by Payment Method 2026 & 2034
Figure 35: Asia Pacific Epharmacies Market Revenue Share (%), by Payment Method 2026 & 2034
Figure 36: Asia Pacific Epharmacies Market Revenue (Billion), by Country 2026 & 2034
Figure 37: Asia Pacific Epharmacies Market Revenue Share (%), by Country 2026 & 2034
Figure 38: Latin America Epharmacies Market Revenue (Billion), by Drug Type 2026 & 2034
Figure 39: Latin America Epharmacies Market Revenue Share (%), by Drug Type 2026 & 2034
Figure 40: Latin America Epharmacies Market Revenue (Billion), by Product Type 2026 & 2034
Figure 41: Latin America Epharmacies Market Revenue Share (%), by Product Type 2026 & 2034
Figure 42: Latin America Epharmacies Market Revenue (Billion), by End-user 2026 & 2034
Figure 43: Latin America Epharmacies Market Revenue Share (%), by End-user 2026 & 2034
Figure 44: Latin America Epharmacies Market Revenue (Billion), by Platform 2026 & 2034
Figure 45: Latin America Epharmacies Market Revenue Share (%), by Platform 2026 & 2034
Figure 46: Latin America Epharmacies Market Revenue (Billion), by Payment Method 2026 & 2034
Figure 47: Latin America Epharmacies Market Revenue Share (%), by Payment Method 2026 & 2034
Figure 48: Latin America Epharmacies Market Revenue (Billion), by Country 2026 & 2034
Figure 49: Latin America Epharmacies Market Revenue Share (%), by Country 2026 & 2034
Figure 50: Middle East & Africa Epharmacies Market Revenue (Billion), by Drug Type 2026 & 2034
Figure 51: Middle East & Africa Epharmacies Market Revenue Share (%), by Drug Type 2026 & 2034
Figure 52: Middle East & Africa Epharmacies Market Revenue (Billion), by Product Type 2026 & 2034
Figure 53: Middle East & Africa Epharmacies Market Revenue Share (%), by Product Type 2026 & 2034
Figure 54: Middle East & Africa Epharmacies Market Revenue (Billion), by End-user 2026 & 2034
Figure 55: Middle East & Africa Epharmacies Market Revenue Share (%), by End-user 2026 & 2034
Figure 56: Middle East & Africa Epharmacies Market Revenue (Billion), by Platform 2026 & 2034
Figure 57: Middle East & Africa Epharmacies Market Revenue Share (%), by Platform 2026 & 2034
Figure 58: Middle East & Africa Epharmacies Market Revenue (Billion), by Payment Method 2026 & 2034
Figure 59: Middle East & Africa Epharmacies Market Revenue Share (%), by Payment Method 2026 & 2034
Figure 60: Middle East & Africa Epharmacies Market Revenue (Billion), by Country 2026 & 2034
Figure 61: Middle East & Africa Epharmacies Market Revenue Share (%), by Country 2026 & 2034
Table 17:
Table 18: Europe Epharmacies Market Revenue Billion Forecast, by End-user 2020 & 2034
Table 19: Europe Epharmacies Market Revenue Billion Forecast, by Platform 2020 & 2034
Table 20: Europe Epharmacies Market Revenue Billion Forecast, by Payment Method 2020 & 2034
Table 21: Europe Epharmacies Market Revenue Billion Forecast, by Country 2020 & 2034