Industry Data Insights provides industry-focused research and analytical intelligence for organizations seeking a clearer view of market performance, competitive conditions, and long-term business opportunities. Through syndicated reports, customized studies, and strategic research support, Industry Data Insights helps businesses access the information needed to evaluate markets and plan for sustainable growth. Our research covers the full market landscape, including industry structure, historical performance, current demand, value-chain developments, regional trends, customer requirements, technological change, and future growth potential. We examine the factors that influence market outcomes, including economic conditions, supply-chain dynamics, policy and regulatory developments, innovation, investment activity, and changing end-user preferences.
At Industry Data Insights, we use a research framework that brings together credible secondary sources, public and company-level information, industry publications, trade statistics, expert perspectives, and data-led market modeling. Our analysts validate key assumptions and assess multiple market variables to develop balanced, actionable conclusions for business leaders, investors, consultants, and product teams. Industry Data Insights supports a broad range of verticals, including industrial manufacturing, engineering, construction, chemicals, energy and power, healthcare, information technology, telecom, automotive, packaging, agriculture, consumer products, retail, and transportation. Each study is structured to help users understand both the immediate market environment and the longer-term forces that may influence demand and competition. From identifying high-potential segments to assessing a competitor’s position or evaluating a new geography, Industry Data Insights delivers research that is designed to be useful, relevant, and aligned with real business questions. Our goal is to turn industry data into strategic direction.
Amla Extract Market Size, Share & Forecast to 2034
Amla Extract Market Size, Share & Forecast to 2034
Amla Extract Market by Type (Powder, Pulp, Liquid, Capsules/Tablets, Oil), by Application (Food and Beverages, Pharmaceuticals, Nutraceuticals, Personal Care and Cosmetics), by Source (Organic, Conventional), by Distribution Channel (Online Retail, Offline Retail, Direct Sales), by North America (USA, Canada, Mexico), by Europe (Germany, UK, France, Italy, Spain), by Asia Pacific (India, China, Japan, South Korea), by South America (Brazil, Argentina), by Middle East & Africa (South Africa, UAE) Forecast 2026-2034
Amla Extract Market Size, Share & Forecast to 2034
Discover the Latest Market Insight Reports
Access in-depth insights on industries, companies, trends, and global markets. Our expertly curated reports provide the most relevant data and analysis in a condensed, easy-to-read format.
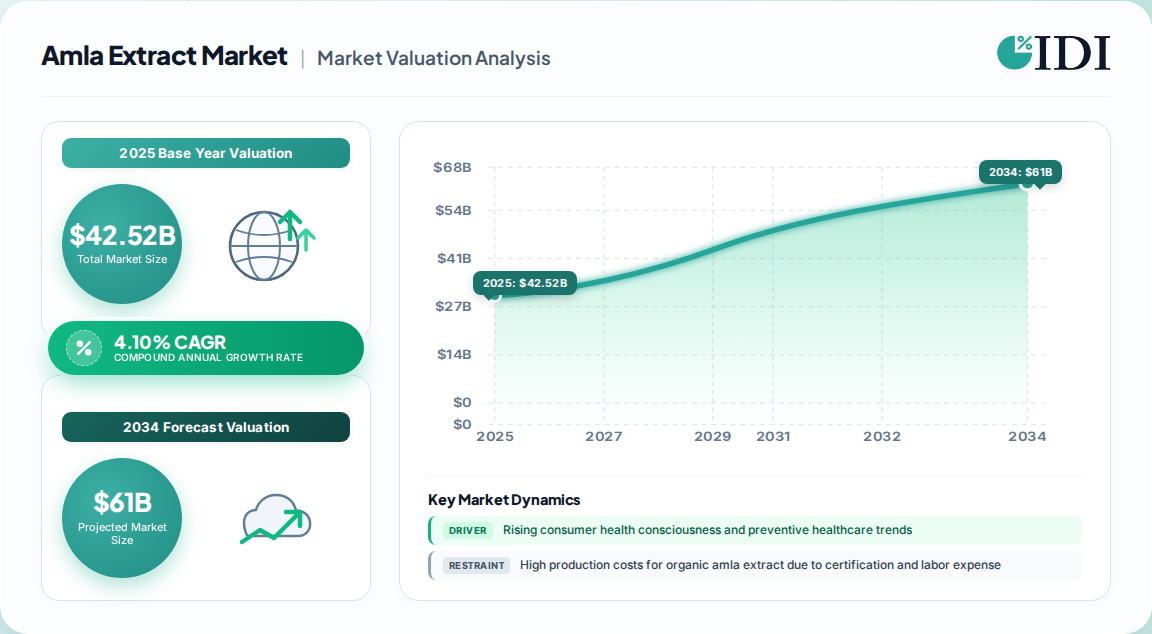
The global amla extract market represents a mature yet expanding botanical ingredients sector, with our proprietary primary research estimating a valuation of USD 42.52 billion in 2025. This base expands to USD 44.26 billion in 2026 and is projected to reach USD 61.04 billion by 2034, registering a CAGR of 4.10% across the 2026–2034 forecast window.
Amla Extract Market Market Size (In Billion)
75.0B
60.0B
45.0B
30.0B
15.0B
0
42.52 B
2025
44.26 B
2026
46.08 B
2027
47.97 B
2028
49.93 B
2029
51.98 B
2030
54.11 B
2031
Amla Extract Market Market Size (In Billion)
Year
Market Size
2025
42.52 B
2026
44.26 B
2027
46.08 B
2028
47.97 B
2029
49.93 B
2030
51.98 B
2031
54.11 B
Growth is anchored in three structural demand pillars: the mainstreaming of Ayurvedic preventive healthcare, the clean-label reformulation of personal care, and the exponential rise of the global nutraceutical supplement industry. Powdered formats remain the commercial backbone, commanding an estimated 58–62% of total volume, owing to superior shelf stability and lower logistics costs relative to liquid concentrates.
Metric
Value
Base Year (2025) Valuation
USD 42.52 Billion
2026 Estimated Valuation
USD 44.26 Billion
2034 Forecast Valuation
USD 61.04 Billion
CAGR (2026–2034)
4.10%
Dominant Format
Powder (58–62% share)
Fastest-Growing Application
Nutraceuticals
Leading Production Hub
Asia-Pacific (India)
Standardized Powder Grading and Extraction Technologies
Product differentiation in this market is increasingly defined by extraction technology and phytochemical standardization, rather than raw fruit volume. Buyers now specify marker compounds such as beta-glucogallin, tannins, and vitamin C content, forcing suppliers to invest in controlled extraction and spray-drying capabilities.
Solvent extraction remains the most widely deployed industrial method, offering high yield and cost efficiency for standardized powders.
Cold pressing is preferred for oil-based amla extracts used in hair and skin care, preserving heat-sensitive bioactive compounds.
Supercritical fluid extraction is gaining traction for premium nutraceutical grades where residual solvent thresholds are strictly regulated.
Spray drying is critical for producing water-soluble powder grades suitable for ready-to-mix beverages and effervescent tablets.
Powder extracts dominate because they allow precise dosage in capsules and tablets, maintain potency across long export logistics chains, and blend easily into dry mix formulations without altering moisture profiles. Liquid and pulp formats retain relevance in traditional preparations, functional beverages, and jams, but face higher transport costs and shorter shelf life.
Nutraceutical and Functional Food Application Demand
Application segmentation reveals a market in which food and beverages and dietary supplements collectively absorb the majority of amla extract volumes, but nutraceuticals represent the fastest-growing application vertical.
Application Segment
Market Position
Key Growth Mechanism
Food & Beverages
Dominant (approx. 34% share)
Fortified drinks, smoothies, energy bars, functional foods
Traditional medicine, digestive and respiratory formulations
The post-pandemic emphasis on immune system health has been a durable demand catalyst. Amla's high natural vitamin C content and polyphenol profile position it as a credible botanical alternative to synthetic ascorbic acid in supplement formulations. Manufacturers have responded with tablets, capsules, gummies, and effervescent formats targeting immunity, digestion, and metabolic wellness.
In personal care, the "beauty-from-within" and nutricosmetics movement has accelerated adoption. Amla's tannins and vitamin C support collagen synthesis and protect against oxidative stress, making it a preferred ingredient in anti-aging serums, hair oils, and strengthening shampoos. Clean-label reformulation is prompting formulators to replace synthetic preservatives with plant-based antioxidants, directly benefiting amla extract demand.
Upstream Supply Chain and Export Trade Dynamics
The amla extract value chain is heavily concentrated upstream. India accounts for the overwhelming majority of global raw amla cultivation and primary processing, creating a structural dependency for buyers in North America and Europe.
Cultivation concentration: Indian states including Uttar Pradesh, Madhya Pradesh, and Gujarat are the primary amla-producing regions, with harvest seasonality driving spot price volatility.
Contract farming: Vertically integrated extractors are increasingly securing raw material through long-term contract farming arrangements to mitigate climate-related supply shocks.
Export documentation: Buyers in regulated markets demand heavy metal testing, pesticide residue screening, GMP certification, and farm-level traceability, raising barriers to entry for small aggregators.
Processing clusters: New extraction facilities in India are being commissioned with GMP-compliant infrastructure to serve export-oriented nutraceutical and cosmetic customers.
Trade flows are characterized by raw material and standardized powder exports from Asia-Pacific to North America and Europe, where finished-product formulation and branding capture higher margins. Supply chain inefficiencies, limited mechanization in harvesting, and the seasonality of amla cultivation contribute to periodic price instability, particularly for organic-certified grades.
Regional Consumption and Production Footprints
Asia-Pacific is the largest regional market, holding an estimated 41–45% share in 2025, led by India, China, Japan, and South Korea. This dominance reflects both production capacity and deep cultural familiarity with Ayurvedic and traditional medicine systems.
Amla Extract Market Regional Market Share
Loading chart...
Amla Extract Market Regional Market Share
Region
Market Share (%)
North America
0.23%
Europe
0.19%
Asia-Pacific
0.43%
South America
0.05%
Middle East & Africa
0.1%
Region
Estimated Share (2025)
Growth Outlook
Asia-Pacific
41–45%
3.9–4.5% CAGR
North America
21–24%
3.8–4.3% CAGR
Europe
18–21%
3.5–4.0% CAGR
Middle East & Africa
10%
Stable
South America
5%
Emerging
North America's demand is concentrated in dietary supplements, herbal capsules, powdered drink mixes, and natural hair care. The United States represents 72–76% of North American demand, driven by nutraceutical launches and premium botanical beauty products. European growth is led by Germany, the UK, France, Italy, and Spain, where herbal supplement consumption and natural cosmetics demand are expanding, supported by an increasingly favorable regulatory environment for botanical ingredients.
Competitive Landscape and Standardization Barriers
The market structure is fragmented and competitive, featuring specialized botanical extractors, Ayurvedic enterprises, and global nutraceutical brands. Competition centers on product purity, extraction technology, standardized marker compounds, and functional versatility rather than pure price.
Key strategic differentiators include:
Bio-active consistency: Suppliers who can guarantee reproducible marker compound levels against volatile crop cycles secure premium long-term contracts.
GMP certification and clinical validation: Regulatory acceptance in Western markets increasingly requires documented safety and efficacy data.
Application-specific grades: Water-soluble powders for beverages, oil-soluble concentrates for cosmetics, and high-potency extracts for supplements command price premiums.
Vertical integration: Players controlling both cultivation and extraction phases are best positioned to manage cost and quality risks.
Notable industry participants include Sami-Sabinsa Group, Arjuna Natural, Patanjali Ayurveda, Ambe Phytoextracts, Biomax Life Sciences, Taiyo International, Sydler Group, and Marico Limited, among others. Recent capacity expansions, such as new GMP-compliant extraction facilities in India, signal a shift toward export-ready quality systems as a baseline competitive requirement.
Regulatory Headwinds and Commercial Restraints
The market faces several structural restraints that temper growth trajectories. High production costs for organic amla extract—driven by pesticide-free cultivation requirements, third-party certification, and labor-intensive post-harvest handling—limit accessibility in price-sensitive emerging markets.
Efficacy claims scrutiny: Regulatory skepticism toward unsubstantiated therapeutic claims for serious diseases constrains marketing and positioning in regulated jurisdictions.
Raw material volatility: Seasonal harvest cycles and climate variability create supply and pricing inconsistencies for large-scale manufacturers.
Competition from synthetic alternatives: Low-cost synthetic ascorbic acid competes with amla extract in price-sensitive vitamin C applications.
Despite these restraints, product innovation—including amla-infused protein powders, effervescent tablets, probiotic blends, and adaptogenic coffees—presents substantial differentiation and premiumization opportunities. Government initiatives promoting herbal and Ayurvedic medicine, particularly in India and China, alongside ASEAN regulatory harmonization efforts, are expected to ease trade flows and support broader adoption in Western markets.
Amla Extract Market Regional Market Share
Higher Coverage
Lower Coverage
No Coverage
Amla Extract Market REPORT HIGHLIGHTS
Research Methodology & Data Sources
Our rigorous research methodology combines multi-layered approaches with comprehensive quality assurance, ensuring precision, accuracy, and reliability in every market analysis.
Primary Research
Primary research constitutes 70–80% of the total research effort, involving direct interviews with procurement directors, R&D formulators, and plant managers across the amla extract value chain.
We conduct in-depth interviews with stakeholders including Procurement Directors at nutraceutical brands, R&D Heads at cosmetic formulation companies, Quality Assurance Managers at botanical extraction facilities, and Supply Chain Managers at Ayurvedic product manufacturers.
Interview programs target 4–5 specific company types: amla cultivation and raw material aggregators, botanical extraction and processing units, nutraceutical supplement manufacturers, personal care and cosmetic formulators, and food and beverage functional product companies.
Data collected includes extraction capacity, standardized marker compound specifications, procurement contract structures, and regulatory compliance documentation.
Key Stakeholders Interviewed
Key Stakeholders Interviewed
Stakeholder Role
Interview Share (%)
Procurement Director
35%
R&D Head
25%
Quality Assurance Manager
22%
Supply Chain Manager
18%
Industry Ecosystem Breakdown
Industry Ecosystem Breakdown
Company Type
Representation (%)
Botanical Extraction and Processing Units
30%
Nutraceutical Supplement Manufacturers
25%
Personal Care and Cosmetic Formulators
20%
Food and Beverage Functional Product Companies
15%
Raw Material Aggregators and Cultivators
10%
Secondary Research & Industry Benchmarking
Secondary research comprises 20–30% of the methodology, drawing on official government trade statistics, corporate financial disclosures, patent filings, and agricultural crop reports.
Financial databases utilized include Bloomberg, Factiva, Hoovers, and PitchBook for corporate financial benchmarking and competitive intelligence.
Official sources include UN Comtrade for bilateral trade flow analysis, World Bank for agricultural and economic indicators, FAO for crop production statistics, and OECD for regulatory and trade policy benchmarks.
Industry association data is sourced from recognized non-profit technical bodies including the Indian Pharmacopoeia Commission for botanical standardization standards and USDA for organic certification benchmarks.
Demand Modeling & Market Estimation
A dual top-down and bottom-up methodology is applied simultaneously, with multi-level data triangulation validating all estimates.
Bottom-up modeling aggregates demand across end-use sectors using quantitative metrics including: annual extraction capacity in metric tons, average standardized powder pricing per kilogram, nutraceutical supplement launch volumes by region, and personal care formulation incorporation rates.
Top-down modeling benchmarks total botanical extract industry spending against amla's share of the antioxidant botanical segment, validated through supply-side production capacity announcements and government horticulture statistics.
All market sizing is cross-referenced against primary interview data and corporate capacity disclosures, with discrepancies resolved through expert consultation.
Data Accuracy & Quality Check
Every report is updated to the date of purchase, ensuring all market estimates reflect the most recent available primary and secondary data.
Estimated data accuracy level is guaranteed at 85–90%, with confidence intervals calculated for all segment-level projections.
Multi-level data triangulation is performed across primary interviews, trade statistics, corporate disclosures, and regulatory filings to identify and reconcile outliers.
Quality assurance protocols include cross-validation of supplier-reported capacities against independent import/export documentation and third-party certification records.
Aspects
Details
Study Period
2020-2034
Base Year
2025
Estimated Year
2026
Forecast Period
2026-2034
Historical Period
2020-2025
Growth Rate
CAGR of 4.10% from 2020-2034
Segmentation
By Type
Powder
Pulp
Liquid
Capsules/Tablets
Oil
By Application
Food and Beverages
Pharmaceuticals
Nutraceuticals
Personal Care and Cosmetics
By Source
Organic
Conventional
By Distribution Channel
Online Retail
Offline Retail
Direct Sales
By Geography
North America
USA
Canada
Mexico
Europe
Germany
UK
France
Italy
Spain
Asia Pacific
India
China
Japan
South Korea
South America
Brazil
Argentina
Middle East & Africa
South Africa
UAE
Table of Contents
1. Amla Extract Market Introduction
1.1. Research Scope
1.2. Market Segmentation
1.3. Research Objective
1.4. Definitions and Assumptions
2. Amla Extract Market Executive Summary
2.1. Market Snapshot
3. Amla Extract Market Market Dynamics
3.1. Introduction
3.2. Market Drivers
3.2.1. Rising consumer health consciousness and preventive healthcare trends
3.2.2. Expansion of the global nutraceutical and dietary supplement industry
3.2.3. Growing demand for natural antioxidant-rich ingredients
3.2.4. Government initiatives promoting herbal and Ayurvedic medicine
3.3. Market Restrains
3.3.1. High production costs for organic amla extract due to certification and labor expenses
3.3.2. Regulatory scrutiny of therapeutic efficacy claims in Western jurisdictions
3.3.3. Seasonal raw material supply volatility and climate variability
3.3.4. Competition from low-cost synthetic ascorbic acid alternatives
3.4. Market Trends
3.4.1. Rising popularity of Ayurvedic and traditional medicine in Western markets
3.4.2. Shift from generic herbal powders to clinically studied branded extracts
3.4.3. Expansion of beauty-from-within and nutricosmetics sectors
3.4.4. Clean-label reformulation replacing synthetic preservatives with plant-based antioxidants
4. Amla Extract Market Market Factor Analysis
4.1. Porters Five Forces
4.1.1. Bargaining Power of Suppliers
4.1.2. Bargaining Power of Buyers
4.1.3. Threat of New Entrants
4.1.4. Threat of Substitutes
4.1.5. Competitive Rivalry
4.2. PESTEL analysis
4.3. BCG Analysis
4.3.1. Stars (High Growth, High Market Share)
4.3.2. Cash Cows (Low Growth, High Market Share)
4.3.3. Question Mark (High Growth, Low Market Share)
4.3.4. Dogs (Low Growth, Low Market Share)
4.4. Ansoff Matrix Analysis
4.5. Supply Chain Analysis
4.6. Regulatory Landscape
4.7. Current Market Potential and Opportunity Assessment (TAM–SAM–SOM Framework)
4.8. IDI Analyst Note
5. Amla Extract Market Market Analysis, Insights and Forecast, 2020-2034
5.1. Market Analysis, Insights and Forecast - by Type
5.1.1. Powder
5.1.2. Pulp
5.1.3. Liquid
5.1.4. Capsules/Tablets
5.1.5. Oil
5.2. Market Analysis, Insights and Forecast - by Application
5.2.1. Food and Beverages
5.2.2. Pharmaceuticals
5.2.3. Nutraceuticals
5.2.4. Personal Care and Cosmetics
5.3. Market Analysis, Insights and Forecast - by Source
5.3.1. Organic
5.3.2. Conventional
5.4. Market Analysis, Insights and Forecast - by Distribution Channel
5.4.1. Online Retail
5.4.2. Offline Retail
5.4.3. Direct Sales
5.5. Market Analysis, Insights and Forecast - by Region
5.5.1. North America
5.5.2. Europe
5.5.3. Asia Pacific
5.5.4. South America
5.5.5. Middle East & Africa
6. Amla Extract Market North America Market Analysis, Insights and Forecast, 2020-2034
6.1. Market Analysis, Insights and Forecast - by Type
6.1.1. Powder
6.1.2. Pulp
6.1.3. Liquid
6.1.4. Capsules/Tablets
6.1.5. Oil
6.2. Market Analysis, Insights and Forecast - by Application
6.2.1. Food and Beverages
6.2.2. Pharmaceuticals
6.2.3. Nutraceuticals
6.2.4. Personal Care and Cosmetics
6.3. Market Analysis, Insights and Forecast - by Source
6.3.1. Organic
6.3.2. Conventional
6.4. Market Analysis, Insights and Forecast - by Distribution Channel
6.4.1. Online Retail
6.4.2. Offline Retail
6.4.3. Direct Sales
7. Amla Extract Market Europe Market Analysis, Insights and Forecast, 2020-2034
7.1. Market Analysis, Insights and Forecast - by Type
7.1.1. Powder
7.1.2. Pulp
7.1.3. Liquid
7.1.4. Capsules/Tablets
7.1.5. Oil
7.2. Market Analysis, Insights and Forecast - by Application
7.2.1. Food and Beverages
7.2.2. Pharmaceuticals
7.2.3. Nutraceuticals
7.2.4. Personal Care and Cosmetics
7.3. Market Analysis, Insights and Forecast - by Source
7.3.1. Organic
7.3.2. Conventional
7.4. Market Analysis, Insights and Forecast - by Distribution Channel
7.4.1. Online Retail
7.4.2. Offline Retail
7.4.3. Direct Sales
8. Amla Extract Market Asia Pacific Market Analysis, Insights and Forecast, 2020-2034
8.1. Market Analysis, Insights and Forecast - by Type
8.1.1. Powder
8.1.2. Pulp
8.1.3. Liquid
8.1.4. Capsules/Tablets
8.1.5. Oil
8.2. Market Analysis, Insights and Forecast - by Application
8.2.1. Food and Beverages
8.2.2. Pharmaceuticals
8.2.3. Nutraceuticals
8.2.4. Personal Care and Cosmetics
8.3. Market Analysis, Insights and Forecast - by Source
8.3.1. Organic
8.3.2. Conventional
8.4. Market Analysis, Insights and Forecast - by Distribution Channel
8.4.1. Online Retail
8.4.2. Offline Retail
8.4.3. Direct Sales
9. Amla Extract Market South America Market Analysis, Insights and Forecast, 2020-2034
9.1. Market Analysis, Insights and Forecast - by Type
9.1.1. Powder
9.1.2. Pulp
9.1.3. Liquid
9.1.4. Capsules/Tablets
9.1.5. Oil
9.2. Market Analysis, Insights and Forecast - by Application
9.2.1. Food and Beverages
9.2.2. Pharmaceuticals
9.2.3. Nutraceuticals
9.2.4. Personal Care and Cosmetics
9.3. Market Analysis, Insights and Forecast - by Source
9.3.1. Organic
9.3.2. Conventional
9.4. Market Analysis, Insights and Forecast - by Distribution Channel
9.4.1. Online Retail
9.4.2. Offline Retail
9.4.3. Direct Sales
10. Amla Extract Market Middle East & Africa Market Analysis, Insights and Forecast, 2020-2034
10.1. Market Analysis, Insights and Forecast - by Type
10.1.1. Powder
10.1.2. Pulp
10.1.3. Liquid
10.1.4. Capsules/Tablets
10.1.5. Oil
10.2. Market Analysis, Insights and Forecast - by Application
10.2.1. Food and Beverages
10.2.2. Pharmaceuticals
10.2.3. Nutraceuticals
10.2.4. Personal Care and Cosmetics
10.3. Market Analysis, Insights and Forecast - by Source
10.3.1. Organic
10.3.2. Conventional
10.4. Market Analysis, Insights and Forecast - by Distribution Channel
10.4.1. Online Retail
10.4.2. Offline Retail
10.4.3. Direct Sales
11. Amla Extract Market Competitive Analysis
11.1. Company Profiles
11.1.1. Sami-Sabinsa Group
11.1.1.1. Company Overview
11.1.1.2. Products
11.1.1.3. Company Financials
11.1.1.4. SWOT Analysis
11.1.2. Arjuna Natural Extracts Ltd
11.1.2.1. Company Overview
11.1.2.2. Products
11.1.2.3. Company Financials
11.1.2.4. SWOT Analysis
11.1.3. Patanjali Ayurveda
11.1.3.1. Company Overview
11.1.3.2. Products
11.1.3.3. Company Financials
11.1.3.4. SWOT Analysis
11.1.4. Ambe Phytoextracts Pvt. Ltd
11.1.4.1. Company Overview
11.1.4.2. Products
11.1.4.3. Company Financials
11.1.4.4. SWOT Analysis
11.1.5. Biomax Life Sciences Ltd
11.1.5.1. Company Overview
11.1.5.2. Products
11.1.5.3. Company Financials
11.1.5.4. SWOT Analysis
11.1.6. Taiyo International
11.1.6.1. Company Overview
11.1.6.2. Products
11.1.6.3. Company Financials
11.1.6.4. SWOT Analysis
11.1.7. Sydler Group
11.1.7.1. Company Overview
11.1.7.2. Products
11.1.7.3. Company Financials
11.1.7.4. SWOT Analysis
11.1.8. Marico Limited
11.1.8.1. Company Overview
11.1.8.2. Products
11.1.8.3. Company Financials
11.1.8.4. SWOT Analysis
11.1.9. Dabur India Ltd
11.1.9.1. Company Overview
12. Amla Extract Market Research Methodology
List of Figures
Figure 1: Amla Extract Market Revenue Breakdown (Billion, %) by Region 2026 & 2034
Figure 2: North America Amla Extract Market Revenue (Billion), by Type 2026 & 2034
Figure 3: North America Amla Extract Market Revenue Share (%), by Type 2026 & 2034
Figure 4: North America Amla Extract Market Revenue (Billion), by Application 2026 & 2034
Figure 5: North America Amla Extract Market Revenue Share (%), by Application 2026 & 2034
Figure 6: North America Amla Extract Market Revenue (Billion), by Source 2026 & 2034
Figure 7: North America Amla Extract Market Revenue Share (%), by Source 2026 & 2034
Figure 8: North America Amla Extract Market Revenue (Billion), by Distribution Channel 2026 & 2034
Figure 9: North America Amla Extract Market Revenue Share (%), by Distribution Channel 2026 & 2034
Figure 10: North America Amla Extract Market Revenue (Billion), by Country 2026 & 2034
Figure 11: North America Amla Extract Market Revenue Share (%), by Country 2026 & 2034
Figure 12: Europe Amla Extract Market Revenue (Billion), by Type 2026 & 2034
Figure 13: Europe Amla Extract Market Revenue Share (%), by Type 2026 & 2034
Figure 14: Europe Amla Extract Market Revenue (Billion), by Application 2026 & 2034
Figure 15: Europe Amla Extract Market Revenue Share (%), by Application 2026 & 2034
Figure 16: Europe Amla Extract Market Revenue (Billion), by Source 2026 & 2034
Figure 17: Europe Amla Extract Market Revenue Share (%), by Source 2026 & 2034
List of Tables
Table 1: Amla Extract Market Revenue Billion Forecast, by Type 2020 & 2034
Table 14: Europe Amla Extract Market Revenue Billion Forecast, by Type 2020 & 2034
Table 15: Europe Amla Extract Market Revenue Billion Forecast, by Application 2020 & 2034
Table 16: Europe Amla Extract Market Revenue Billion Forecast, by Source 2020 & 2034
Europe Amla Extract Market Revenue Billion Forecast, by Distribution Channel 2020 & 2034
Frequently Asked Questions
1. What is the current size of the global amla extract market?
The global amla extract market was valued at USD 42.52 billion in 2025 and is projected to reach USD 61.04 billion by 2034, growing at a CAGR of 4.10% during the forecast period.
2. Which region dominates the amla extract market?
Asia-Pacific holds the largest market share at approximately 41–45% in 2025, led by India, China, Japan, and South Korea, driven by both production capacity and cultural adoption of Ayurvedic medicine.
3. What are the key drivers of the amla extract market?
Primary growth drivers include rising consumer health awareness, demand for natural antioxidant-rich products, expansion of the nutraceutical and dietary supplement industry, and the clean-label reformulation trend in personal care and cosmetics.
4. Which application segment is growing fastest in the amla extract market?
The nutraceuticals segment is the fastest-growing application, driven by amla-based dietary supplements for immunity, digestion, and cardiovascular support, particularly following increased health consciousness in the post-pandemic period.
5. Who are the key players operating in the amla extract market?
Key companies include Sami-Sabinsa Group, Arjuna Natural, Patanjali Ayurveda, Ambe Phytoextracts, Biomax Life Sciences, Taiyo International, Sydler Group, Marico Limited, Dabur India, and Himalaya Wellness Company, among others.
11.1.9.2. Products
11.1.9.3. Company Financials
11.1.9.4. SWOT Analysis
11.1.10. Himalaya Wellness Company
11.1.10.1. Company Overview
11.1.10.2. Products
11.1.10.3. Company Financials
11.1.10.4. SWOT Analysis
11.1.11. Ri-Sun Bio Tech
11.1.11.1. Company Overview
11.1.11.2. Products
11.1.11.3. Company Financials
11.1.11.4. SWOT Analysis
11.1.12. Bhumi Amla
11.1.12.1. Company Overview
11.1.12.2. Products
11.1.12.3. Company Financials
11.1.12.4. SWOT Analysis
11.1.13. Archerchem
11.1.13.1. Company Overview
11.1.13.2. Products
11.1.13.3. Company Financials
11.1.13.4. SWOT Analysis
11.1.14. Herbeno Herbals Pvt. Ltd
11.1.14.1. Company Overview
11.1.14.2. Products
11.1.14.3. Company Financials
11.1.14.4. SWOT Analysis
11.1.15. NutraGenesis
11.1.15.1. Company Overview
11.1.15.2. Products
11.1.15.3. Company Financials
11.1.15.4. SWOT Analysis
11.1.16. Xcul amla oil
11.1.16.1. Company Overview
11.1.16.2. Products
11.1.16.3. Company Financials
11.1.16.4. SWOT Analysis
11.1.17. Jaison Pvt
11.1.17.1. Company Overview
11.1.17.2. Products
11.1.17.3. Company Financials
11.1.17.4. SWOT Analysis
11.1.18. BioActives LLC
11.1.18.1. Company Overview
11.1.18.2. Products
11.1.18.3. Company Financials
11.1.18.4. SWOT Analysis
11.1.19. Neelamari Herbs
11.1.19.1. Company Overview
11.1.19.2. Products
11.1.19.3. Company Financials
11.1.19.4. SWOT Analysis
11.1.20. Himalayan Herbaria Inc
11.1.20.1. Company Overview
11.1.20.2. Products
11.1.20.3. Company Financials
11.1.20.4. SWOT Analysis
11.1.21. Naturmed Scientific
11.1.21.1. Company Overview
11.1.21.2. Products
11.1.21.3. Company Financials
11.1.21.4. SWOT Analysis
11.1.22. Thangam Extracts
11.1.22.1. Company Overview
11.1.22.2. Products
11.1.22.3. Company Financials
11.1.22.4. SWOT Analysis
11.2. Market Entropy
11.2.1. Company's Key Areas Served
11.2.2. Recent Developments
11.3. Company Market Share Analysis, 2026
11.3.1. Top 5 Companies Market Share Analysis
11.3.2. Top 3 Companies Market Share Analysis
11.4. List of Potential Customers
Figure 18: Europe Amla Extract Market Revenue (Billion), by Distribution Channel 2026 & 2034
Figure 19: Europe Amla Extract Market Revenue Share (%), by Distribution Channel 2026 & 2034
Figure 20: Europe Amla Extract Market Revenue (Billion), by Country 2026 & 2034
Figure 21: Europe Amla Extract Market Revenue Share (%), by Country 2026 & 2034
Figure 22: Asia Pacific Amla Extract Market Revenue (Billion), by Type 2026 & 2034
Figure 23: Asia Pacific Amla Extract Market Revenue Share (%), by Type 2026 & 2034
Figure 24: Asia Pacific Amla Extract Market Revenue (Billion), by Application 2026 & 2034
Figure 25: Asia Pacific Amla Extract Market Revenue Share (%), by Application 2026 & 2034
Figure 26: Asia Pacific Amla Extract Market Revenue (Billion), by Source 2026 & 2034
Figure 27: Asia Pacific Amla Extract Market Revenue Share (%), by Source 2026 & 2034
Figure 28: Asia Pacific Amla Extract Market Revenue (Billion), by Distribution Channel 2026 & 2034
Figure 29: Asia Pacific Amla Extract Market Revenue Share (%), by Distribution Channel 2026 & 2034
Figure 30: Asia Pacific Amla Extract Market Revenue (Billion), by Country 2026 & 2034
Figure 31: Asia Pacific Amla Extract Market Revenue Share (%), by Country 2026 & 2034
Figure 32: South America Amla Extract Market Revenue (Billion), by Type 2026 & 2034
Figure 33: South America Amla Extract Market Revenue Share (%), by Type 2026 & 2034
Figure 34: South America Amla Extract Market Revenue (Billion), by Application 2026 & 2034
Figure 35: South America Amla Extract Market Revenue Share (%), by Application 2026 & 2034
Figure 36: South America Amla Extract Market Revenue (Billion), by Source 2026 & 2034
Figure 37: South America Amla Extract Market Revenue Share (%), by Source 2026 & 2034
Figure 38: South America Amla Extract Market Revenue (Billion), by Distribution Channel 2026 & 2034
Figure 39: South America Amla Extract Market Revenue Share (%), by Distribution Channel 2026 & 2034
Figure 40: South America Amla Extract Market Revenue (Billion), by Country 2026 & 2034
Figure 41: South America Amla Extract Market Revenue Share (%), by Country 2026 & 2034
Figure 42: Middle East & Africa Amla Extract Market Revenue (Billion), by Type 2026 & 2034
Figure 43: Middle East & Africa Amla Extract Market Revenue Share (%), by Type 2026 & 2034
Figure 44: Middle East & Africa Amla Extract Market Revenue (Billion), by Application 2026 & 2034
Figure 45: Middle East & Africa Amla Extract Market Revenue Share (%), by Application 2026 & 2034
Figure 46: Middle East & Africa Amla Extract Market Revenue (Billion), by Source 2026 & 2034
Figure 47: Middle East & Africa Amla Extract Market Revenue Share (%), by Source 2026 & 2034
Figure 48: Middle East & Africa Amla Extract Market Revenue (Billion), by Distribution Channel 2026 & 2034
Figure 49: Middle East & Africa Amla Extract Market Revenue Share (%), by Distribution Channel 2026 & 2034
Figure 50: Middle East & Africa Amla Extract Market Revenue (Billion), by Country 2026 & 2034
Figure 51: Middle East & Africa Amla Extract Market Revenue Share (%), by Country 2026 & 2034
Table 17:
Table 18: Europe Amla Extract Market Revenue Billion Forecast, by Country 2020 & 2034