Industry Data Insights provides industry-focused research and analytical intelligence for organizations seeking a clearer view of market performance, competitive conditions, and long-term business opportunities. Through syndicated reports, customized studies, and strategic research support, Industry Data Insights helps businesses access the information needed to evaluate markets and plan for sustainable growth. Our research covers the full market landscape, including industry structure, historical performance, current demand, value-chain developments, regional trends, customer requirements, technological change, and future growth potential. We examine the factors that influence market outcomes, including economic conditions, supply-chain dynamics, policy and regulatory developments, innovation, investment activity, and changing end-user preferences.
At Industry Data Insights, we use a research framework that brings together credible secondary sources, public and company-level information, industry publications, trade statistics, expert perspectives, and data-led market modeling. Our analysts validate key assumptions and assess multiple market variables to develop balanced, actionable conclusions for business leaders, investors, consultants, and product teams. Industry Data Insights supports a broad range of verticals, including industrial manufacturing, engineering, construction, chemicals, energy and power, healthcare, information technology, telecom, automotive, packaging, agriculture, consumer products, retail, and transportation. Each study is structured to help users understand both the immediate market environment and the longer-term forces that may influence demand and competition. From identifying high-potential segments to assessing a competitor’s position or evaluating a new geography, Industry Data Insights delivers research that is designed to be useful, relevant, and aligned with real business questions. Our goal is to turn industry data into strategic direction.
Recycled Polyester Market Report: Size, Share & 2030 Outlook
Recycled Polyester Market Report by Product (Cotton Spinning Material, Filling Material, Non-woven, Others), by Application (Apparel, Home Textiles, Automotive Interior, Construction Material, Healthcare & Hygiene, Others), by Origin (Virgin, Recycled, Blended), by Format (Staple Fiber, Continuous Filament), by Feedstock (Bottle-to-Fiber, Ocean Plastic Recovery, Textile-to-Textile), by Asia Pacific (China, India, Indonesia, Japan), by North America (USA, Canada, Mexico), by Europe (Germany, UK, France, Sweden), by South America (Brazil), by Middle East & Africa (Gulf Cooperation Council) Forecast 2026-2034
Recycled Polyester Market Report: Size, Share & 2030 Outlook
Discover the Latest Market Insight Reports
Access in-depth insights on industries, companies, trends, and global markets. Our expertly curated reports provide the most relevant data and analysis in a condensed, easy-to-read format.
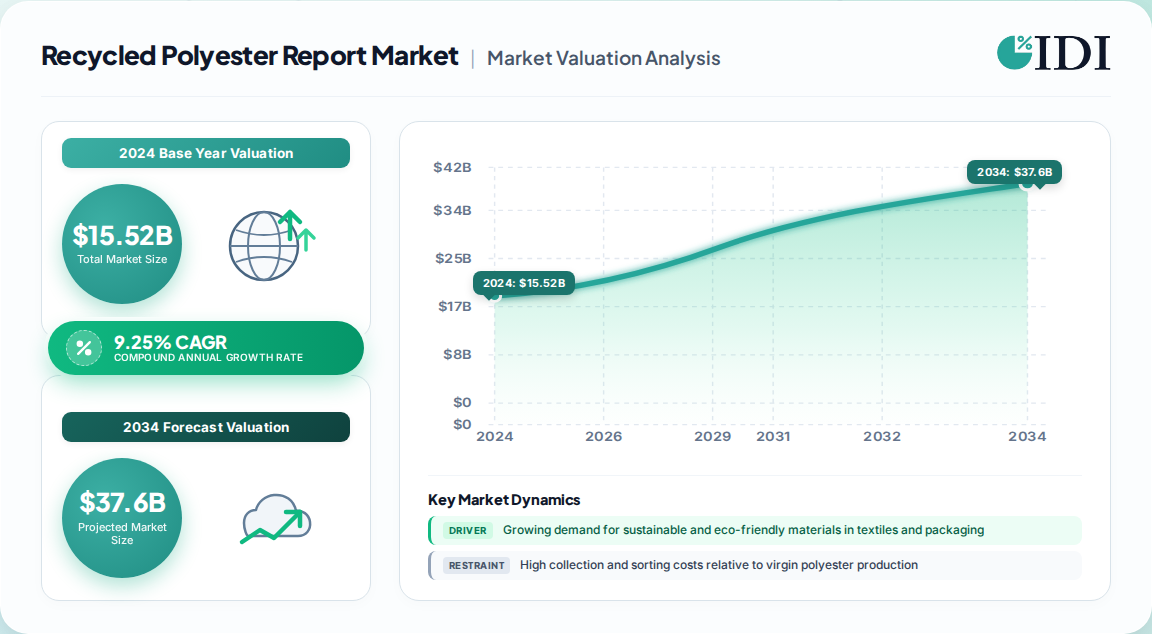
The global recycled polyester market is estimated at USD 15.52 billion in 2024 and is projected to reach USD 26.18 billion by 2030, expanding at a CAGR of 9.25% over the forecast period 2025–2030. This translates to a net value addition of USD 10.66 billion across six years.
Recycled Polyester Market Report Market Size (In Billion)
30.0B
20.0B
10.0B
0
16.96 B
2025
18.52 B
2026
20.24 B
2027
22.11 B
2028
24.16 B
2029
26.39 B
2030
28.83 B
2031
Recycled Polyester Market Report Market Size (In Billion)
Year
Market Size
2025
16.96 B
2026
18.52 B
2027
20.24 B
2028
22.11 B
2029
24.16 B
2030
26.39 B
2031
28.83 B
Growth is anchored in three structural forces: broad substitution of virgin petroleum-based polyester in apparel and home textiles, regulatory mandates on recycled content across European and North American markets, and the industrial scaling of bottle-to-fiber conversion capacity, particularly across Asia Pacific.
Key baseline metrics underpinning the forecast:
Metric
Value
2024 Market Size
USD 15.52 Billion
2026 Estimated Size
USD 16.8 Billion
2030 Projected Size
USD 26.18 Billion
Forecast CAGR (2025–2030)
9.25%
Asia Pacific Revenue Share (2024)
47.78%
The market growth stage is characterized as medium-maturity and accelerating, with moderate-to-high innovation intensity driven by chemical depolymerization advances and textile-to-textile circular platforms.
Cotton Spinning Material and Filling Material Product Tier Dominance
Product segmentation remains the primary revenue determinant. Cotton spinning material led the market with a 42.33% revenue share in 2024, reflecting its strength, dye-holding capability, and seamless integration into cotton-polyester blend mills.
Filling material is forecast to grow at the fastest rate within the product hierarchy, registering a 12.6% CAGR through 2030, driven by pillow, cushion, and comforter consumption in home textiles.
Product Segment
2024 Share / Growth
Primary Demand Driver
Cotton Spinning Material
42.33% share
Blend yarn for apparel spinning
Filling Material
12.6% CAGR
Home textiles, bedding, furniture
Non-woven
Growing
Hygiene, filtration, automotive
A parallel format lens shows staple fiber at 48–54% preference share today, while continuous filament is expected to capture 30–36% of incremental application value within three to five years on quality-enhancement grounds.
Apparel Application Leadership and Home Textile Expansion
Apparel is the anchor application, holding a 51.32% revenue share in 2024. Fashion brand circularity commitments and the affordability of bottle-to-fiber input have made apparel the most reliable volume outlet for recycled polyester.
Home textiles represent the second-fastest expanding application tier, projected to reach a 26–32% application share within five years as filling material and non-woven specifications mature.
Apparel: 51.3% share; fast-fashion supply chains absorb 38–44% of volume.
Home textiles: Expansion driven by bedding, cushioning, and upholstery.
Healthcare & hygiene: Non-woven absorbent hygiene units grow ~6% annually in Southeast Asia.
Asia Pacific Fiber Manufacturing and Regional Trade Flows
Asia Pacific is both the largest and fastest-growing region, at 47.78% revenue share in 2024. China and India anchor the region through integrated PTA-to-fiber chains and expanding textile recycling infrastructure. India's production-linked incentive scheme for man-made fiber and technical textiles has channeled greenfield spinning capacity into Gujarat and Maharashtra.
China: Drives PET processing and textile hub leadership; largest bottle-to-fiber converter base.
India: Emerging apparel export mill leader with policy-backed capacity.
Indonesia: Fiber manufacturing investment growth; polyester staple line expansion.
United States: CSR-driven retail leadership; recycled content adopted through brand procurement mandates.
Europe: Regulation-led adoption under Ecodesign for Sustainable Products Regulation and Digital Product Passport requirements.
Trade flow intelligence shows bottle-flake and food-grade rPET competing directly with fiber-grade converters for the same bales, with global PET bottle collection rates near 55%. Cross-border flows of sorted PET bales from Europe and North America into Asian spinning hubs remain a defining supply-chain feature.
Regulatory pull is now a procurement obligation rather than a reputational choice. The EU Strategy for Sustainable and Circular Textiles mandates recycled-content and durability parameters phased from 2027, while Extended Producer Responsibility schemes and single-use plastics bans compress virgin resin demand.
European fibre-to-fibre recycling remains nascent: only 2% of clothing input material originates from recycling streams, and most recycled polyester in textiles still derives from PET bottles. Södra and Lenzing have operated a coloured blended textile recycling program since June 2021, and industrial-scale demonstration plants targeting 50 kt/a of blended post-consumer waste are advancing under EU LIFE funding.
Near-term (2025–2027): Mechanical recycling and bottle-to-fiber dominate supply.
Medium-term (2027–2030): Chemical recycling and textile-to-textile platforms scale toward 35–41% processing share.
Long-term (2030+): Digital Product Passport traceability becomes a shelf-access prerequisite.
Supply Chain Cost Pressure and Feedstock Scarcity Constraints
The primary restraint is the high cost and inconsistency of collection, sorting, and processing post-consumer PET relative to virgin polyester production. Feedstock scarcity imposes an estimated drag of approximately -0.75% on CAGR globally over the medium term.
Additional constraints include microfibre shedding scrutiny in Europe, paraxylene and MEG spread volatility affecting non-integrated converters, and anti-dumping duties on trade flows into North America and Europe.
Collection and sorting infrastructure gaps in emerging markets limit scale.
Food-grade rPET outbids fiber-grade converters for premium bales.
Non-integrated European and South American converters absorb feedstock price shocks.
Compliance costs for microfibre disclosure penalize low-cost commodity output.
Competitive Landscape and Circular Fiber Portfolio Strategies
Competitive advantage is consolidating around recycled content profiles, documented mechanical properties, supply chain traceability, and integrated fiber portfolios rather than standalone recycling operations. Key participants include Indorama Ventures, Far Eastern New Century, Unifi Inc., Reliance Industries Limited, and Sinopec Yizheng Chemical Fibre.
Recent capital commitments signal that circular feedstock is now a board-level allocation decision. Eastman has committed roughly USD 1.0 billion across two molecular recycling plants, while mechanical and chemical recycling capacity expansions continue across Asia Pacific and Europe. The competitive threat from substitutes such as organic cotton, recycled nylon, and plant-based fibers remains moderate, tempered by recycled polyester's durability, cost-efficiency, and compatibility with existing melt-spinning infrastructure.
Our rigorous research methodology combines multi-layered approaches with comprehensive quality assurance, ensuring precision, accuracy, and reliability in every market analysis.
Primary Research
Conducted 70–80% of total research effort through direct primary interviews and surveys with senior executives across the recycled polyester value chain.
Interviewed procurement directors at apparel brands and retailers, plant operations managers at polyester staple fiber spinners, sustainability and compliance officers at textile converters, and feedstock sourcing heads at PET bottle collectors and recyclers.
Engaged technical directors at chemical recycling technology providers and supply chain traceability managers at fiber trading firms.
Primary interviews captured granular data on recycled content adoption rates, bottle-to-fiber conversion economics, off-take contract structures, and regional capacity expansion plans.
Verified producer capacity disclosures and conversion economics across approximately 180 spinning assets globally.
Key Stakeholders Interviewed
Key Stakeholders Interviewed
Stakeholder Role
Interview Share (%)
Procurement Director
28%
Plant Operations Manager
24%
Sustainability & Compliance Officer
22%
Feedstock Sourcing Head
16%
Supply Chain Traceability Manager
10%
Industry Ecosystem Breakdown
Industry Ecosystem Breakdown
Company Type
Representation (%)
Polyester Fiber Spinners & Integrated Producers
32%
Apparel Brands & Retailers
24%
PET Collection & Mechanical Recyclers
18%
Chemical Recycling Technology Providers
14%
Textile Converters & Nonwoven Manufacturers
12%
Secondary Research & Industry Benchmarking
20–30% of research derived from secondary sources including official multilateral databases such as UN Comtrade, World Bank, OECD, US ITC, and Eurostat for trade flow and capacity data.
Referenced recognized non-profit technical standards and industry trade associations including EDANA for nonwoven roll-goods data and the Ellen MacArthur Foundation for circular economy benchmarks.
Cross-checked regulatory frameworks including the EU Ecodesign for Sustainable Products Regulation and EU Circular Economy Action Plan against company disclosures and public filings.
Utilized standard financial databases including Bloomberg, Factiva, Hoovers, and PitchBook for corporate financials, M&A activity, and capital expenditure tracking.
Official sources included European Commission LIFE programme project data and national statistical agencies for textile waste and recycling volumes.
Demand Modeling & Market Estimation
Applied top-down and bottom-up methodologies simultaneously, validated via multi-level data triangulation across 180 spinning assets, trade flow datasets, and audited segment revenue disclosures.
Bottom-up model weighted to apparel consumption volumes, nonwoven hygiene unit demand, automotive build rates, and home textile filling consumption.
Quantitative metrics incorporated into the calculation include bottle-to-fiber conversion ratios, recycled content percentage by application, per-capita textile consumption, and PET bottle collection rates.
Forecast years applied a demand-side model with scenario adjustments for recycled feedstock availability and regulatory phase-in schedules.
Historical values reconciled against audited segment revenue where publicly available, stated in constant 2025 US dollars.
Data Accuracy & Quality Check
Guaranteed estimated data accuracy level of 85–90%, achieved through multi-level triangulation and cross-validation of primary and secondary sources.
All figures validated against at least three independent data points before incorporation into the final model.
Every report is updated to the date of purchase, ensuring the latest capacity announcements, regulatory changes, and trade flow data are reflected.
Quality assurance conducted by senior analysts with domain expertise in polyester fiber chemistry, textile manufacturing, and circular economy regulation.
Table 6: Recycled Polyester Market Report Revenue Billion Forecast, by Region 2020 & 2034
Table 7: Asia Pacific Recycled Polyester Market Report Revenue Billion Forecast, by Product 2020 & 2034
Table 8: Asia Pacific Recycled Polyester Market Report Revenue Billion Forecast, by Application 2020 & 2034
Table 9: Asia Pacific Recycled Polyester Market Report Revenue Billion Forecast, by Origin 2020 & 2034
Table 10: Asia Pacific Recycled Polyester Market Report Revenue Billion Forecast, by Format 2020 & 2034
Table 11: Asia Pacific Recycled Polyester Market Report Revenue Billion Forecast, by Feedstock 2020 & 2034
Table 12: Asia Pacific Recycled Polyester Market Report Revenue Billion Forecast, by Country 2020 & 2034
Table 13: China Recycled Polyester Market Report Revenue (Billion) Forecast, by Application 2020 & 2034
Table 14: India Recycled Polyester Market Report Revenue (Billion) Forecast, by Application 2020 & 2034
Table 15: Indonesia Recycled Polyester Market Report Revenue (Billion) Forecast, by Application 2020 & 2034
Japan Recycled Polyester Market Report Revenue (Billion) Forecast, by Application 2020 & 2034
Frequently Asked Questions
1. What is the current size of the recycled polyester market?
The global recycled polyester market was estimated at USD 15.52 billion in 2024 and is projected to reach USD 26.18 billion by 2030, growing at a CAGR of 9.25% from 2025 to 2030.
2. Which region dominates the recycled polyester market?
Asia Pacific is the largest and fastest-growing region, accounting for 47.78% of global revenue in 2024, driven by China and India's integrated textile manufacturing and recycling capacity.
3. What are the main applications of recycled polyester?
Apparel is the dominant application with a 51.32% revenue share in 2024, followed by home textiles, automotive interior, and healthcare and hygiene non-wovens.
4. What is driving the growth of the recycled polyester market?
Key drivers include sustainability mandates, regulatory recycled-content requirements such as the EU Ecodesign for Sustainable Products Regulation from 2027, and brand circularity commitments from global apparel companies.
5. Which product segment leads the recycled polyester market?
Cotton spinning material held the largest share at 42.33% in 2024, while filling material is forecast to grow at the fastest 12.6% CAGR through 2030.
6. What are the key challenges facing the recycled polyester market?
High collection and sorting costs, feedstock scarcity as food-grade rPET competes for the same bales, and underdeveloped recycling infrastructure in emerging markets constrain growth.
11.1.9.1. Company Overview
11.1.9.2. Products
11.1.9.3. Company Financials
11.1.9.4. SWOT Analysis
11.1.10. Södra
11.1.10.1. Company Overview
11.1.10.2. Products
11.1.10.3. Company Financials
11.1.10.4. SWOT Analysis
11.1.11. Lenzing AG
11.1.11.1. Company Overview
11.1.11.2. Products
11.1.11.3. Company Financials
11.1.11.4. SWOT Analysis
11.2. Market Entropy
11.2.1. Company's Key Areas Served
11.2.2. Recent Developments
11.3. Company Market Share Analysis, 2026
11.3.1. Top 5 Companies Market Share Analysis
11.3.2. Top 3 Companies Market Share Analysis
11.4. List of Potential Customers
Figure 16:
Figure 17: North America Recycled Polyester Market Report Revenue Share (%), by Application 2026 & 2034
Figure 18: North America Recycled Polyester Market Report Revenue (Billion), by Origin 2026 & 2034
Figure 19: North America Recycled Polyester Market Report Revenue Share (%), by Origin 2026 & 2034
Figure 20: North America Recycled Polyester Market Report Revenue (Billion), by Format 2026 & 2034
Figure 21: North America Recycled Polyester Market Report Revenue Share (%), by Format 2026 & 2034
Figure 22: North America Recycled Polyester Market Report Revenue (Billion), by Feedstock 2026 & 2034
Figure 23: North America Recycled Polyester Market Report Revenue Share (%), by Feedstock 2026 & 2034
Figure 24: North America Recycled Polyester Market Report Revenue (Billion), by Country 2026 & 2034
Figure 25: North America Recycled Polyester Market Report Revenue Share (%), by Country 2026 & 2034
Figure 26: Europe Recycled Polyester Market Report Revenue (Billion), by Product 2026 & 2034
Figure 27: Europe Recycled Polyester Market Report Revenue Share (%), by Product 2026 & 2034
Figure 28: Europe Recycled Polyester Market Report Revenue (Billion), by Application 2026 & 2034
Figure 29: Europe Recycled Polyester Market Report Revenue Share (%), by Application 2026 & 2034
Figure 30: Europe Recycled Polyester Market Report Revenue (Billion), by Origin 2026 & 2034
Figure 31: Europe Recycled Polyester Market Report Revenue Share (%), by Origin 2026 & 2034
Figure 32: Europe Recycled Polyester Market Report Revenue (Billion), by Format 2026 & 2034
Figure 33: Europe Recycled Polyester Market Report Revenue Share (%), by Format 2026 & 2034
Figure 34: Europe Recycled Polyester Market Report Revenue (Billion), by Feedstock 2026 & 2034
Figure 35: Europe Recycled Polyester Market Report Revenue Share (%), by Feedstock 2026 & 2034
Figure 36: Europe Recycled Polyester Market Report Revenue (Billion), by Country 2026 & 2034
Figure 37: Europe Recycled Polyester Market Report Revenue Share (%), by Country 2026 & 2034
Figure 38: South America Recycled Polyester Market Report Revenue (Billion), by Product 2026 & 2034
Figure 39: South America Recycled Polyester Market Report Revenue Share (%), by Product 2026 & 2034
Figure 40: South America Recycled Polyester Market Report Revenue (Billion), by Application 2026 & 2034
Figure 41: South America Recycled Polyester Market Report Revenue Share (%), by Application 2026 & 2034
Figure 42: South America Recycled Polyester Market Report Revenue (Billion), by Origin 2026 & 2034
Figure 43: South America Recycled Polyester Market Report Revenue Share (%), by Origin 2026 & 2034
Figure 44: South America Recycled Polyester Market Report Revenue (Billion), by Format 2026 & 2034
Figure 45: South America Recycled Polyester Market Report Revenue Share (%), by Format 2026 & 2034
Figure 46: South America Recycled Polyester Market Report Revenue (Billion), by Feedstock 2026 & 2034
Figure 47: South America Recycled Polyester Market Report Revenue Share (%), by Feedstock 2026 & 2034
Figure 48: South America Recycled Polyester Market Report Revenue (Billion), by Country 2026 & 2034
Figure 49: South America Recycled Polyester Market Report Revenue Share (%), by Country 2026 & 2034
Figure 50: Middle East & Africa Recycled Polyester Market Report Revenue (Billion), by Product 2026 & 2034
Figure 51: Middle East & Africa Recycled Polyester Market Report Revenue Share (%), by Product 2026 & 2034
Figure 52: Middle East & Africa Recycled Polyester Market Report Revenue (Billion), by Application 2026 & 2034
Figure 53: Middle East & Africa Recycled Polyester Market Report Revenue Share (%), by Application 2026 & 2034
Figure 54: Middle East & Africa Recycled Polyester Market Report Revenue (Billion), by Origin 2026 & 2034
Figure 55: Middle East & Africa Recycled Polyester Market Report Revenue Share (%), by Origin 2026 & 2034
Figure 56: Middle East & Africa Recycled Polyester Market Report Revenue (Billion), by Format 2026 & 2034
Figure 57: Middle East & Africa Recycled Polyester Market Report Revenue Share (%), by Format 2026 & 2034
Figure 58: Middle East & Africa Recycled Polyester Market Report Revenue (Billion), by Feedstock 2026 & 2034
Figure 59: Middle East & Africa Recycled Polyester Market Report Revenue Share (%), by Feedstock 2026 & 2034
Figure 60: Middle East & Africa Recycled Polyester Market Report Revenue (Billion), by Country 2026 & 2034
Figure 61: Middle East & Africa Recycled Polyester Market Report Revenue Share (%), by Country 2026 & 2034
Table 16:
Table 17: North America Recycled Polyester Market Report Revenue Billion Forecast, by Product 2020 & 2034
Table 18: North America Recycled Polyester Market Report Revenue Billion Forecast, by Application 2020 & 2034
Table 19: North America Recycled Polyester Market Report Revenue Billion Forecast, by Origin 2020 & 2034
Table 20: North America Recycled Polyester Market Report Revenue Billion Forecast, by Format 2020 & 2034
Table 21: North America Recycled Polyester Market Report Revenue Billion Forecast, by Feedstock 2020 & 2034
Table 22: North America Recycled Polyester Market Report Revenue Billion Forecast, by Country 2020 & 2034
Table 23: USA Recycled Polyester Market Report Revenue (Billion) Forecast, by Application 2020 & 2034