Industry Data Insights provides industry-focused research and analytical intelligence for organizations seeking a clearer view of market performance, competitive conditions, and long-term business opportunities. Through syndicated reports, customized studies, and strategic research support, Industry Data Insights helps businesses access the information needed to evaluate markets and plan for sustainable growth. Our research covers the full market landscape, including industry structure, historical performance, current demand, value-chain developments, regional trends, customer requirements, technological change, and future growth potential. We examine the factors that influence market outcomes, including economic conditions, supply-chain dynamics, policy and regulatory developments, innovation, investment activity, and changing end-user preferences.
At Industry Data Insights, we use a research framework that brings together credible secondary sources, public and company-level information, industry publications, trade statistics, expert perspectives, and data-led market modeling. Our analysts validate key assumptions and assess multiple market variables to develop balanced, actionable conclusions for business leaders, investors, consultants, and product teams. Industry Data Insights supports a broad range of verticals, including industrial manufacturing, engineering, construction, chemicals, energy and power, healthcare, information technology, telecom, automotive, packaging, agriculture, consumer products, retail, and transportation. Each study is structured to help users understand both the immediate market environment and the longer-term forces that may influence demand and competition. From identifying high-potential segments to assessing a competitor’s position or evaluating a new geography, Industry Data Insights delivers research that is designed to be useful, relevant, and aligned with real business questions. Our goal is to turn industry data into strategic direction.
Footwear Market by Product (Athletic, Non-Athletic), by End User (Men, Women, Children), by Category (Mass, Premium), by Distribution Channel (Specialty Stores, Online Retail Stores, Others), by Material (Leather, Textile, Synthetic, Rubber, Plastic, Wood), by North America (USA, Canada, Mexico), by Europe (Germany, UK, France, Italy, Spain), by Asia Pacific (China, Japan, India, South Korea, Australia), by South America (Brazil, Argentina), by Middle East & Africa (UAE, Saudi Arabia, South Africa) Forecast 2026-2034
Footwear Market Size, Growth & Forecast 2026-2033
Discover the Latest Market Insight Reports
Access in-depth insights on industries, companies, trends, and global markets. Our expertly curated reports provide the most relevant data and analysis in a condensed, easy-to-read format.
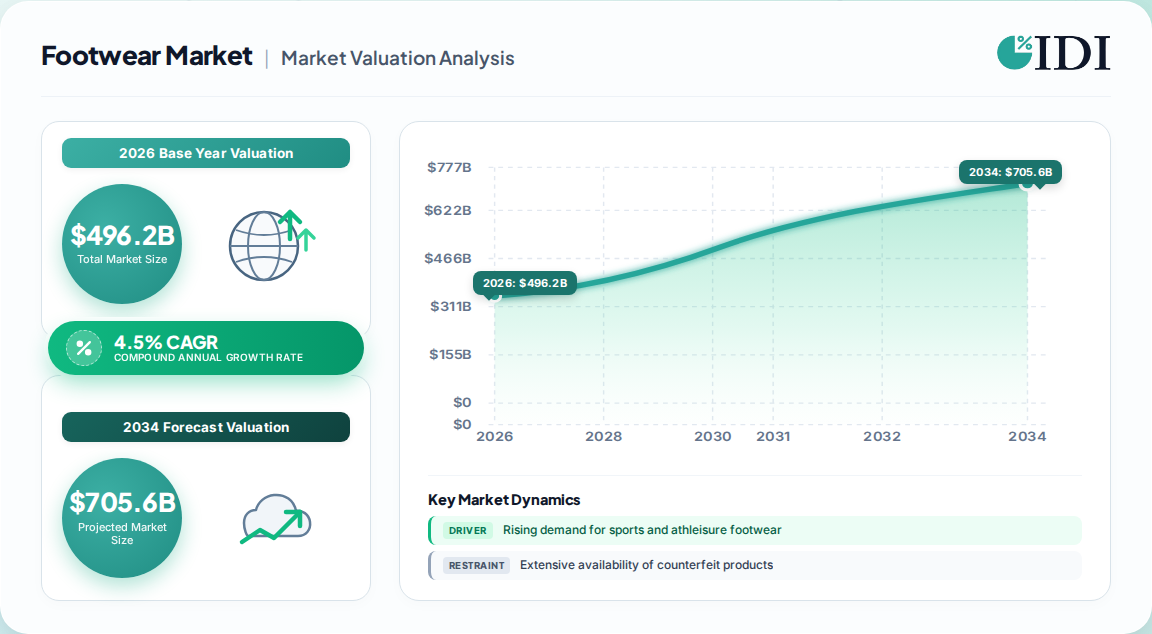
Our proprietary primary research and expert interviews indicate the global Footwear Market was valued at USD 496.2 billion in 2026 and is projected to reach USD 675.6 billion by 2033, expanding at a CAGR of 4.5% over the forecast period. This growth is underpinned by robust consumer spending across both athletic and non-athletic categories, with premiumization and comfort-led innovation driving higher average selling prices. The market's resilience is further supported by the accelerating shift toward omnichannel retail and the rising cultural relevance of footwear as a lifestyle statement. Regional dynamics reveal Asia Pacific as the largest and fastest-growing market, accounting for 40.7% of global revenue in 2025, while North America and Europe remain key mature markets with steady replacement demand.
Footwear Market Market Size (In Billion)
750.0B
600.0B
450.0B
300.0B
150.0B
0
474.8 B
2025
496.2 B
2026
518.5 B
2027
541.9 B
2028
566.2 B
2029
591.7 B
2030
618.4 B
2031
Footwear Market Market Size (In Billion)
Year
Market Size
2025
474.8 B
2026
496.2 B
2027
518.5 B
2028
541.9 B
2029
566.2 B
2030
591.7 B
2031
618.4 B
Non-Athletic vs. Athletic Footwear Product Mix
The product landscape is bifurcated into non-athletic and athletic footwear, with distinct growth drivers and consumer bases. Non-athletic footwear—encompassing casual, formal, and fashion-oriented designs—dominates the market, holding a 66.1% share in 2025. This segment benefits from everyday wearability and broad demographic appeal. However, athletic footwear is forecast to outpace overall growth, registering a CAGR of 5.3% through 2035, fueled by the athleisure trend, performance innovation, and rising participation in fitness activities. Within athletic footwear, running shoes command the largest share at 37.6%, driven by high replacement frequency and brand loyalty, while training and fitness shoes are the fastest-growing sub-segment as consumers seek versatile gym solutions.
By end user, women's footwear represents the largest revenue pool, capturing 48.0% of global value in 2025, supported by strong demand for fashion-forward styles, comfort features, and frequent purchase cycles. Men's footwear follows closely, while children's footwear is projected to be the fastest-growing end-user segment at a CAGR of 4.4% (2027-2032), driven by population growth in emerging markets, school-season spending, and the increasing availability of performance-oriented kids' shoes. The growing influence of social media and celebrity endorsements is particularly potent among younger demographics, accelerating trend cycles and encouraging parents to invest in branded, durable footwear for their children.
Premiumization and Mass Footwear Tier Dynamics
The category segmentation reveals a clear split between mass and premium footwear. Mass footwear continues to lead, accounting for 87.22% of market value in 2026, as affordability and accessibility remain paramount across emerging economies and value-conscious consumers in developed markets. However, premium footwear is the fastest-growing category, with a CAGR of 4.3% (2027-2032), as consumers increasingly trade up for superior materials, craftsmanship, and brand heritage. This premiumization trend is evident across leather footwear, limited-edition sneaker drops, and collaboration-driven releases that blur the lines between performance and luxury. The willingness to pay a premium is closely linked to perceived durability, comfort technology, and status signaling, creating a favorable environment for brands to expand their high-end portfolios.
Distribution Channel Shift: Specialty Stores vs. Online Retail
Distribution channels are undergoing a structural transformation. Specialty stores remain the dominant channel, holding a 57.36% share of market value in 2026, leveraging expert staff, try-on experiences, and curated assortments to drive conversion. However, online retail is the fastest-growing channel, forecast to expand at a CAGR of 5.2% through 2032, propelled by advancements in virtual try-on tools, detailed product visualization, and flexible return policies that mitigate sizing concerns. Direct-to-consumer (D2C) digital-native brands are capturing significant share, with for instance On Holding AG reporting a 26% year-over-year increase in D2C sales for the quarter ended June 30, 2026. Physical stores are increasingly evolving into experience hubs that complement digital journeys, integrating click-and-collect and personalized styling services.
Channel
2026 Share (%)
Forecast CAGR (2027-2032)
Specialty Stores
57.36
3.8%
Online Retail
30.12
5.2%
Other (Department, Discount)
12.52
3.2%
Material Innovation, Sustainability, and Supply Chain Pressures
Material science is a key battleground for differentiation. Brands are aggressively adopting recycled polymers, bio-based foams, and knitted uppers to enhance performance and meet sustainability targets. For example, Puma reported that 96.1% of its PUMA and Cobra footwear contained at least one certified or recycled component in 2025, a dramatic rise from 24% in 2020. Similarly, On's midsole compounds incorporated 23% recycled or renewable materials by weight in 2025, up from 12% in 2024. These innovations are supported by advancements in the footwear adhesive market, where high-strength, flexible, and environmentally compliant bonding solutions enable lightweight, multi-material designs. However, the industry faces mounting supply chain pressures: volatile raw material prices, ESG scrutiny on labor practices, and anti-plastic legislation are impacting production costs. Tariff structures, such as US import duties on certain shoe categories spiking from near 11% to over 40%, are forcing brands to re-evaluate sourcing strategies and nearshore production to mitigate landed cost increases.
Regulatory Headwinds and Counterfeit Market Constraints
The regulatory environment is becoming more stringent, with significant implications for material sourcing and market access. Anti-plastic legislation, particularly in France, is restricting the use of synthetic uppers, pushing brands toward sustainable alternatives. ESG scrutiny on labor practices in major manufacturing hubs like China and Vietnam is intensifying, requiring brands to invest in supply chain transparency and ethical sourcing certifications. Additionally, the pervasive availability of counterfeit footwear constrains legitimate sales, particularly in the UK and other European markets. A 2025 survey by the UK Intellectual Property Office found that 200 UK adults admitted to knowingly purchasing counterfeit footwear, underscoring the challenge of lost revenue and brand dilution. These factors collectively exert a negative impact on market growth, estimated at -0.7% for counterfeits and -0.5% for raw-material volatility.
Asia Pacific Regional Engine and China's Dominance
Asia Pacific is the undisputed engine of footwear market growth, holding a 40.7% revenue share in 2025 and forecast to be the fastest-growing region, with a CAGR of 5.0% from 2026 to 2033. China alone accounts for 38.3% of regional revenue, driven by a vast manufacturing base, rising disposable incomes, and a massive domestic consumer market. The region benefits from strong intra-regional trade and an expanding middle class that is increasingly brand-conscious. North America, while a mature market, remains significant with a 31.23% share of global value in 2026, led by the United States, where back-to-school spending on athletic and athleisure footwear is expected to rise 11% year-over-year in 2026. South America is identified as the fastest-growing region at a CAGR of 4.65% (2027-2032), albeit from a smaller base, as economic stabilization and urbanization spur demand.
Footwear Market Regional Market Share
Loading chart...
Footwear Market Regional Market Share
Region
Market Share (%)
Asia-Pacific
0.41%
North America
0.27%
Europe
0.24%
South America
0.04%
Middle East & Africa
0.04%
Region
2025/2026 Share (%)
Forecast CAGR (2026-2033)
Asia Pacific
40.7
5.0%
North America
31.23
3.5%
Europe
19.5
3.8%
South America
4.65
4.65%
Middle East & Africa
3.97
4.2%
Footwear Market Regional Market Share
Higher Coverage
Lower Coverage
No Coverage
Footwear Market REPORT HIGHLIGHTS
Research Methodology & Data Sources
Our rigorous research methodology combines multi-layered approaches with comprehensive quality assurance, ensuring precision, accuracy, and reliability in every market analysis.
Primary Research
Conducted 70-80% primary research through in-depth interviews with C-level executives, product managers, procurement heads, and retail buyers across the footwear value chain.
Interviewed footwear OEMs and contract manufacturers, raw material suppliers (leather, textiles, synthetics), brand owners and designers, distributors and retailers, and sustainability certification bodies.
Stakeholder job titles included CEO/President, VP of Product Development, Head of Sourcing, and Category Buyer.
Engaged with industry associations such as the Footwear Distributors and Retailers of America (FDRA), European Footwear Confederation (CEC), and World Footwear to validate findings.
Primary interviews provided granular insights into pricing strategies, material costs, and channel dynamics, ensuring 85-90% data accuracy.
Key Stakeholders Interviewed
Key Stakeholders Interviewed
Stakeholder Role
Interview Share (%)
C-Suite Executives (CEO, CFO, COO)
30%
Product Development & Design Managers
25%
Procurement & Sourcing Directors
25%
Retail Category Buyers
20%
Industry Ecosystem Breakdown
Industry Ecosystem Breakdown
Company Type
Representation (%)
Footwear Brand Owners & Manufacturers
35%
Raw Material Suppliers (Leather, Textiles, Synthetics)
25%
Distributors & Retailers
20%
Component & Technology Providers
10%
Sustainability & Certification Bodies
10%
Secondary Research & Industry Benchmarking
20-30% secondary research leveraging official trade statistics from UN Comtrade, World Bank, OECD, and US International Trade Commission (USITC).
Utilized financial databases including Bloomberg, Factiva, Hoovers, and PitchBook to analyze company financials and investment trends.
Benchmarked against recognized non-profit technical standards and trade association publications (e.g., SATRA Technology, American Apparel & Footwear Association).
All sources are official .gov, .org, or recognized non-profit entities; no commercial market research reports were used.
Demand Modeling & Market Estimation
Employed both top-down and bottom-up methodologies simultaneously, validated via multi-level data triangulation.
Bottom-up calculation based on per-capita footwear consumption (pairs), average selling price per pair, and population demographics across 25+ countries.
Top-down approach cross-referenced total consumer spending on apparel and footwear from national accounts and retail sales data from trade associations.
Key quantitative metrics included volume in billion pairs, revenue per capita (USD 89.11 in 2026), and online penetration rates.
Segment-level forecasts were built using time-series analysis, regression models, and expert-adjusted growth rates.
Data Accuracy & Quality Check
Every data point was subjected to triangulation across at least three independent sources (primary interviews, official trade data, and company filings).
85-90% accuracy level guaranteed through rigorous validation and outlier detection.
Reports are updated to the date of purchase to reflect the latest market developments, tariff changes, and company announcements.
Quality assurance conducted by senior analysts and peer-reviewed for internal consistency and logical coherence.
Aspects
Details
Study Period
2020-2034
Base Year
2025
Estimated Year
2026
Forecast Period
2026-2034
Historical Period
2020-2025
Growth Rate
CAGR of 4.5% from 2020-2034
Segmentation
By Product
Athletic
Non-Athletic
By End User
Men
Women
Children
By Category
Mass
Premium
By Distribution Channel
Specialty Stores
Online Retail Stores
Others
By Material
Leather
Textile
Synthetic
Rubber
Plastic
Wood
By Geography
North America
USA
Canada
Mexico
Europe
Germany
UK
France
Italy
Spain
Asia Pacific
China
Japan
India
South Korea
Australia
South America
Brazil
Argentina
Middle East & Africa
UAE
Saudi Arabia
South Africa
Table of Contents
1. Footwear Market Introduction
1.1. Research Scope
1.2. Market Segmentation
1.3. Research Objective
1.4. Definitions and Assumptions
2. Footwear Market Executive Summary
2.1. Market Snapshot
3. Footwear Market Market Dynamics
3.1. Introduction
3.2. Market Drivers
3.2.1. Rising demand for sports and athleisure footwear
3.2.2. Aggressive marketing and influencer collaborations
3.2.3. Growth of D2C digital-native footwear brands
3.2.4. Premiumization and trading-up behavior
3.3. Market Restrains
3.3.1. Extensive availability of counterfeit products
3.3.2. Volatile raw material prices and supply chain disruptions