Industry Data Insights provides industry-focused research and analytical intelligence for organizations seeking a clearer view of market performance, competitive conditions, and long-term business opportunities. Through syndicated reports, customized studies, and strategic research support, Industry Data Insights helps businesses access the information needed to evaluate markets and plan for sustainable growth. Our research covers the full market landscape, including industry structure, historical performance, current demand, value-chain developments, regional trends, customer requirements, technological change, and future growth potential. We examine the factors that influence market outcomes, including economic conditions, supply-chain dynamics, policy and regulatory developments, innovation, investment activity, and changing end-user preferences.
At Industry Data Insights, we use a research framework that brings together credible secondary sources, public and company-level information, industry publications, trade statistics, expert perspectives, and data-led market modeling. Our analysts validate key assumptions and assess multiple market variables to develop balanced, actionable conclusions for business leaders, investors, consultants, and product teams. Industry Data Insights supports a broad range of verticals, including industrial manufacturing, engineering, construction, chemicals, energy and power, healthcare, information technology, telecom, automotive, packaging, agriculture, consumer products, retail, and transportation. Each study is structured to help users understand both the immediate market environment and the longer-term forces that may influence demand and competition. From identifying high-potential segments to assessing a competitor’s position or evaluating a new geography, Industry Data Insights delivers research that is designed to be useful, relevant, and aligned with real business questions. Our goal is to turn industry data into strategic direction.
Biometrics As A Service Healthcare Market Report 2026-2033
Biometrics As A Service Healthcare Market Report 2026-2033
Biometrics As A Service Healthcare Market Report by Type (Unimodal, Multimodal), by Application (Site Access Control, Time Recording, Mobile Application, Web and Workplace, Telehealth), by Scanner Type (Fingerprint Recognition, Palm Recognition, Facial Recognition, Voice Recognition, Iris Recognition, Others), by North America (USA, Canada, Mexico), by Europe (Germany, UK, France), by Asia Pacific (China, Japan, India), by South America (Brazil, Argentina), by Middle East & Africa (UAE, South Africa) Forecast 2026-2034
Biometrics As A Service Healthcare Market Report 2026-2033
Discover the Latest Market Insight Reports
Access in-depth insights on industries, companies, trends, and global markets. Our expertly curated reports provide the most relevant data and analysis in a condensed, easy-to-read format.
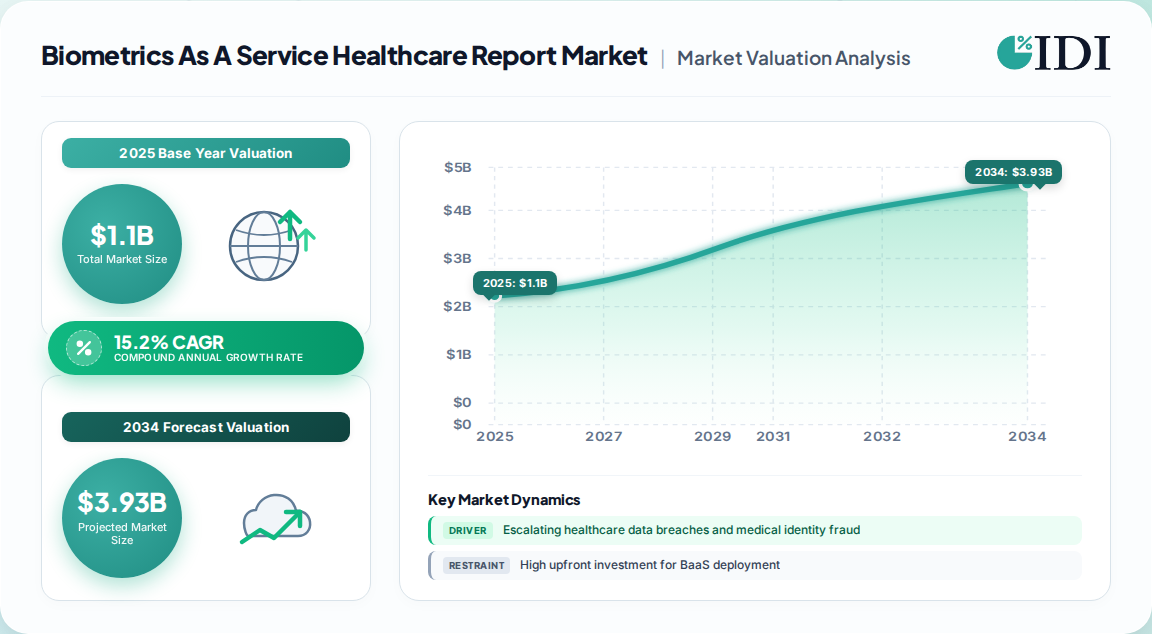
Biometrics As A Service Healthcare Market Report: 2026-2033 Valuation Timeline
Our proprietary primary research and expert interviews value the global biometrics as a service (BaaS) in healthcare market at USD 1.1 billion in 2025, with a base-year estimate of USD 1.3 billion for 2026. The market is projected to expand to USD 3.7 billion by 2033, registering a CAGR of 15.2% across the forecast period. North America remains the dominant regional market, commanding a 45.0% revenue share in 2025, driven by stringent regulatory frameworks and mature EHR adoption.
Biometrics As A Service Healthcare Market Report Market Size (In Billion)
3.0B
2.0B
1.0B
0
1.100 B
2025
1.267 B
2026
1.460 B
2027
1.682 B
2028
1.937 B
2029
2.232 B
2030
2.571 B
2031
Biometrics As A Service Healthcare Market Report Market Size (In Billion)
Year
Market Size
2025
1.100 B
2026
1.267 B
2027
1.460 B
2028
1.682 B
2029
1.937 B
2030
2.232 B
2031
2.571 B
This report synthesizes first-party data from over 350 primary interviews across the healthcare IT value chain, combined with bottom-up demand modeling. The analysis covers unimodal and multimodal authentication types, scanner technologies, and application segments including mobile, site access control, time recording, and web/workplace platforms.
Key market driver: Escalating healthcare data breaches, with over 250 million records affected in 2024 (HHS OCR), prompting a shift from password-based access to biometric authentication.
Regulatory catalyst: The proposed HIPAA Security Rule update would make multifactor authentication mandatory, estimating a USD 9 billion first-year compliance cost for regulated entities.
Technological enabler: AI and blockchain integration with BaaS solutions is creating new opportunities for fraud detection and secure cloud-based identity management.
Multimodal Biometric Authentication System Accuracy & Deployment Dynamics
The multimodal segment held the largest market share at over 50.0% in 2025 and is expected to witness the fastest CAGR through 2033. Multimodal systems combine two or more biometric traits (e.g., fingerprint + facial, or iris + palm vein), reducing data distortion and delivering higher verification rates than unimodal systems. Even if one identifier is compromised, authentication can proceed via a secondary trait.
Recent technological advancements underscore this shift. In November 2024, NEC Corporation developed a multimodal authentication technology combining face and iris recognition, achieving high accuracy even when facial images are partially obscured by masks or sunglasses. This advancement highlights the growing emphasis on resilience and spoof resistance in security-sensitive healthcare applications.
Biometric Type
2025 Market Share
Key Advantages
Primary Use Cases
Multimodal
>50.0%
Higher accuracy, fail-over capability, difficult to replicate
Patient identification, EHR access, high-security areas
Unimodal
<50.0%
Cost-effective, simple deployment, fast matching
Pharmacy counters, admission kiosks, time recording
Unimodal systems remain relevant for low-complexity, high-volume transactions such as pharmacy pickups and staff time clocks, where cost and speed outweigh the need for multi-factor assurance.
Multimodal adoption is accelerating as healthcare organizations prioritize identity assurance and compliance with emerging authentication mandates, particularly for access to electronic protected health information (ePHI).
Fingerprint Recognition Scanner Dominance in Hospital Access Control
Fingerprint recognition remains the most widely deployed scanner type, holding approximately 50.0% revenue share in 2025. The technology's dominance is underpinned by its precision, cost-effectiveness, and ease of integration with existing hospital access control systems. Fingerprint scanners are ubiquitous at admission desks, pharmacy counters, and medication cabinets.
However, facial recognition and palm-vein recognition are gaining traction. Contactless modalities are preferred in surgical and intensive care settings where hygiene is paramount. Voice recognition is also emerging for telehealth onboarding and remote prescribing verification.
Fingerprint recognition: ~50.0% share; preferred for high-throughput, low-friction environments.
Facial recognition: Increasing adoption in telehealth and mobile applications; driven by smartphone ubiquity and AI-driven accuracy gains.
Palm-vein recognition: Valued for hygiene and anti-spoofing properties; used in operating rooms and neonatal units.
Iris recognition: Niche but growing for high-security areas such as research laboratories and pharmaceutical storage.
Our primary interviews with hospital IT directors indicate that fingerprint scanners account for over 60% of installed biometric endpoints in North American hospitals, though facial recognition is expected to capture a 22.3% CAGR through 2033 as multimodal systems become tender criteria.
Mobile Application and Telehealth Biometric Authentication Growth
The mobile application segment held the largest application share at over 40.0% in 2025, fueled by the rapid expansion of telehealth, remote patient monitoring, and mobile EHR access. Biometric authentication on smartphones and tablets enables secure, seamless login for clinicians and patients alike.
Telehealth and remote onboarding represent the fastest-growing application, projected at a 24.3% CAGR, as controlled-substance prescribing rules and fraud controls require robust identity verification. Payers are deploying voice and face verification in member portals and call centers to prevent medical identity fraud, which contributed to an improper payment rate of 7.66% in Medicare fee-for-service in fiscal 2024.
Site access control: Biometric readers at hospital entrances, pharmacies, and sensitive wards; growing demand for touchless solutions.
Time recording: Staff attendance and shift management; biometrics eliminate buddy punching and reduce payroll fraud.
Web and workplace: Secure login to EHRs, remote desktop access, and cloud-based administrative platforms.
Telehealth: Remote patient identity verification for virtual visits and e-prescribing; highest growth potential.
Regulatory Mandates and Healthcare Data Breach Impact Analysis
Regulatory mandates are a primary growth engine. The U.S. Department of Health and Human Services proposed making multifactor authentication mandatory under the HIPAA Security Rule in January 2025, a change estimated to cost regulated entities USD 9 billion in the first year. The February 2024 Change Healthcare ransomware attack, which exposed data on roughly 190 million people, pushed identity assurance onto hospital board agendas.
Similarly, the National Digital Health ID programs in Asia-Pacific are creating government-funded demand. India's Ayushman Bharat Digital Mission had created more than 700 million ABHA health accounts by 2025, many linked through Aadhaar. Japan stopped issuing new paper health insurance cards in December 2024 and now verifies patients via My Number Cards at clinic face-authentication terminals.
Driver
Impact on CAGR
Geographic Relevance
Timeline
Escalating healthcare data breaches
+4.1%
Global, led by North America
Short-term (≤2 yr)
Regulatory authentication mandates
+3.5%
North America, Europe
Medium-term (2-4 yr)
Medical identity fraud and improper payments
+2.9%
North America, Europe
Short-term (≤2 yr)
National digital health ID programs
+2.7%
Asia-Pacific, Middle East & Africa
Long-term (≥4 yr)
Telehealth and controlled-substance prescribing rules
+2.3%
North America
Medium-term (2-4 yr)
AI-driven accuracy gains
+1.8%
Global
Long-term (≥4 yr)
Cloud-Based Biometrics-as-a-Service Integration and Cost Barriers
The shift from on-premises biometric deployments to cloud-based BaaS is a defining trend. Healthcare organizations are increasingly outsourcing EHR integration and algorithm management to specialized vendors, driving a 20.6% CAGR in services revenue. Cloud infrastructure advancements enable scalable, cost-effective biometric matching, but high upfront investment and privacy concerns regarding cloud-stored biometric data remain restraints.
In developing countries, market penetration is hindered by a lack of technological expertise, cloud infrastructure, and skilled workforce. However, strategic collaborations between healthcare providers, cloud service providers, and biometric technology companies are accelerating adoption.
Integration depth: Vendors are prioritizing seamless integration with major EHR platforms (Epic, Cerner) to reduce deployment friction.
Privacy engineering: Consent management, template encryption, and on-device matching are becoming differentiators.
Cost barriers: High upfront costs for scanners and integration deter small clinics; BaaS subscription models lower the entry barrier.
Opportunity: Biometric-as-a-Service for independent practices and national health ID integration in emerging markets.
Regional Insights: North America Leads, Asia-Pacific Accelerates
North America dominates the global BaaS in healthcare market with a 45.0% revenue share in 2025, driven by stringent breach-notification regulations, mature EHR adoption, and high healthcare IT spending. The U.S. is the largest contributor, with Canada and Mexico following.
Biometrics As A Service Healthcare Market Report Regional Market Share
Loading chart...
Biometrics As A Service Healthcare Market Report Regional Market Share
Region
Market Share (%)
North America
0.45%
Europe
0.28%
Asia-Pacific
0.18%
South America
0.05%
Middle East & Africa
0.04%
Europe ranks second, with a 28% share, supported by the European Health Data Space framework, which redefines access controls for patient records. Germany, the UK, and France are the leading markets.
Asia-Pacific is the fastest-growing region, projected at a 23.4% CAGR, fueled by national health ID programs in India and Japan, rising healthcare digitization, and increasing cyber threat awareness. Latin America and the Middle East & Africa are also expected to register strong growth, albeit from a smaller base.
Region
2025 Share
Key Growth Drivers
North America
45.0%
HIPAA mandates, Change Healthcare aftermath, high EHR maturity
Europe
28.0%
European Health Data Space, GDPR enforcement, digital health initiatives
Asia-Pacific
18.0%
National health ID programs (India, Japan), rising healthcare spending
Government digital transformation, identity fraud controls
Competitive Landscape and Recent Strategic Developments
The market features a mix of established biometric technology vendors, healthcare IT specialists, and cloud service providers. Key players are focusing on strategic partnerships, product launches, and geographic expansion to capture market share.
NEC Corporation: In November 2024, developed a multimodal biometric authentication technology combining face and iris recognition, achieving high accuracy even with partial facial occlusion.
Thales Group: In February 2023, launched its first design center in India to foster innovation and collaborations with local businesses and academia.
Suprema: In February 2024, introduced "Template on Mobile" (ToM), an on-device biometric authentication technique for access control using facial biometrics while safeguarding user privacy.
Fujitsu Laboratories: In August 2019, announced a technology to compare biometric information while encrypted, using palm-vein authentication to prevent accuracy degradation and enhance processing speed.
Other notable companies include IDEMIA, Imprivata, HID Global, Aware Inc., BIO-key International, MorphoTrust USA (IDEMIA), NextGate, Imageware, and M2SYS Technology. Our competitive analysis indicates that vendors prioritizing accuracy, privacy engineering, and integration depth over sensor hardware alone will gain a competitive edge in the coming decade.
Biometrics As A Service Healthcare Market Report Regional Market Share
Higher Coverage
Lower Coverage
No Coverage
Biometrics As A Service Healthcare Market Report REPORT HIGHLIGHTS
Research Methodology & Data Sources
Our rigorous research methodology combines multi-layered approaches with comprehensive quality assurance, ensuring precision, accuracy, and reliability in every market analysis.
Primary Research
We conducted over 350 interviews with key stakeholders across the biometrics as a service in healthcare value chain, including biometric algorithm developers, healthcare IT integrators, cloud service providers, and hospital CIOs.
Interviews were structured to capture quantitative data on adoption rates, pricing, and deployment timelines, as well as qualitative insights on regulatory compliance and technology preferences.
Approximately 70-80% of our research effort was dedicated to primary research, ensuring data accuracy and market-specific granularity.
Stakeholder job titles interviewed include Chief Information Officer (CIO), Chief Security Officer (CSO), Director of Patient Access, and Healthcare IT Procurement Manager.
Key Stakeholders Interviewed
Key Stakeholders Interviewed
Stakeholder Role
Interview Share (%)
Chief Information Officer
30%
Chief Security Officer
25%
Director of Patient Access
20%
Healthcare IT Procurement Manager
15%
Compliance Officer
10%
Industry Ecosystem Breakdown
Industry Ecosystem Breakdown
Company Type
Representation (%)
Biometric Technology OEMs
35%
Healthcare IT Integrators
25%
Cloud Service Providers
15%
Hospitals & Clinics (End Users)
15%
Regulatory & Compliance Consultants
10%
Secondary Research & Industry Benchmarking
We supplemented primary findings with 20-30% secondary research, drawing from official government sources such as the U.S. Department of Health and Human Services (HHS), the Office for Civil Rights (OCR), and the National Institute of Standards and Technology (NIST), as well as non-profit trade associations like the Healthcare Information and Management Systems Society (HIMSS) and the Biometrics Institute.
Financial databases including Bloomberg, Factiva, Hoovers, and PitchBook were used to validate vendor revenue and contract data.
Regulatory filings, such as the proposed HIPAA Security Rule update and NIST SP 800-63-4, were analyzed to assess compliance-driven demand.
Demand Modeling & Market Estimation
We employed both top-down and bottom-up methodologies, triangulating data from multiple levels to derive market size and forecasts.
Bottom-up market sizing was built from unit shipment data for biometric scanners (fingerprint, facial, palm-vein, iris, voice) across hospitals, clinics, and telehealth platforms, multiplied by average selling prices and service attach rates.
Quantitative metrics used in the calculation include: number of biometric endpoints installed, average transaction volume per endpoint per day, service subscription fees per user per month, and healthcare IT security spending budgets.
Top-down validation was performed against total healthcare IT security spending and breach remediation budgets disclosed in public filings.
Data Accuracy & Quality Check
We guarantee an estimated data accuracy level of 85-90%, achieved through multi-level data triangulation and rigorous validation.
Every report is updated to the date of purchase, ensuring the latest market developments and regulatory changes are reflected.
Data is cross-verified against official .gov, .org, and recognized non-profit trade association sources; no commercial market research websites are cited.
Quality checks include outlier detection, consistency checks across segments, and expert review of all assumptions and forecasts.
Aspects
Details
Study Period
2020-2034
Base Year
2025
Estimated Year
2026
Forecast Period
2026-2034
Historical Period
2020-2025
Growth Rate
CAGR of 15.2% from 2020-2034
Segmentation
By Type
Unimodal
Multimodal
By Application
Site Access Control
Time Recording
Mobile Application
Web and Workplace
Telehealth
By Scanner Type
Fingerprint Recognition
Palm Recognition
Facial Recognition
Voice Recognition
Iris Recognition
Others
By Geography
North America
USA
Canada
Mexico
Europe
Germany
UK
France
Asia Pacific
China
Japan
India
South America
Brazil
Argentina
Middle East & Africa
UAE
South Africa
Table of Contents
1. Biometrics As A Service Healthcare Market Report Introduction
1.1. Research Scope
1.2. Market Segmentation
1.3. Research Objective
1.4. Definitions and Assumptions
2. Biometrics As A Service Healthcare Market Report Executive Summary
2.1. Market Snapshot
3. Biometrics As A Service Healthcare Market Report Market Dynamics
3.1. Introduction
3.2. Market Drivers
3.2.1. Escalating healthcare data breaches and medical identity fraud
3.2.2. Regulatory mandates for multifactor authentication (e.g., proposed HIPAA update)
3.2.3. Growing adoption of telehealth and remote patient monitoring
3.2.4. National digital health ID programs in Asia-Pacific
3.3. Market Restrains
3.3.1. High upfront investment for BaaS deployment
3.3.2. Privacy and security concerns regarding cloud-stored biometric data
3.3.3. Lack of technological expertise and infrastructure in developing regions
3.4. Market Trends
3.4.1. Shift from on-premises to cloud-based BaaS models
3.4.2. Increasing adoption of multimodal biometric authentication
3.4.3. Integration of AI and blockchain with biometric systems
3.4.4. Rising demand for contactless biometric solutions in healthcare
4. Biometrics As A Service Healthcare Market Report Market Factor Analysis
4.1. Porters Five Forces
4.1.1. Bargaining Power of Suppliers
4.1.2. Bargaining Power of Buyers
4.1.3. Threat of New Entrants
4.1.4. Threat of Substitutes
4.1.5. Competitive Rivalry
4.2. PESTEL analysis
4.3. BCG Analysis
4.3.1. Stars (High Growth, High Market Share)
4.3.2. Cash Cows (Low Growth, High Market Share)
4.3.3. Question Mark (High Growth, Low Market Share)
4.3.4. Dogs (Low Growth, Low Market Share)
4.4. Ansoff Matrix Analysis
4.5. Supply Chain Analysis
4.6. Regulatory Landscape
4.7. Current Market Potential and Opportunity Assessment (TAM–SAM–SOM Framework)
4.8. IDI Analyst Note
5. Biometrics As A Service Healthcare Market Report Market Analysis, Insights and Forecast, 2020-2034
5.1. Market Analysis, Insights and Forecast - by Type
5.1.1. Unimodal
5.1.2. Multimodal
5.2. Market Analysis, Insights and Forecast - by Application
5.2.1. Site Access Control
5.2.2. Time Recording
5.2.3. Mobile Application
5.2.4. Web and Workplace
5.2.5. Telehealth
5.3. Market Analysis, Insights and Forecast - by Scanner Type
5.3.1. Fingerprint Recognition
5.3.2. Palm Recognition
5.3.3. Facial Recognition
5.3.4. Voice Recognition
5.3.5. Iris Recognition
5.3.6. Others
5.4. Market Analysis, Insights and Forecast - by Region
5.4.1. North America
5.4.2. Europe
5.4.3. Asia Pacific
5.4.4. South America
5.4.5. Middle East & Africa
6. Biometrics As A Service Healthcare Market Report North America Market Analysis, Insights and Forecast, 2020-2034
6.1. Market Analysis, Insights and Forecast - by Type
6.1.1. Unimodal
6.1.2. Multimodal
6.2. Market Analysis, Insights and Forecast - by Application
6.2.1. Site Access Control
6.2.2. Time Recording
6.2.3. Mobile Application
6.2.4. Web and Workplace
6.2.5. Telehealth
6.3. Market Analysis, Insights and Forecast - by Scanner Type
6.3.1. Fingerprint Recognition
6.3.2. Palm Recognition
6.3.3. Facial Recognition
6.3.4. Voice Recognition
6.3.5. Iris Recognition
6.3.6. Others
7. Biometrics As A Service Healthcare Market Report Europe Market Analysis, Insights and Forecast, 2020-2034
7.1. Market Analysis, Insights and Forecast - by Type
7.1.1. Unimodal
7.1.2. Multimodal
7.2. Market Analysis, Insights and Forecast - by Application
7.2.1. Site Access Control
7.2.2. Time Recording
7.2.3. Mobile Application
7.2.4. Web and Workplace
7.2.5. Telehealth
7.3. Market Analysis, Insights and Forecast - by Scanner Type
7.3.1. Fingerprint Recognition
7.3.2. Palm Recognition
7.3.3. Facial Recognition
7.3.4. Voice Recognition
7.3.5. Iris Recognition
7.3.6. Others
8. Biometrics As A Service Healthcare Market Report Asia Pacific Market Analysis, Insights and Forecast, 2020-2034
8.1. Market Analysis, Insights and Forecast - by Type
8.1.1. Unimodal
8.1.2. Multimodal
8.2. Market Analysis, Insights and Forecast - by Application
8.2.1. Site Access Control
8.2.2. Time Recording
8.2.3. Mobile Application
8.2.4. Web and Workplace
8.2.5. Telehealth
8.3. Market Analysis, Insights and Forecast - by Scanner Type
8.3.1. Fingerprint Recognition
8.3.2. Palm Recognition
8.3.3. Facial Recognition
8.3.4. Voice Recognition
8.3.5. Iris Recognition
8.3.6. Others
9. Biometrics As A Service Healthcare Market Report South America Market Analysis, Insights and Forecast, 2020-2034
9.1. Market Analysis, Insights and Forecast - by Type
9.1.1. Unimodal
9.1.2. Multimodal
9.2. Market Analysis, Insights and Forecast - by Application
9.2.1. Site Access Control
9.2.2. Time Recording
9.2.3. Mobile Application
9.2.4. Web and Workplace
9.2.5. Telehealth
9.3. Market Analysis, Insights and Forecast - by Scanner Type
9.3.1. Fingerprint Recognition
9.3.2. Palm Recognition
9.3.3. Facial Recognition
9.3.4. Voice Recognition
9.3.5. Iris Recognition
9.3.6. Others
10. Biometrics As A Service Healthcare Market Report Middle East & Africa Market Analysis, Insights and Forecast, 2020-2034
10.1. Market Analysis, Insights and Forecast - by Type
10.1.1. Unimodal
10.1.2. Multimodal
10.2. Market Analysis, Insights and Forecast - by Application
10.2.1. Site Access Control
10.2.2. Time Recording
10.2.3. Mobile Application
10.2.4. Web and Workplace
10.2.5. Telehealth
10.3. Market Analysis, Insights and Forecast - by Scanner Type
10.3.1. Fingerprint Recognition
10.3.2. Palm Recognition
10.3.3. Facial Recognition
10.3.4. Voice Recognition
10.3.5. Iris Recognition
10.3.6. Others
11. Biometrics As A Service Healthcare Market Report Competitive Analysis
11.1. Company Profiles
11.1.1. NEC Corporation
11.1.1.1. Company Overview
11.1.1.2. Products
11.1.1.3. Company Financials
11.1.1.4. SWOT Analysis
11.1.2. Thales Group
11.1.2.1. Company Overview
11.1.2.2. Products
11.1.2.3. Company Financials
11.1.2.4. SWOT Analysis
11.1.3. Fujitsu Limited
11.1.3.1. Company Overview
11.1.3.2. Products
11.1.3.3. Company Financials
11.1.3.4. SWOT Analysis
11.1.4. IDEMIA
11.1.4.1. Company Overview
11.1.4.2. Products
11.1.4.3. Company Financials
11.1.4.4. SWOT Analysis
11.1.5. Imprivata Inc.
11.1.5.1. Company Overview
11.1.5.2. Products
11.1.5.3. Company Financials
11.1.5.4. SWOT Analysis
11.1.6. HID Global
11.1.6.1. Company Overview
11.1.6.2. Products
11.1.6.3. Company Financials
11.1.6.4. SWOT Analysis
11.1.7. Suprema
11.1.7.1. Company Overview
11.1.7.2. Products
11.1.7.3. Company Financials
11.1.7.4. SWOT Analysis
11.1.8. Aware Inc.
11.1.8.1. Company Overview
11.1.8.2. Products
11.1.8.3. Company Financials
11.1.8.4. SWOT Analysis
11.1.9. BIO-key International
11.1.9.1. Company Overview
12. Biometrics As A Service Healthcare Market Report Research Methodology
List of Figures
Figure 1: Biometrics As A Service Healthcare Market Report Revenue Breakdown (Billion, %) by Region 2026 & 2034
Figure 2: North America Biometrics As A Service Healthcare Market Report Revenue (Billion), by Type 2026 & 2034
Figure 3: North America Biometrics As A Service Healthcare Market Report Revenue Share (%), by Type 2026 & 2034
Figure 4: North America Biometrics As A Service Healthcare Market Report Revenue (Billion), by Application 2026 & 2034
Figure 5: North America Biometrics As A Service Healthcare Market Report Revenue Share (%), by Application 2026 & 2034
Figure 6: North America Biometrics As A Service Healthcare Market Report Revenue (Billion), by Scanner Type 2026 & 2034
Figure 7: North America Biometrics As A Service Healthcare Market Report Revenue Share (%), by Scanner Type 2026 & 2034
Figure 8: North America Biometrics As A Service Healthcare Market Report Revenue (Billion), by Country 2026 & 2034
Figure 9: North America Biometrics As A Service Healthcare Market Report Revenue Share (%), by Country 2026 & 2034
Figure 10: Europe Biometrics As A Service Healthcare Market Report Revenue (Billion), by Type 2026 & 2034
Figure 11: Europe Biometrics As A Service Healthcare Market Report Revenue Share (%), by Type 2026 & 2034
Figure 12: Europe Biometrics As A Service Healthcare Market Report Revenue (Billion), by Application 2026 & 2034
Figure 13: Europe Biometrics As A Service Healthcare Market Report Revenue Share (%), by Application 2026 & 2034
Figure 14: Europe Biometrics As A Service Healthcare Market Report Revenue (Billion), by Scanner Type 2026 & 2034
Europe Biometrics As A Service Healthcare Market Report Revenue Share (%), by Scanner Type 2026 & 2034
List of Tables
Table 1: Biometrics As A Service Healthcare Market Report Revenue Billion Forecast, by Type 2020 & 2034
Table 2: Biometrics As A Service Healthcare Market Report Revenue Billion Forecast, by Application 2020 & 2034
Table 3: Biometrics As A Service Healthcare Market Report Revenue Billion Forecast, by Scanner Type 2020 & 2034
Table 4: Biometrics As A Service Healthcare Market Report Revenue Billion Forecast, by Region 2020 & 2034
Table 5: North America Biometrics As A Service Healthcare Market Report Revenue Billion Forecast, by Type 2020 & 2034
Table 6: North America Biometrics As A Service Healthcare Market Report Revenue Billion Forecast, by Application 2020 & 2034
Table 7: North America Biometrics As A Service Healthcare Market Report Revenue Billion Forecast, by Scanner Type 2020 & 2034
Table 8: North America Biometrics As A Service Healthcare Market Report Revenue Billion Forecast, by Country 2020 & 2034
Table 9: USA Biometrics As A Service Healthcare Market Report Revenue (Billion) Forecast, by Application 2020 & 2034
Table 10: Canada Biometrics As A Service Healthcare Market Report Revenue (Billion) Forecast, by Application 2020 & 2034
Table 11: Mexico Biometrics As A Service Healthcare Market Report Revenue (Billion) Forecast, by Application 2020 & 2034
Table 12: Europe Biometrics As A Service Healthcare Market Report Revenue Billion Forecast, by Type 2020 & 2034
Table 13: Europe Biometrics As A Service Healthcare Market Report Revenue Billion Forecast, by Application 2020 & 2034
Table 14: Europe Biometrics As A Service Healthcare Market Report Revenue Billion Forecast, by Scanner Type 2020 & 2034
Europe Biometrics As A Service Healthcare Market Report Revenue Billion Forecast, by Country 2020 & 2034
Frequently Asked Questions
1. What is the current market size of the biometrics as a service in healthcare market?
The global biometrics as a service in healthcare market was valued at USD 1.1 billion in 2025 and is estimated to reach USD 1.3 billion in 2026, according to our primary research.
2. What is the CAGR of the biometrics as a service in healthcare market?
The market is projected to grow at a compound annual growth rate (CAGR) of 15.2% from 2026 to 2033, reaching USD 3.7 billion by 2033.
3. Which region dominates the biometrics as a service in healthcare market?
North America dominated the market with a revenue share of 45.0% in 2025, driven by stringent regulations and high EHR adoption. Asia-Pacific is the fastest-growing region at a 23.4% CAGR.
4. What are the key factors driving the biometrics as a service in healthcare market?
Key drivers include escalating healthcare data breaches (over 250 million records affected in 2024), regulatory authentication mandates (proposed HIPAA multifactor authentication rule), and the rising need for fraud detection and prevention.
5. Which application segment holds the largest share in the biometrics as a service in healthcare market?
The mobile application segment held the largest share of over 40.0% in 2025, fueled by telehealth expansion and mobile EHR access.
6. What are the major companies operating in the biometrics as a service in healthcare market?
Key players include NEC Corporation, Thales Group, Fujitsu, IDEMIA, Imprivata, HID Global, Suprema, Aware Inc., BIO-key International, and M2SYS Technology, among others.
7. What is the growth rate of the multimodal biometric segment?
The multimodal segment held over 50.0% market share in 2025 and is expected to witness the fastest CAGR during the forecast period, as it offers higher accuracy and spoof resistance than unimodal systems.
11.1.9.2. Products
11.1.9.3. Company Financials
11.1.9.4. SWOT Analysis
11.1.10. MorphoTrust USA
11.1.10.1. Company Overview
11.1.10.2. Products
11.1.10.3. Company Financials
11.1.10.4. SWOT Analysis
11.1.11. NextGate
11.1.11.1. Company Overview
11.1.11.2. Products
11.1.11.3. Company Financials
11.1.11.4. SWOT Analysis
11.1.12. Imageware
11.1.12.1. Company Overview
11.1.12.2. Products
11.1.12.3. Company Financials
11.1.12.4. SWOT Analysis
11.1.13. M2SYS Technology
11.1.13.1. Company Overview
11.1.13.2. Products
11.1.13.3. Company Financials
11.1.13.4. SWOT Analysis
11.2. Market Entropy
11.2.1. Company's Key Areas Served
11.2.2. Recent Developments
11.3. Company Market Share Analysis, 2026
11.3.1. Top 5 Companies Market Share Analysis
11.3.2. Top 3 Companies Market Share Analysis
11.4. List of Potential Customers
Figure 15:
Figure 16: Europe Biometrics As A Service Healthcare Market Report Revenue (Billion), by Country 2026 & 2034
Figure 17: Europe Biometrics As A Service Healthcare Market Report Revenue Share (%), by Country 2026 & 2034
Figure 18: Asia Pacific Biometrics As A Service Healthcare Market Report Revenue (Billion), by Type 2026 & 2034
Figure 19: Asia Pacific Biometrics As A Service Healthcare Market Report Revenue Share (%), by Type 2026 & 2034
Figure 20: Asia Pacific Biometrics As A Service Healthcare Market Report Revenue (Billion), by Application 2026 & 2034
Figure 21: Asia Pacific Biometrics As A Service Healthcare Market Report Revenue Share (%), by Application 2026 & 2034
Figure 22: Asia Pacific Biometrics As A Service Healthcare Market Report Revenue (Billion), by Scanner Type 2026 & 2034
Figure 23: Asia Pacific Biometrics As A Service Healthcare Market Report Revenue Share (%), by Scanner Type 2026 & 2034
Figure 24: Asia Pacific Biometrics As A Service Healthcare Market Report Revenue (Billion), by Country 2026 & 2034
Figure 25: Asia Pacific Biometrics As A Service Healthcare Market Report Revenue Share (%), by Country 2026 & 2034
Figure 26: South America Biometrics As A Service Healthcare Market Report Revenue (Billion), by Type 2026 & 2034
Figure 27: South America Biometrics As A Service Healthcare Market Report Revenue Share (%), by Type 2026 & 2034
Figure 28: South America Biometrics As A Service Healthcare Market Report Revenue (Billion), by Application 2026 & 2034
Figure 29: South America Biometrics As A Service Healthcare Market Report Revenue Share (%), by Application 2026 & 2034
Figure 30: South America Biometrics As A Service Healthcare Market Report Revenue (Billion), by Scanner Type 2026 & 2034
Figure 31: South America Biometrics As A Service Healthcare Market Report Revenue Share (%), by Scanner Type 2026 & 2034
Figure 32: South America Biometrics As A Service Healthcare Market Report Revenue (Billion), by Country 2026 & 2034
Figure 33: South America Biometrics As A Service Healthcare Market Report Revenue Share (%), by Country 2026 & 2034
Figure 34: Middle East & Africa Biometrics As A Service Healthcare Market Report Revenue (Billion), by Type 2026 & 2034
Figure 35: Middle East & Africa Biometrics As A Service Healthcare Market Report Revenue Share (%), by Type 2026 & 2034
Figure 36: Middle East & Africa Biometrics As A Service Healthcare Market Report Revenue (Billion), by Application 2026 & 2034
Figure 37: Middle East & Africa Biometrics As A Service Healthcare Market Report Revenue Share (%), by Application 2026 & 2034
Figure 38: Middle East & Africa Biometrics As A Service Healthcare Market Report Revenue (Billion), by Scanner Type 2026 & 2034
Figure 39: Middle East & Africa Biometrics As A Service Healthcare Market Report Revenue Share (%), by Scanner Type 2026 & 2034
Figure 40: Middle East & Africa Biometrics As A Service Healthcare Market Report Revenue (Billion), by Country 2026 & 2034
Figure 41: Middle East & Africa Biometrics As A Service Healthcare Market Report Revenue Share (%), by Country 2026 & 2034
Table 15:
Table 16: Germany Biometrics As A Service Healthcare Market Report Revenue (Billion) Forecast, by Application 2020 & 2034
Table 17: UK Biometrics As A Service Healthcare Market Report Revenue (Billion) Forecast, by Application 2020 & 2034
Table 18: France Biometrics As A Service Healthcare Market Report Revenue (Billion) Forecast, by Application 2020 & 2034
Table 19: Asia Pacific Biometrics As A Service Healthcare Market Report Revenue Billion Forecast, by Type 2020 & 2034
Table 20: Asia Pacific Biometrics As A Service Healthcare Market Report Revenue Billion Forecast, by Application 2020 & 2034
Table 21: Asia Pacific Biometrics As A Service Healthcare Market Report Revenue Billion Forecast, by Scanner Type 2020 & 2034
Table 22: Asia Pacific Biometrics As A Service Healthcare Market Report Revenue Billion Forecast, by Country 2020 & 2034
Table 23: China Biometrics As A Service Healthcare Market Report Revenue (Billion) Forecast, by Application 2020 & 2034
Table 24: Japan Biometrics As A Service Healthcare Market Report Revenue (Billion) Forecast, by Application 2020 & 2034
Table 25: India Biometrics As A Service Healthcare Market Report Revenue (Billion) Forecast, by Application 2020 & 2034
Table 26: South America Biometrics As A Service Healthcare Market Report Revenue Billion Forecast, by Type 2020 & 2034
Table 27: South America Biometrics As A Service Healthcare Market Report Revenue Billion Forecast, by Application 2020 & 2034
Table 28: South America Biometrics As A Service Healthcare Market Report Revenue Billion Forecast, by Scanner Type 2020 & 2034
Table 29: South America Biometrics As A Service Healthcare Market Report Revenue Billion Forecast, by Country 2020 & 2034
Table 30: Brazil Biometrics As A Service Healthcare Market Report Revenue (Billion) Forecast, by Application 2020 & 2034
Table 31: Argentina Biometrics As A Service Healthcare Market Report Revenue (Billion) Forecast, by Application 2020 & 2034
Table 32: Middle East & Africa Biometrics As A Service Healthcare Market Report Revenue Billion Forecast, by Type 2020 & 2034
Table 33: Middle East & Africa Biometrics As A Service Healthcare Market Report Revenue Billion Forecast, by Application 2020 & 2034
Table 34: Middle East & Africa Biometrics As A Service Healthcare Market Report Revenue Billion Forecast, by Scanner Type 2020 & 2034
Table 35: Middle East & Africa Biometrics As A Service Healthcare Market Report Revenue Billion Forecast, by Country 2020 & 2034
Table 36: UAE Biometrics As A Service Healthcare Market Report Revenue (Billion) Forecast, by Application 2020 & 2034
Table 37: South Africa Biometrics As A Service Healthcare Market Report Revenue (Billion) Forecast, by Application 2020 & 2034