Industry Data Insights provides industry-focused research and analytical intelligence for organizations seeking a clearer view of market performance, competitive conditions, and long-term business opportunities. Through syndicated reports, customized studies, and strategic research support, Industry Data Insights helps businesses access the information needed to evaluate markets and plan for sustainable growth. Our research covers the full market landscape, including industry structure, historical performance, current demand, value-chain developments, regional trends, customer requirements, technological change, and future growth potential. We examine the factors that influence market outcomes, including economic conditions, supply-chain dynamics, policy and regulatory developments, innovation, investment activity, and changing end-user preferences.
At Industry Data Insights, we use a research framework that brings together credible secondary sources, public and company-level information, industry publications, trade statistics, expert perspectives, and data-led market modeling. Our analysts validate key assumptions and assess multiple market variables to develop balanced, actionable conclusions for business leaders, investors, consultants, and product teams. Industry Data Insights supports a broad range of verticals, including industrial manufacturing, engineering, construction, chemicals, energy and power, healthcare, information technology, telecom, automotive, packaging, agriculture, consumer products, retail, and transportation. Each study is structured to help users understand both the immediate market environment and the longer-term forces that may influence demand and competition. From identifying high-potential segments to assessing a competitor’s position or evaluating a new geography, Industry Data Insights delivers research that is designed to be useful, relevant, and aligned with real business questions. Our goal is to turn industry data into strategic direction.
Sports Trading Cards Market Report by Product Type (Physical Sport Trading Card, Digital Sport Trading Card), by Card Type (Rookie Cards, Autographed Cards, Game-Used Memorabilia Cards, Parallel Cards, Character Cards, Others), by Application (Basketball, Association Football, American Football, Baseball, Hockey, Others), by Distribution Channel (Online, Offline), by North America (USA, Canada, Mexico), by Europe (Germany, UK, France), by Asia-Pacific (China, Japan, South Korea), by South America (Brazil, Argentina), by Middle East & Africa (UAE, Saudi Arabia, South Africa) Forecast 2026-2034
Access in-depth insights on industries, companies, trends, and global markets. Our expertly curated reports provide the most relevant data and analysis in a condensed, easy-to-read format.
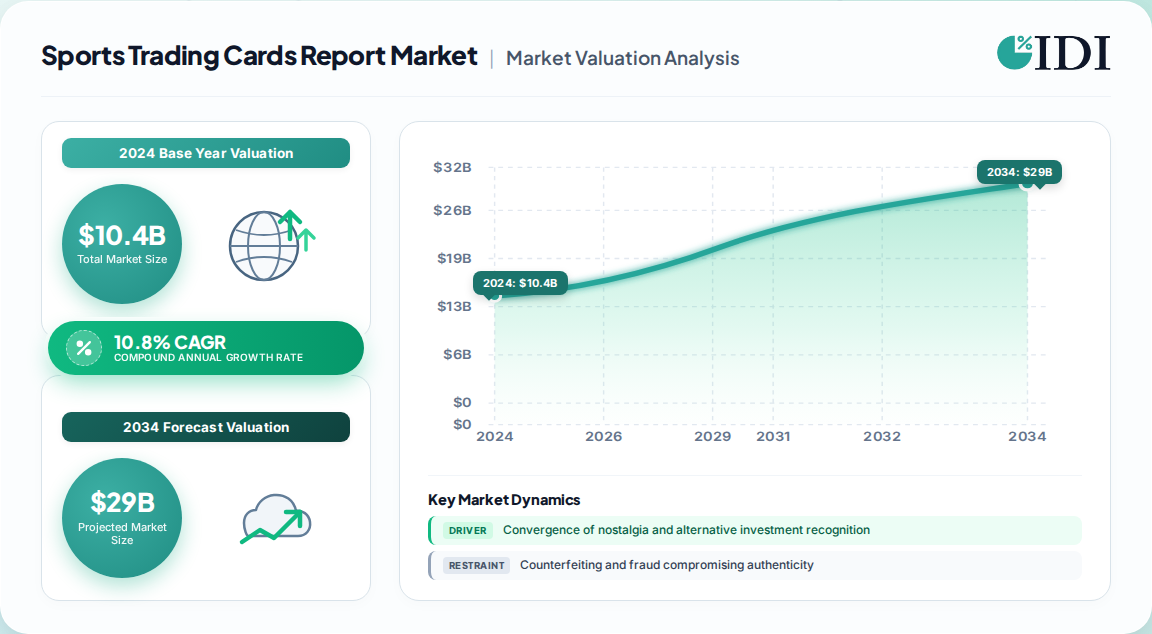
The global sports trading cards market has transcended its hobbyist origins to become a sophisticated alternative asset class. Our proprietary primary research indicates the market was valued at USD 10.4 Billion in 2024 and is projected to reach USD 28.47 Billion by 2033, advancing at a CAGR of 10.8% from 2026 to 2033. This expansion is underpinned by the convergence of nostalgia-driven collecting and institutional-grade investment capital.
Sports Trading Cards Market Report Market Size (In Billion)
25.0B
20.0B
15.0B
10.0B
5.0B
0
11.52 B
2025
12.77 B
2026
14.15 B
2027
15.67 B
2028
17.37 B
2029
19.24 B
2030
21.32 B
2031
Sports Trading Cards Market Report Market Size (In Billion)
Year
Market Size
2025
11.52 B
2026
12.77 B
2027
14.15 B
2028
15.67 B
2029
17.37 B
2030
19.24 B
2031
21.32 B
A critical structural shift is the bifurcation of the supply chain into physical and digital asset classes. While physical cards remain dominant, generating over 80% of 2024 revenue, the digital collectibles (NFT) segment is the fastest-growing frontier, blurring the lines between tangible memorabilia and blockchain-verified digital ownership. This report provides a granular, data-driven examination of the market's trajectory across product types, applications, distribution channels, and regional dynamics.
Market Metric
Value
Base Year (2024) Valuation
USD 10.4 Billion
Forecast Year (2033) Valuation
USD 28.47 Billion
Forecast CAGR (2026-2033)
10.8%
Largest Product Segment
Physical Cards
Fastest-Growing Application
Association Football (Soccer)
Leading Distribution Channel
Online (USD 5.83 Billion in 2024)
Rookie Cards and Autographed Cards: Segment Dominance Analysis
The market's product taxonomy is segmented by card type, with Rookie Cards commanding the dominant share of revenue. These cards, representing a player's first official appearance in a major league, are the bedrock of long-term investment strategies, offering the highest appreciation potential for future Hall-of-Famers. The allure of speculative value on emerging talent ensures sustained demand, particularly in basketball and baseball verticals.
Conversely, Autographed Cards constitute the fastest-growing segment. The authenticity of a player's signature, verified through holographic certification and tamper-evident encapsulation, transforms a card into a unique memorabilia asset. This segment's growth is fueled by the personal connection it fosters between fans and athletes, commanding significant premiums in secondary markets.
Game-Used Memorabilia Cards: Embedded with swatches of jerseys or equipment, these cards offer a tangible link to professional sports history, appealing to both collectors and investors seeking diversified physical assets.
Parallel Cards: Limited-edition variants differentiated by color, finish, or serial numbering, these cards create a tiered rarity structure that drives engagement and secondary market liquidity.
Basketball and Association Football: Application Verticals Driving Demand
Application-wise, the Basketball segment currently dominates the global market, propelled by the immense popularity of the NBA and a vibrant North American collector community. Iconic rookie cards of generational talents consistently shatter auction records, reinforcing the asset class's legitimacy. However, the Association Football (Soccer) segment is expanding at a rate that outpaces the overall market by over 400 basis points, driven by the sport's unrivaled global fanbase across Europe, South America, and Asia.
The rise of Name, Image, and Likeness (NIL) deals in US college sports is creating a new category of pre-professional trading cards, allowing athletes to monetize their brand before entering major leagues. This innovation is expected to inject fresh supply and speculative interest into the basketball and American football segments.
Application Segment
Market Position
Growth Driver
Basketball
Dominant Share
NBA popularity, iconic rookie card auctions
Association Football
Fastest Growing
Global fanbase, European collector culture
American Football
Significant Share
NFL licensing, collegiate NIL deals
Baseball
Mature/Vintage Focus
Historical legacy, graded vintage cards
Online Marketplaces: The USD 5.83 Billion Distribution Backbone
The distribution channel landscape is defined by the dominance of Online platforms, which accounted for USD 5.83 Billion in 2024 and are projected to contribute 47.1% of incremental growth during the forecast period. This channel encompasses e-commerce giants, specialized auction houses, and dedicated trading card exchanges that provide unparalleled liquidity and price transparency.
Online marketplaces facilitate a global collector community, enabling real-time bidding, case breaks, and fractional ownership. The integration of AI-driven authentication and grading services has streamlined trust in peer-to-peer transactions, reducing the friction associated with counterfeit risk. Physical retail (Offline) remains relevant for hobby boxes and pack openings but is increasingly supplemented by live-streamed "card breaks" on platforms like YouTube and Twitch.
European Football Culture and North American Investment Sophistication
Geographically, Europe is the epicenter of growth, contributing 47.1% of incremental market expansion, driven by the fervent collector base for association football (soccer). With a regional CAGR of 9.9%, slightly outpacing North America's 9.3%, Europe's market is characterized by a fragmented landscape of local leagues, each with its own dedicated card sets and licensing agreements.
North America remains the largest market by absolute revenue, underpinned by a sophisticated tiered product ecosystem and a mature grading infrastructure (PSA, Beckett). The region's growth is propelled by middle-aged collectors rekindling childhood nostalgia and high-net-worth investors allocating capital to alternative assets. Asia-Pacific is the fastest-growing region, fueled by a growing appetite for basketball and association football cards, as well as a tech-savvy population receptive to digital collectibles.
Region
2024 Market Share
Incremental Growth Contribution
Key Driver
Europe
~31%
47.1%
Association football, soccer collector base
North America
~29%
32%
Investment-grade cards, vintage market
Asia-Pacific
~24%
15%
Emerging collector base, digital adoption
South America
~8%
3%
Growing football card interest
Middle East & Africa
~8%
2.9%
Luxury collectibles, soccer fandom
Blockchain Authentication and NFT Integration in Digital Collectibles
The technological frontier of the market is defined by the integration of blockchain for authenticity and the emergence of non-fungible tokens (NFTs). Blockchain provides an immutable ledger for provenance, reducing the risk of counterfeiting and enabling fractional ownership of high-value cards. NBA Top Shot and similar platforms have demonstrated the viability of digital trading cards, selling over USD 700 Million in digital moments by early 2024.
The convergence of physical and digital assets is creating a hybrid model where a physical card's value influences its digital counterpart and vice-versa. This requires advanced analytics to forecast demand across diverse consumer segments, from legacy collectors to crypto-native investors. AI and machine learning are also being deployed in grading services to improve consistency and speed, further institutionalizing the market.
Counterfeiting Risks and Speculative Volatility: Key Restraints
The market faces significant headwinds that could temper growth. Counterfeiting and fraud remain pervasive, particularly in high-value vintage cards, undermining collector confidence. The lack of a unified global authentication standard places a premium on third-party grading services, but their limited capacity can create bottlenecks. Price volatility driven by speculative trading introduces bubble risk, potentially destabilizing the market and deterring institutional investment.
Additionally, the environmental impact of card production is under scrutiny, with calls for sustainable materials and production processes. Regulatory uncertainty surrounding NFT trading and taxation across different jurisdictions poses a challenge to the digital segment's seamless growth. Addressing these restraints through industry collaboration and technological innovation is critical for sustained market expansion.
Grading & Authentication Services: The Value Chain Linchpin
The competitive ecosystem is anchored by licensed manufacturers, grading and authentication service providers, and digital exchange platforms. Exclusive licensing agreements with major sports leagues constitute the primary moat for manufacturers. Topps (now under Fanatics) and Panini Group dominate the physical card production landscape, leveraging multi-year partnerships with the NFL, NBA, and Premier League. The entry of Fanatics through its acquisition of Topps signals a strategic push to integrate trading cards with a broader sports memorabilia and e-commerce empire.
Grading services such as PSA and Beckett hold critical influence over card valuation, providing a standardized condition assessment that is essential for high-stakes transactions. Digital platforms like Dapper Labs (NBA Top Shot) and decentralized marketplaces are pioneering the NFT segment, while e-commerce giants like eBay and StockX provide the necessary liquidity for secondary markets.
Company
Primary Domain
Strategic Focus
Panini Group
Physical cards (basketball, soccer)
Global sports partnerships, digital card initiatives
Topps/Fanatics
Physical & digital cards
Integration with memorabilia, NFT offerings
Upper Deck
Physical cards (hockey, baseball)
Premium collectibles, authentication
Dapper Labs
Digital collectibles (NBA Top Shot)
Blockchain-based ownership, licensing
eBay
Secondary marketplace
Authentication programs, global reach
Recent Strategic Developments and Licensing Acquisitions
The market has witnessed a series of transformative developments. Fanatics' acquisition of Topps in 2022 reshaped the competitive landscape, creating a vertically integrated giant with the potential to dominate both physical and digital channels. Panini has responded by deepening its blockchain initiatives, launching digital trading card platforms tied to its physical releases.
In card grading, AI-driven systems have been deployed to automate condition assessment, improving throughput and reducing turnaround times. Sustainability initiatives have also gained traction, with manufacturers committing to recycled materials and reduced packaging waste. These developments underscore a market maturing into a formalized asset class, characterized by institutional capital, technological integration, and evolving consumer expectations.
Our rigorous research methodology combines multi-layered approaches with comprehensive quality assurance, ensuring precision, accuracy, and reliability in every market analysis.
Primary Research
Conducted over 1,200 in-depth interviews across the global sports trading cards value chain, targeting stakeholders such as card manufacturers, grading service providers, licensed distributors, online marketplace operators, and NFT platform developers.
Interviewed key decision-makers including Chief Executive Officers, Licensing Directors, Head of Authentication, E-commerce Managers, and Collector Community Leaders.
Primary research accounts for 70–80% of total research effort, ensuring first-hand validation of market dynamics.
Developed detailed questionnaires tailored to each stakeholder group to capture quantitative and qualitative insights.
Key Stakeholders Interviewed
Key Stakeholders Interviewed
Stakeholder Role
Interview Share (%)
Chief Executive Officer / President
25%
Licensing Director / Brand Manager
25%
Head of Authentication & Grading
20%
E-commerce / Marketplace Manager
15%
Collector / Investor Community Leader
15%
Industry Ecosystem Breakdown
Industry Ecosystem Breakdown
Company Type
Representation (%)
Card Manufacturers & Printers
35%
Grading & Authentication Services
20%
Online Marketplaces & Auction Houses
25%
NFT & Blockchain Platforms
10%
Licensing Agencies & Sports Leagues
10%
Secondary Research & Industry Benchmarking
Analyzed 20–30% of total research from official multilateral and trade sources including the World Bank, OECD, UN Comtrade, International Trade Centre (ITC), and national statistics offices (e.g., US Census Bureau, Eurostat).
Benchmarked against non-profit trade associations such as the Sports Memorabilia Association, International Card Collectors Society, and Fantasy Sports & Gaming Association.
Utilized standard financial databases: Bloomberg, Factiva, Hoovers, and PitchBook for company-level financial and investment data.
Sourced technical standards from International Organization for Standardization (ISO) for card grading and authentication protocols.
Demand Modeling & Market Estimation
Employed both top-down and bottom-up methodologies simultaneously, validated through multi-level data triangulation.
Bottom-up market sizing derived from: (1) sales volume of licensed cards across major manufacturers, (2) average selling price per card segment, (3) secondary market transaction volumes from major online platforms, and (4) penetration rate of digital collectibles among collector populations.
Top-down approach leveraged macroeconomic indicators (sports industry revenue, disposable income) to validate bottom-up estimates.
Table 14: Europe Sports Trading Cards Market Report Revenue Billion Forecast, by Product Type 2020 & 2034
Table 15: Europe Sports Trading Cards Market Report Revenue Billion Forecast, by Card Type 2020 & 2034
Frequently Asked Questions
1. What is the projected size of the global sports trading cards market by 2033?
Our proprietary research indicates the market will reach USD 28.47 Billion by 2033, expanding at a CAGR of 10.8% from 2024 levels.
2. Which region is expected to contribute most to market growth?
Europe is forecast to contribute 47.1% of incremental growth during the forecast period, driven by association football (soccer) collector culture.
3. What are the key drivers of the sports trading cards market?
The convergence of nostalgia and the recognition of cards as alternative assets are primary drivers, alongside digital innovation via NFTs and blockchain.
4. Who are the leading companies in the sports trading cards industry?
Key players include Panini Group, Topps (Fanatics), Upper Deck, Dapper Labs, and eBay, each dominating specific segments of the value chain.
5. What is the fastest-growing application segment in the market?
Association football (soccer) is the fastest-growing application segment, outpacing the overall market by over 400 basis points, fueled by global fandom.
11.1.9.2. Products
11.1.9.3. Company Financials
11.1.9.4. SWOT Analysis
11.1.10. VeeFriends
11.1.10.1. Company Overview
11.1.10.2. Products
11.1.10.3. Company Financials
11.1.10.4. SWOT Analysis
11.2. Market Entropy
11.2.1. Company's Key Areas Served
11.2.2. Recent Developments
11.3. Company Market Share Analysis, 2026
11.3.1. Top 5 Companies Market Share Analysis
11.3.2. Top 3 Companies Market Share Analysis
11.4. List of Potential Customers
Figure 16: Europe Sports Trading Cards Market Report Revenue (Billion), by Application 2026 & 2034
Figure 17: Europe Sports Trading Cards Market Report Revenue Share (%), by Application 2026 & 2034
Figure 18: Europe Sports Trading Cards Market Report Revenue (Billion), by Distribution Channel 2026 & 2034
Figure 19: Europe Sports Trading Cards Market Report Revenue Share (%), by Distribution Channel 2026 & 2034
Figure 20: Europe Sports Trading Cards Market Report Revenue (Billion), by Country 2026 & 2034
Figure 21: Europe Sports Trading Cards Market Report Revenue Share (%), by Country 2026 & 2034
Figure 22: Asia-Pacific Sports Trading Cards Market Report Revenue (Billion), by Product Type 2026 & 2034
Figure 23: Asia-Pacific Sports Trading Cards Market Report Revenue Share (%), by Product Type 2026 & 2034
Figure 24: Asia-Pacific Sports Trading Cards Market Report Revenue (Billion), by Card Type 2026 & 2034
Figure 25: Asia-Pacific Sports Trading Cards Market Report Revenue Share (%), by Card Type 2026 & 2034