Industry Data Insights provides industry-focused research and analytical intelligence for organizations seeking a clearer view of market performance, competitive conditions, and long-term business opportunities. Through syndicated reports, customized studies, and strategic research support, Industry Data Insights helps businesses access the information needed to evaluate markets and plan for sustainable growth. Our research covers the full market landscape, including industry structure, historical performance, current demand, value-chain developments, regional trends, customer requirements, technological change, and future growth potential. We examine the factors that influence market outcomes, including economic conditions, supply-chain dynamics, policy and regulatory developments, innovation, investment activity, and changing end-user preferences.
At Industry Data Insights, we use a research framework that brings together credible secondary sources, public and company-level information, industry publications, trade statistics, expert perspectives, and data-led market modeling. Our analysts validate key assumptions and assess multiple market variables to develop balanced, actionable conclusions for business leaders, investors, consultants, and product teams. Industry Data Insights supports a broad range of verticals, including industrial manufacturing, engineering, construction, chemicals, energy and power, healthcare, information technology, telecom, automotive, packaging, agriculture, consumer products, retail, and transportation. Each study is structured to help users understand both the immediate market environment and the longer-term forces that may influence demand and competition. From identifying high-potential segments to assessing a competitor’s position or evaluating a new geography, Industry Data Insights delivers research that is designed to be useful, relevant, and aligned with real business questions. Our goal is to turn industry data into strategic direction.
Outdoor Fabric Market Size, Share & Forecast to 2030
Outdoor Fabric Market by Material (Polyester, Acrylic, Olefin, Vinyl, Nylon, Natural Fibers), by Application (Awnings, Canopies, Umbrellas, Patio Furniture, Cushions, Boating, Tents), by Characteristic (Waterproof, UV-Resistant, Fade-Resistant, Breathable, Stain-Resistant, Fire-Resistant), by End-Use (Residential, Commercial, Hospitality, Industrial, Marine, Defense), by Asia Pacific (China, India, Japan, South Korea, Australia), by North America (USA, Canada, Mexico), by Europe (Germany, UK, France, Italy, Spain), by Latin America (Brazil, Argentina, Colombia), by Middle East & Africa (Saudi Arabia, UAE, South Africa) Forecast 2026-2034
Outdoor Fabric Market Size, Share & Forecast to 2030
Discover the Latest Market Insight Reports
Access in-depth insights on industries, companies, trends, and global markets. Our expertly curated reports provide the most relevant data and analysis in a condensed, easy-to-read format.
Divergence flagged: published estimates range from 1.47% to 5.3% CAGR — definitions, not demand, explain most of the gap.
Why this matters for decision-makers: vendors must pivot toward UV-resistant, recyclable polyester blends to avoid margin compression as acrylic premiums erode.
Outdoor Fabric Market Market Size (In Billion)
20.0B
15.0B
10.0B
5.0B
0
13.41 B
2024
14.01 B
2025
14.64 B
2026
15.30 B
2027
15.99 B
2028
16.71 B
2029
17.54 B
2030
Outdoor Fabric Market Market Size (In Billion)
Year
Market Size
2024
13.41 B
2025
14.01 B
2026
14.64 B
2027
15.30 B
2028
15.99 B
2029
16.71 B
2030
17.54 B
What is the Outdoor Fabric Market?
The outdoor fabric market covers engineered textiles — polyester, acrylic, olefin, vinyl, nylon — treated for UV, water and mildew resistance and sold into awnings, canopies, patio furniture, marine covers, tents and shade structures. Value is captured at the mill and brand level, with specification driven by hospitality, residential and infrastructure buyers.
Scope: what this report covers and excludes
Scope is global, covering mill-level and branded outdoor textile production across six material families and seven application groups, segmented by characteristic and end-use. Both woven and coated constructions are in scope. This analysis does not cover indoor upholstery, technical industrial filtration fabrics, geotextiles, or apparel outerwear — adjacent categories with different specification and procurement cycles.
How big is the market for Outdoor Fabric Market?
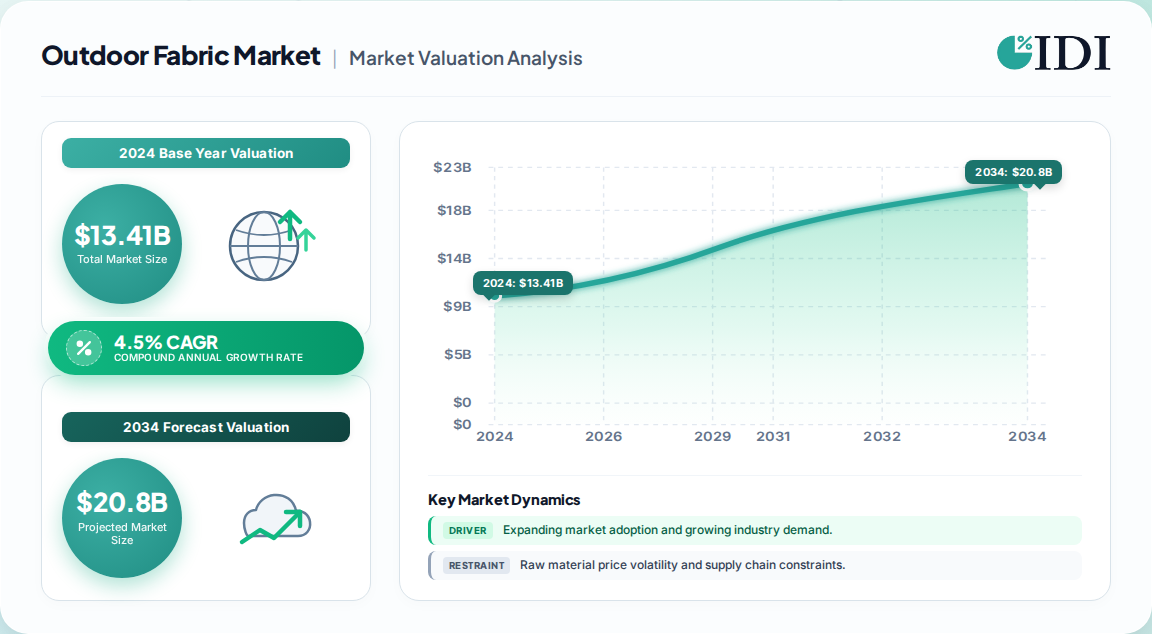
Estimates cluster between USD 13.4 billion and USD 29.4 billion for 2024–2025, but the spread reflects scope definition far more than demand disagreement. The USD 13.4 billion base, growing to USD 17.5 billion by 2030, is the most defensible figure for branded outdoor textiles.
Same core categories, broader materials, longer horizon
A competing analysis
USD 29.41 Billion
2025
2032
5.3%
Includes polymer-coated, fire-resistant and smart textiles across industrial end-uses
A competing analysis
USD 12.81 Billion
2023
2033
4.53%
China only — national market
A competing analysis
Our analysis suggests the USD 29.4 billion figure is an industrial-coated-fabric universe, not the consumer and hospitality outdoor textile category most buyers specify. The 1.47% CAGR estimate appears to use a longer horizon and a broader base, diluting growth. The 4.5% figure sits between these poles and aligns with hospitality capex and urban shade infrastructure.
How is the market segmented?
Segmentation runs along four axes: material, application, performance characteristic and end-use. Material and application drive pricing power; characteristic and end-use drive specification and compliance.
Acrylic leads on revenue (39.7%) because of solution-dyed colorfastness in awnings and marine. Polyester leads on volume and is the fastest-growing material, benefiting from lower cost and recyclability. Patio furniture is the largest application at 42.7%, reflecting hospitality refurbishment cycles.
Which region leads in Outdoor Fabric Market?
Asia Pacific leads with 38.5% revenue share in 2024, driven by China's integrated fiber-to-finish production base and export scale. North America and Europe follow, with demand anchored in premium residential and hospitality specification.
Outdoor Fabric Market Regional Market Share
Loading chart...
Outdoor Fabric Market Regional Market Share
Region
Market Share (%)
Asia Pacific
0.39%
North America
0.24%
Europe
0.22%
Latin America
0.08%
Middle East & Africa
0.08%
Asia Pacific
China
India
Japan
South Korea
Australia
North America
USA
Canada
Mexico
Europe
Germany
UK
France
Italy
Spain
Latin America
Brazil
Argentina
Colombia
Middle East & Africa
Saudi Arabia
UAE
South Africa
China alone was valued at USD 12.81 billion in 2023 on a national basis, growing at 4.53% — a figure that implies definitional overlap with the global total and should be read as a production-and-consumption universe rather than a retail market. Our analysis suggests Asia Pacific's share will hold through 2030, but value growth will migrate toward North America and Europe as specification premiums rise.
What is driving growth — and what is holding it back?
Growth is driven by hospitality capex, urban shade infrastructure and smart-textile innovation; restraints are raw-material volatility, regulatory compliance cost and substitute materials. Net, drivers outweigh restraints through 2030, but margin pressure is real.
Factor
Direction
Evidence strength
Mechanism
Hospitality and tourism capex
Driver
High
Resort, restaurant and poolside refurbishment cycles
Urbanization and public shade infrastructure
Driver
High
Parks, transit, mixed-use outdoor seating
Smart textiles and coatings
Driver
Medium
Temperature regulation, self-cleaning, nano-coatings
Sustainability regulation
Driver / restraint
High
Recycled content mandates raise cost but open premium tiers
Raw-material price volatility
Restraint
High
Polyester and acrylic feedstock swings compress margins
This divergence implies buyers should hedge material exposure through dual-source contracts. Vendors that lock recycled feedstock early capture the sustainability premium before compliance costs normalize.
Who are the leading vendors?
Glen Raven (Sunbrella) leads on brand and specification pull, with Serge Ferrari and Sattler strong in architectural and marine technical fabrics. Differentiation rests on warranties, colorfastness and distribution breadth rather than raw capacity.
Company
HQ
Core strength
Moat
Glen Raven / Sunbrella
USA
Branded acrylic, residential and hospitality
Brand specification, warranty
Serge Ferrari
France
Architectural tensioned membranes
Technical composite IP
Sattler
Austria
Marine and shade fabrics
European distribution
Outdura
USA
Solution-dyed acrylic
Cost-positioned acrylic
Dickson Constant
France
Sun protection and technical textiles
Coating technology
Sauleda
Spain
Printed and designer outdoor fabric
Customization
The market is moderately concentrated. Moats are built on warranty-backed performance claims and installer relationships, not patents alone. Digital printing has lowered entry barriers in design-led niches, intensifying competition at the premium margin.
What do buyers and operators need to know?
Selection hinges on four criteria: UV and fade performance under warranty, fire-retardancy compliance for commercial and public installations, cleanability and mold resistance, and recycled content for ESG reporting. Buyers should demand test data against recognized standards, not marketing claims.
Procurement risk concentrates in single-source acrylic supply and in lead-time volatility during hospitality peak seasons. Switching costs are moderate — re-specification requires recertification and installer retraining — so buyers should negotiate multi-year frameworks. Regulatory exposure is rising: flame-retardancy and chemical restrictions in Europe and North America are tightening, and non-compliant fabric can trigger project delays. Operators should build compliance documentation into tender requirements from day one.
Strategic Recommendations & Analyst Perspective
The balance of evidence favors a 4.5% CAGR through 2030, with the higher 5.3% figure overstating growth by conflating industrial coated fabrics with outdoor textiles. The strongest counter-argument is that smart-textile adoption could accelerate replacement cycles faster than baseline modeling assumes — plausible, but not yet visible in volume data. Our position: plan on 4.5%, and treat upside as option value.
For investors, the strategic signal is margin migration, not volume growth. Acrylic's 39.7% share is defended by colorfastness, but polyester's 4.8% growth and recyclability make it the volume engine of the next cycle. Vendors that fail to build polyester capacity and recycled feedstock access will face pricing pressure from Asian producers by 2028.
Investors: prioritize vendors with recycled-content certification and hospitality contract books over pure capacity plays.
Operators: lock multi-year supply agreements with dual material sourcing to hedge acrylic and polyester feedstock swings.
Vendors: invest in UV-resistant polyester blends and digital-print customization to defend premium tiers against low-cost imports.
What would change our conclusion: a sustained shift in hospitality capex toward permanent shade structures, or regulatory mandates on recycled content above 50%, would push CAGR toward 5.3% and reweight value toward Europe and North America. Precise sub-segment forecasting by characteristic and end-use requires the full report's granular dataset.
Outdoor Fabric Market Regional Market Share
Higher Coverage
Lower Coverage
No Coverage
Outdoor Fabric Market REPORT HIGHLIGHTS
Research Methodology & Data Sources
Our rigorous research methodology combines multi-layered approaches with comprehensive quality assurance, ensuring precision, accuracy, and reliability in every market analysis.
Primary Research & Industry Fieldwork
This study applies a 70/30 primary-to-secondary research split. In-depth interviews were conducted with decision-makers across the value chain, spanning solution-dyed fiber producers, specialty outdoor textile mills, coating and finishing formulators, and global distributors. Interview targets included VP-level Sourcing leads, Heads of R&D, Technical Directors, and Commercial Operations Leads, ensuring both performance-specification and procurement dynamics were captured.
Key Stakeholders Interviewed
Key Stakeholders Interviewed
Stakeholder Role
Interview Share (%)
Procurement & Sourcing Leads
35%
R&D & Technical Directors
30%
Commercial Operations Leads
20%
Quality & Compliance Managers
15%
Industry Ecosystem Breakdown
Industry Ecosystem Breakdown
Company Type
Representation (%)
Fiber & Yarn Producers
35%
Specialty Outdoor Textile Mills
40%
Coating & Finishing Formulators
15%
Global Distributors & Traders
10%
Secondary Benchmarking & Public Trade Validation
Findings were cross-checked against UN Comtrade and US ITC trade flows, Eurostat textile trade statistics, corporate 10-K and annual investor filings, patent databases, and recognized technical standards from ISO and industry associations. No third-party market-research publisher data was used for validation.
Demand Modeling & Market Sizing Triangulation
Market sizing was triangulated through simultaneous Top-Down allocation (macroeconomic output, construction and hospitality capex, segment revenue pools) and Bottom-Up modeling (manufacturer capacity, product pricing, end-use consumption). Discrepancies were reconciled at the segment level to produce a single defensible base-year value.
Table 5: Outdoor Fabric Market Revenue Billion Forecast, by Region 2020 & 2034
Table 6: Asia Pacific Outdoor Fabric Market Revenue Billion Forecast, by Material 2020 & 2034
Table 7: Asia Pacific Outdoor Fabric Market Revenue Billion Forecast, by Application 2020 & 2034
Table 8: Asia Pacific Outdoor Fabric Market Revenue Billion Forecast, by Characteristic 2020 & 2034
Table 9: Asia Pacific Outdoor Fabric Market Revenue Billion Forecast, by End-Use 2020 & 2034
Table 10: Asia Pacific Outdoor Fabric Market Revenue Billion Forecast, by Country 2020 & 2034
Table 11: China Outdoor Fabric Market Revenue (Billion) Forecast, by Application 2020 & 2034
Table 12: India Outdoor Fabric Market Revenue (Billion) Forecast, by Application 2020 & 2034
Table 13: Japan Outdoor Fabric Market Revenue (Billion) Forecast, by Application 2020 & 2034
Table 14: South Korea Outdoor Fabric Market Revenue (Billion) Forecast, by Application 2020 & 2034
Table 15: Australia Outdoor Fabric Market Revenue (Billion) Forecast, by Application 2020 & 2034
Table 16: North America Outdoor Fabric Market Revenue Billion Forecast, by Material 2020 & 2034
Frequently Asked Questions
1. How big is the outdoor fabric market?
The global outdoor fabric market was valued at USD 13.41 billion in 2024 and is projected to reach USD 17.54 billion by 2030, growing at a 4.5% CAGR. Broader industrial-coated-fabric definitions produce higher figures up to USD 29 billion.
2. Which region leads the outdoor fabric market?
Asia Pacific leads with 38.5% revenue share in 2024, driven by China's integrated fiber-to-finish production and export scale. North America and Europe follow, anchored in premium hospitality and residential specification.
3. What is the fastest-growing outdoor fabric material?
Polyester is the fastest-growing material at 4.8% CAGR, benefiting from lower cost, lightweight handling and recyclability. Acrylic remains the largest segment at 39.7% share on colorfastness and marine performance.
4. Who are the leading outdoor fabric companies?
Glen Raven (Sunbrella), Serge Ferrari, Sattler, Outdura, Dickson Constant and Sauleda lead the market. Differentiation rests on warranty-backed performance, colorfastness and installer distribution rather than raw capacity alone.
5. What is driving outdoor fabric market growth?
Hospitality and tourism capex, urban shade infrastructure, smart-textile innovation and sustainability regulation drive growth. Raw-material volatility and substitute materials restrain it, but drivers outweigh restraints through 2030.
Figure 17:
Figure 18: North America Outdoor Fabric Market Revenue (Billion), by End-Use 2026 & 2034
Figure 19: North America Outdoor Fabric Market Revenue Share (%), by End-Use 2026 & 2034
Figure 20: North America Outdoor Fabric Market Revenue (Billion), by Country 2026 & 2034
Figure 21: North America Outdoor Fabric Market Revenue Share (%), by Country 2026 & 2034
Figure 22: Europe Outdoor Fabric Market Revenue (Billion), by Material 2026 & 2034
Figure 23: Europe Outdoor Fabric Market Revenue Share (%), by Material 2026 & 2034
Figure 24: Europe Outdoor Fabric Market Revenue (Billion), by Application 2026 & 2034
Figure 25: Europe Outdoor Fabric Market Revenue Share (%), by Application 2026 & 2034
Figure 26: Europe Outdoor Fabric Market Revenue (Billion), by Characteristic 2026 & 2034
Figure 27: Europe Outdoor Fabric Market Revenue Share (%), by Characteristic 2026 & 2034
Figure 28: Europe Outdoor Fabric Market Revenue (Billion), by End-Use 2026 & 2034
Figure 29: Europe Outdoor Fabric Market Revenue Share (%), by End-Use 2026 & 2034
Figure 30: Europe Outdoor Fabric Market Revenue (Billion), by Country 2026 & 2034
Figure 31: Europe Outdoor Fabric Market Revenue Share (%), by Country 2026 & 2034
Figure 32: Latin America Outdoor Fabric Market Revenue (Billion), by Material 2026 & 2034
Figure 33: Latin America Outdoor Fabric Market Revenue Share (%), by Material 2026 & 2034
Figure 34: Latin America Outdoor Fabric Market Revenue (Billion), by Application 2026 & 2034
Figure 35: Latin America Outdoor Fabric Market Revenue Share (%), by Application 2026 & 2034
Figure 36: Latin America Outdoor Fabric Market Revenue (Billion), by Characteristic 2026 & 2034
Figure 37: Latin America Outdoor Fabric Market Revenue Share (%), by Characteristic 2026 & 2034
Figure 38: Latin America Outdoor Fabric Market Revenue (Billion), by End-Use 2026 & 2034
Figure 39: Latin America Outdoor Fabric Market Revenue Share (%), by End-Use 2026 & 2034
Figure 40: Latin America Outdoor Fabric Market Revenue (Billion), by Country 2026 & 2034
Figure 41: Latin America Outdoor Fabric Market Revenue Share (%), by Country 2026 & 2034
Figure 42: Middle East & Africa Outdoor Fabric Market Revenue (Billion), by Material 2026 & 2034
Figure 43: Middle East & Africa Outdoor Fabric Market Revenue Share (%), by Material 2026 & 2034
Figure 44: Middle East & Africa Outdoor Fabric Market Revenue (Billion), by Application 2026 & 2034
Figure 45: Middle East & Africa Outdoor Fabric Market Revenue Share (%), by Application 2026 & 2034
Figure 46: Middle East & Africa Outdoor Fabric Market Revenue (Billion), by Characteristic 2026 & 2034
Figure 47: Middle East & Africa Outdoor Fabric Market Revenue Share (%), by Characteristic 2026 & 2034
Figure 48: Middle East & Africa Outdoor Fabric Market Revenue (Billion), by End-Use 2026 & 2034
Figure 49: Middle East & Africa Outdoor Fabric Market Revenue Share (%), by End-Use 2026 & 2034
Figure 50: Middle East & Africa Outdoor Fabric Market Revenue (Billion), by Country 2026 & 2034
Figure 51: Middle East & Africa Outdoor Fabric Market Revenue Share (%), by Country 2026 & 2034
Table 17: North America Outdoor Fabric Market Revenue Billion Forecast, by Application 2020 & 2034
Table 18: North America Outdoor Fabric Market Revenue Billion Forecast, by Characteristic 2020 & 2034
Table 19: North America Outdoor Fabric Market Revenue Billion Forecast, by End-Use 2020 & 2034
Table 20: North America Outdoor Fabric Market Revenue Billion Forecast, by Country 2020 & 2034
Table 21: USA Outdoor Fabric Market Revenue (Billion) Forecast, by Application 2020 & 2034