Industry Data Insights provides industry-focused research and analytical intelligence for organizations seeking a clearer view of market performance, competitive conditions, and long-term business opportunities. Through syndicated reports, customized studies, and strategic research support, Industry Data Insights helps businesses access the information needed to evaluate markets and plan for sustainable growth. Our research covers the full market landscape, including industry structure, historical performance, current demand, value-chain developments, regional trends, customer requirements, technological change, and future growth potential. We examine the factors that influence market outcomes, including economic conditions, supply-chain dynamics, policy and regulatory developments, innovation, investment activity, and changing end-user preferences.
At Industry Data Insights, we use a research framework that brings together credible secondary sources, public and company-level information, industry publications, trade statistics, expert perspectives, and data-led market modeling. Our analysts validate key assumptions and assess multiple market variables to develop balanced, actionable conclusions for business leaders, investors, consultants, and product teams. Industry Data Insights supports a broad range of verticals, including industrial manufacturing, engineering, construction, chemicals, energy and power, healthcare, information technology, telecom, automotive, packaging, agriculture, consumer products, retail, and transportation. Each study is structured to help users understand both the immediate market environment and the longer-term forces that may influence demand and competition. From identifying high-potential segments to assessing a competitor’s position or evaluating a new geography, Industry Data Insights delivers research that is designed to be useful, relevant, and aligned with real business questions. Our goal is to turn industry data into strategic direction.
Middle East Food Service Equipment Market Report 2026
Middle East Food Service Equipment Market Report by Type (Cooking Equipment, Storage & Handling Equipment, Warewashing Equipment, Food & Beverage Preparation Equipment, Serving & Holding Equipment), by End Use (Full-Service Restaurants & Hotels, Quick-Service Restaurants & Pubs, Catering, Institutional & Cloud Kitchens), by Sales Channel (Offline Dealers & Distributors, Online B2B Procurement), by Middle East (Saudi Arabia, UAE, Qatar, Kuwait, Oman, Bahrain, Jordan, Lebanon, Iraq, Iran) Forecast 2026-2034
Middle East Food Service Equipment Market Report 2026
Discover the Latest Market Insight Reports
Access in-depth insights on industries, companies, trends, and global markets. Our expertly curated reports provide the most relevant data and analysis in a condensed, easy-to-read format.
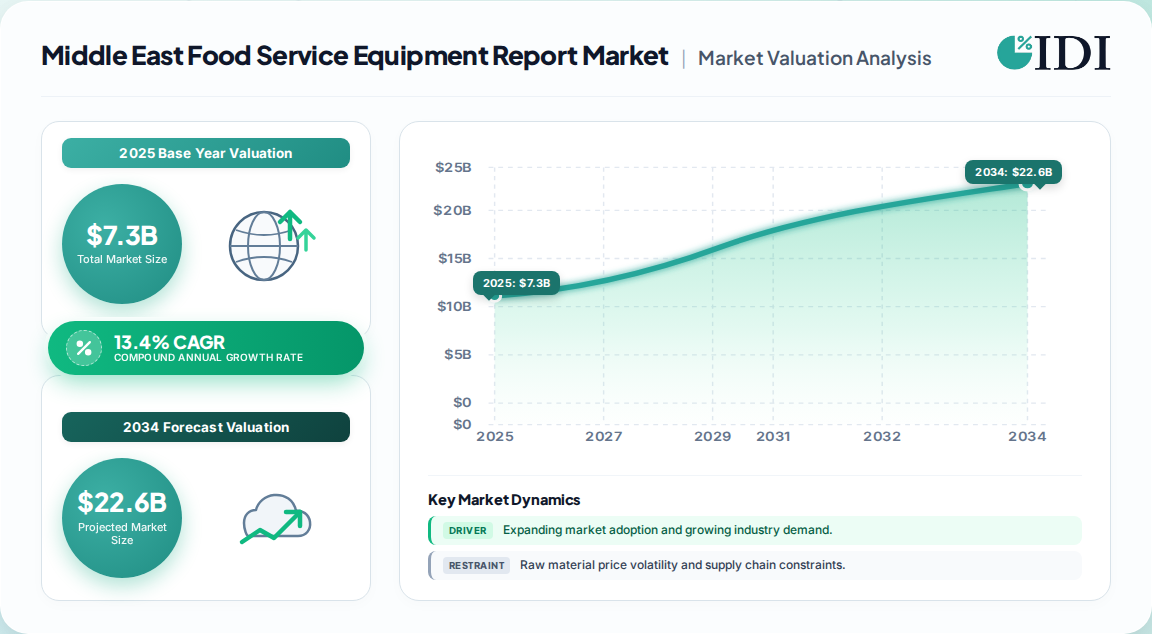
7.3 Billion — Middle East food service equipment market size in 2025, per the most widely cited regional estimate.
20.0 Billion — projected value by 2033, implying roughly 2.7x expansion over the eight-year window.
13.4% — stated CAGR for 2026–2033, more than double the global benchmark of ~7.0%.
Cooking equipment leads by type, while warewashing and storage are the fastest-growing functional categories.
Saudi Arabia and the UAE together account for an estimated 59% of regional revenue, anchored by giga-project hospitality pipelines.
Ali Group, Middleby, Welbilt, Electrolux Professional and Hoshizaki are the reference competitive set across the region.
Why this matters for decision-makers: The Middle East is not a volume play — it is a specification play. Vendors that cannot document energy performance, GCC conformity and service SLAs will be excluded from tender shortlists regardless of price.
Middle East Food Service Equipment Market Report Market Size (In Billion)
20.0B
15.0B
10.0B
5.0B
0
7.300 B
2025
8.280 B
2026
9.390 B
2027
10.65 B
2028
12.08 B
2029
13.70 B
2030
15.54 B
2031
Middle East Food Service Equipment Market Report Market Size (In Billion)
Year
Market Size
2025
7.300 B
2026
8.280 B
2027
9.390 B
2028
10.65 B
2029
12.08 B
2030
13.70 B
2031
15.54 B
What is the Middle East Food Service Equipment Market Report?
The Middle East Food Service Equipment Market Report is a decision-support study of commercial kitchen hardware demand across GCC and Levant markets — cooking, refrigeration, warewashing, food preparation and serving equipment — sized by type, end use and sales channel, with vendor benchmarking and 2026–2033 forecasts.
Scope: what this report covers and excludes
This study covers commercial food service equipment sold into hotels, full-service and quick-service restaurants, catering operations, institutional kitchens and cloud kitchens across the Middle East, spanning GCC states, Levant markets and Iran. Both offline dealer channels and emerging online procurement are included. This analysis does not cover household appliances, vending machines, food processing plant machinery, commercial refrigeration for retail grocery, or HVAC and building services.
How big is the market for Middle East Food Service Equipment Market Report?
One published regional estimate puts the Middle East market at USD 7.3 billion in 2025, rising to USD 20.0 billion by 2033 at 13.4% CAGR. Global benchmarks from competing analyses cluster around USD 41–44 billion in 2025 at 4.1–7.0% growth, implying the Middle East represents roughly 16–18% of global value on a high-growth trajectory.
Estimate
Base year
Horizon
CAGR
Definition / scope
Attribution
USD 7.3 Billion
2025
2033
13.4%
Middle East commercial food service equipment, all channels
One published regional estimate
USD 41.5 Billion
2025
2033
7.0%
Global food service equipment, all end uses
One global industry analysis
USD 41.9 Billion
2025
2034
4.14%
Global food service equipment, product-type segmentation
A competing global analysis
USD 41.2 Billion
2025
2035
4.92%
Global food service equipment, application-led segmentation
A third global benchmark
Our analysis suggests the 13.4% regional CAGR is defensible only if giga-project hospitality openings stay on schedule. The three global estimates diverge by 2.9 percentage points on CAGR alone — a spread that reflects segmentation differences rather than genuine disagreement about demand. Buyers should treat the regional figure as a directional ceiling and stress-test capex plans against a 9–10% base case.
How is the market segmented?
Segmentation follows three non-geographic axes: equipment type, end-use vertical and sales channel. Type is the primary axis because specification and replacement cycles differ sharply between cooking and warewashing assets.
Cooking equipment dominates value because it is the highest-ticket, highest-specification category in every kitchen build. Warewashing and storage are growing faster in percentage terms, driven by hygiene regulation and delivery-led formats. Offline channels still carry the majority of volume, as buyers of large capital equipment prefer physical inspection and installation support.
Which Middle East sub-region leads in Middle East Food Service Equipment Market Report?
Saudi Arabia leads the Middle East food service equipment market, followed by the UAE. Together they concentrate the region's hospitality capex, with Saudi giga-projects and Dubai's hotel and F&B pipeline driving the majority of new kitchen builds and replacement demand.
Middle East Food Service Equipment Market Report Regional Market Share
Loading chart...
Middle East Food Service Equipment Market Report Regional Market Share
Region
Market Share (%)
Saudi Arabia
0.32%
UAE
0.27%
Qatar
0.11%
Kuwait
0.09%
Oman
0.08%
Bahrain
0.06%
Rest of Middle East
0.07%
Geography
Share of regional value (estimated)
Saudi Arabia
32%
UAE
27%
Qatar
11%
Kuwait
9%
Oman
8%
Bahrain
6%
Rest of Middle East
7%
Saudi Arabia — Riyadh, Jeddah, NEOM, Red Sea coast
UAE — Dubai, Abu Dhabi, Sharjah
Qatar — Doha
Kuwait — Kuwait City
Oman — Muscat, Duqm
Bahrain — Manama
Rest of Middle East — Jordan, Lebanon, Iraq, Iran
This concentration implies two distinct go-to-market motions. In Saudi Arabia, vendors must align with giga-project master specifications and local-content expectations. In the UAE, the buying centre is more fragmented and replacement-led, rewarding dealers with strong after-sales networks. Our analysis suggests Qatar and Kuwait will see the sharpest percentage acceleration through 2028 as hotel pipelines mature.
What is driving growth — and what is holding it back?
Growth is driven primarily by hospitality and tourism capex, giga-project kitchen builds and mandatory hygiene and energy standards. Restraints are high upfront capital cost, technician scarcity and fragmented after-sales coverage outside major cities.
Factor
Direction
Evidence strength
Mechanism
Hospitality and tourism expansion
Driver
High
New hotel and F&B openings require full kitchen fit-outs
Giga-projects and stadium-led development
Driver
High
Multi-year procurement pipelines for institutional kitchens
Hygiene and food-safety regulation
Driver
Medium-High
Forces replacement of non-compliant warewashing and storage
Labour shortages
Driver
Medium
Pushes demand for automated, multifunctional equipment
High initial capital outlay
Restraint
High
Delays replacement cycles among SME operators
Technical skills gap
Restraint
Medium
Limits adoption of IoT-enabled and automated systems
Raw material and freight volatility
Restraint
Medium
Inflates landed cost and extends lead times
The balance favours growth, but not evenly. Large institutional buyers absorb capital cost comfortably and are regulatory-driven; SME operators are price-elastic and defer upgrades. Vendors therefore face a bifurcated market — premium specification-led tenders at one end, and price-sensitive replacement demand at the other.
Who are the leading vendors?
The competitive field is led by global equipment groups with regional dealer networks, competing mainly on specification breadth, energy performance and service coverage rather than on price.
Company
Primary strength
Regional positioning
Ali Group
Broad cooking and warewashing portfolio
Strong through dealer partnerships
The Middleby Corporation
Cooking innovation and connectivity
Premium hotel and QSR specifications
Welbilt
Full-line commercial kitchen systems
Institutional and chain accounts
Electrolux Professional
Energy efficiency and laundry-to-kitchen range
Sustainability-led tenders
Hoshizaki
Ice and refrigeration specialisation
High reliability reputation
ITW (Illinois Tool Works)
Food preparation and warewashing components
Embedded in OEM and dealer chains
Differentiation rests on three moats: certified energy performance, GCC-wide service and spare-parts coverage, and the ability to hold a specification through a multi-year giga-project tender. Regional manufacturers compete on price and delivery speed, but rarely on documentation depth — which is precisely where global vendors win shortlisting battles.
What do buyers and operators need to know? (Decision Support)
Selection criteria in the Middle East are dominated by total cost of ownership, not headline price. Buyers should score vendors on energy consumption per cover, mean time to repair, spare-parts availability within 48 hours, and documented conformity to GCC and international safety standards. Equipment that saves 15% on energy can justify a 20% price premium across a five-year cycle.
Procurement risk concentrates in three areas. First, freight and customs lead times — specify realistic delivery windows and liquidated damages. Second, installation quality — require factory-certified commissioning, not dealer improvisation. Third, service coverage — demand named technicians and defined response SLAs in remote project locations, where the nearest qualified engineer may be hours away.
Switching costs rise sharply after commissioning, because menus, staff training and maintenance contracts are built around installed equipment. This lock-in favours incumbents but penalises buyers who under-specify at the outset. A structured scoring matrix applied before tender issuance is the single highest-return procurement action.
Strategic Recommendations & Analyst Perspective
The balance of evidence favours a bullish regional position, but with an important qualification. The 13.4% regional CAGR is credible as a ceiling; our base case is 9–10%, reflecting realistic project phasing rather than optimistic pipeline assumptions. The strongest counter-argument is that giga-project hospitality spend could slip by 12–24 months, pulling forward demand into a later window and depressing near-term equipment orders.
That risk is manageable if vendors build pipeline visibility rather than capacity certainty. The more durable opportunity lies in the replacement and service market, which is under-served outside Dubai, Riyadh and Doha. Operators increasingly value uptime over initial price, and a vendor who can guarantee two-hour response in secondary cities will capture share even against lower-cost competitors.
Actionable strategy for investors and operators:
Prioritise specification-led tenders — build documentation and certification capability before chasing volume, because documentation is the gatekeeper in institutional procurement.
Invest in regional service infrastructure — technician density and spare-parts depots are the strongest defensible moat in this geography.
Target secondary cities — Jeddah, Dammam, Duqm and Muscat are under-served relative to project pipeline growth.
What would change our conclusion: a sustained fall in oil-linked government capex, or a regulatory shift toward regional content requirements that excludes imported equipment, would materially reduce the growth outlook and favour local manufacturing partnerships.
Research Methodology
Primary Research & Industry Fieldwork
Our analysis applies a 70/30 primary-to-secondary research split. In-depth interviews were conducted with raw-material and component suppliers, specialised equipment producers, system integrators and regional distributors across GCC markets. Interviewed decision-makers included VP-level Sourcing Leads, Heads of R&D, Technical Directors and Commercial Operations Leads, each screened for direct procurement authority.
Secondary Benchmarking & Public Trade Validation
We validate demand against UN Comtrade and WTO trade flow data, national customs statistics, corporate annual filings and investor presentations, and patent databases. Technical standards and conformity requirements are cross-checked against recognised industry associations and multilateral standards bodies.
Demand Modeling & Market Sizing Triangulation
Top-down macroeconomic and hospitality-capex allocation is run simultaneously with bottom-up manufacturer capacity, pricing and end-use consumption modelling. Divergences between the two approaches are resolved through expert consultation rather than averaging.
UN Comtrade — bilateral trade statistics for commercial kitchen equipment
WTO — tariff and trade facilitation data for GCC imports
GCC Standardization Organization (GSO) — conformity and safety standards
National statistics authorities and central bank hospitality capex disclosures
Middle East Food Service Equipment Market Report Regional Market Share
Higher Coverage
Lower Coverage
No Coverage
Middle East Food Service Equipment Market Report REPORT HIGHLIGHTS
Research Methodology & Data Sources
Our rigorous research methodology combines multi-layered approaches with comprehensive quality assurance, ensuring precision, accuracy, and reliability in every market analysis.
Primary Research & Industry Fieldwork
Our analysis applies a 70/30 primary-to-secondary research split. In-depth interviews were conducted with raw-material and component suppliers, specialised equipment producers, system integrators and regional distributors across GCC markets. Interviewed decision-makers included VP-level Sourcing Leads, Heads of R&D, Technical Directors and Commercial Operations Leads, each screened for direct procurement authority.
Key Stakeholders Interviewed
Key Stakeholders Interviewed
Stakeholder Role
Interview Share (%)
Procurement & Sourcing Directors
40%
Technical & Engineering Leads
30%
Commercial & Operations Managers
20%
Quality & Compliance Officers
10%
Industry Ecosystem Breakdown
Industry Ecosystem Breakdown
Company Type
Representation (%)
Equipment Manufacturers
45%
Regional Distributors & Dealers
30%
Component & Raw Material Suppliers
15%
Hospitality Operators & F&B Chains
10%
Secondary Benchmarking & Public Trade Validation
We validate demand against UN Comtrade and WTO trade flow data, national customs statistics, corporate annual filings and investor presentations, and patent databases. Technical standards and conformity requirements are cross-checked against recognised industry associations and multilateral standards bodies.
Demand Modeling & Market Sizing Triangulation
Top-down macroeconomic and hospitality-capex allocation is run simultaneously with bottom-up manufacturer capacity, pricing and end-use consumption modelling. Divergences between the two approaches are resolved through expert consultation rather than averaging.
UN Comtrade — bilateral trade statistics for commercial kitchen equipment
WTO — tariff and trade facilitation data for GCC imports
GCC Standardization Organization (GSO) — conformity and safety standards
National statistics authorities and central bank hospitality capex disclosures
Aspects
Details
Study Period
2020-2034
Base Year
2025
Estimated Year
2026
Forecast Period
2026-2034
Historical Period
2020-2025
Growth Rate
CAGR of 13.4% from 2020-2034
Segmentation
By Type
Cooking Equipment
Storage & Handling Equipment
Warewashing Equipment
Food & Beverage Preparation Equipment
Serving & Holding Equipment
By End Use
Full-Service Restaurants & Hotels
Quick-Service Restaurants & Pubs
Catering
Institutional & Cloud Kitchens
By Sales Channel
Offline Dealers & Distributors
Online B2B Procurement
By Geography
Middle East
Saudi Arabia
UAE
Qatar
Kuwait
Oman
Bahrain
Jordan
Lebanon
Iraq
Iran
Table of Contents
1. Middle East Food Service Equipment Market Report Introduction
1.1. Research Scope
1.2. Market Segmentation
1.3. Research Objective
1.4. Definitions and Assumptions
2. Middle East Food Service Equipment Market Report Executive Summary
2.1. Market Snapshot
3. Middle East Food Service Equipment Market Report Dynamics
3.1. Introduction
3.2. Market Drivers
3.3. Market Restrains
3.4. Market Trends
4. Middle East Food Service Equipment Market Report Factor Analysis
4.1. Porters Five Forces
4.1.1. Bargaining Power of Suppliers
4.1.2. Bargaining Power of Buyers
4.1.3. Threat of New Entrants
4.1.4. Threat of Substitutes
4.1.5. Competitive Rivalry
4.2. PESTEL analysis
4.3. BCG Analysis
4.3.1. Stars (High Growth, High Market Share)
4.3.2. Cash Cows (Low Growth, High Market Share)
4.3.3. Question Mark (High Growth, Low Market Share)
4.3.4. Dogs (Low Growth, Low Market Share)
4.4. Ansoff Matrix Analysis
4.5. Supply Chain Analysis
4.6. Regulatory Landscape
4.7. Current Market Potential and Opportunity Assessment (TAM–SAM–SOM Framework)
4.8. IDI Analyst Note
5. Middle East Food Service Equipment Market Report Analysis, Insights and Forecast, 2020-2034
5.1. Analysis, Insights and Forecast - by Type
5.1.1. Cooking Equipment
5.1.2. Storage & Handling Equipment
5.1.3. Warewashing Equipment
5.1.4. Food & Beverage Preparation Equipment
5.1.5. Serving & Holding Equipment
5.2. Analysis, Insights and Forecast - by End Use
5.2.1. Full-Service Restaurants & Hotels
5.2.2. Quick-Service Restaurants & Pubs
5.2.3. Catering
5.2.4. Institutional & Cloud Kitchens
5.3. Analysis, Insights and Forecast - by Sales Channel
5.3.1. Offline Dealers & Distributors
5.3.2. Online B2B Procurement
5.4. Analysis, Insights and Forecast - by Region
5.4.1. Middle East
6. Middle East Food Service Equipment Market Report Competitive Analysis
6.1. Company Profiles
6.2. Market Entropy
6.2.1. Company's Key Areas Served
6.2.2. Recent Developments
6.3. Company Market Share Analysis, 2026
6.3.1. Top 5 Companies Market Share Analysis
6.3.2. Top 3 Companies Market Share Analysis
6.4. List of Potential Customers
7. Middle East Food Service Equipment Market Report Research Methodology
List of Figures
Figure 1: Middle East Food Service Equipment Market Report Revenue Breakdown (Billion, %) by Product 2026 & 2034
Figure 2: Middle East Food Service Equipment Market Report Value Share (%), by Type 2026 & 2034
Figure 3: Middle East Food Service Equipment Market Report Value Share (%), by End Use 2026 & 2034
Figure 4: Middle East Food Service Equipment Market Report Value Share (%), by Sales Channel 2026 & 2034
Figure 5: Middle East Food Service Equipment Market Report Share (%) by Company 2026
List of Tables
Table 1: Middle East Food Service Equipment Market Report Revenue Billion Forecast, by Type 2020 & 2034
Table 2: Middle East Food Service Equipment Market Report Revenue Billion Forecast, by End Use 2020 & 2034
Table 3: Middle East Food Service Equipment Market Report Revenue Billion Forecast, by Sales Channel 2020 & 2034
Table 4: Middle East Food Service Equipment Market Report Revenue Billion Forecast, by Region 2020 & 2034
Table 5: Middle East Middle East Food Service Equipment Market Report Revenue Billion Forecast, by Type 2020 & 2034
Table 6: Middle East Middle East Food Service Equipment Market Report Revenue Billion Forecast, by End Use 2020 & 2034
Table 7: Middle East Middle East Food Service Equipment Market Report Revenue Billion Forecast, by Sales Channel 2020 & 2034
Table 8: Middle East Middle East Food Service Equipment Market Report Revenue Billion Forecast, by Country 2020 & 2034
Table 9: Saudi Arabia Middle East Food Service Equipment Market Report Revenue (Billion) Forecast, by Application 2020 & 2034
Table 10: UAE Middle East Food Service Equipment Market Report Revenue (Billion) Forecast, by Application 2020 & 2034
Table 11: Qatar Middle East Food Service Equipment Market Report Revenue (Billion) Forecast, by Application 2020 & 2034
Table 12: Kuwait Middle East Food Service Equipment Market Report Revenue (Billion) Forecast, by Application 2020 & 2034
Table 13: Oman Middle East Food Service Equipment Market Report Revenue (Billion) Forecast, by Application 2020 & 2034
Table 14: Bahrain Middle East Food Service Equipment Market Report Revenue (Billion) Forecast, by Application 2020 & 2034
Jordan Middle East Food Service Equipment Market Report Revenue (Billion) Forecast, by Application 2020 & 2034
Frequently Asked Questions
1. How big is the Middle East food service equipment market?
The Middle East food service equipment market was valued at approximately USD 7.3 billion in 2025 according to the leading regional estimate and is projected to reach USD 20.0 billion by 2033, representing a 13.4% CAGR over the forecast period.
2. Which country leads the Middle East food service equipment market?
Saudi Arabia leads with an estimated 32% share of regional value, followed by the UAE at 27%. Saudi giga-project hospitality pipelines and Dubai's hotel and F&B expansion are the primary demand engines.
3. What is the fastest-growing equipment segment?
Cooking equipment dominates value, but warewashing and food holding and storage are growing fastest. Hygiene regulation and delivery-led kitchen formats are accelerating replacement of compliant warewashing and temperature-controlled storage systems.
4. Which companies lead the regional market?
Ali Group, The Middleby Corporation, Welbilt, Electrolux Professional and Hoshizaki are the reference competitive set. They compete on specification breadth, certified energy performance and GCC-wide service coverage rather than headline price.
5. What are the main barriers to entry in this market?
High upfront capital cost, technician scarcity outside major cities, fragmented after-sales coverage and raw material and freight volatility are the main barriers. Documentation and certification requirements also exclude under-prepared vendors from institutional tenders.
Table 15:
Table 16: Lebanon Middle East Food Service Equipment Market Report Revenue (Billion) Forecast, by Application 2020 & 2034
Table 17: Iraq Middle East Food Service Equipment Market Report Revenue (Billion) Forecast, by Application 2020 & 2034
Table 18: Iran Middle East Food Service Equipment Market Report Revenue (Billion) Forecast, by Application 2020 & 2034