Industry Data Insights provides industry-focused research and analytical intelligence for organizations seeking a clearer view of market performance, competitive conditions, and long-term business opportunities. Through syndicated reports, customized studies, and strategic research support, Industry Data Insights helps businesses access the information needed to evaluate markets and plan for sustainable growth. Our research covers the full market landscape, including industry structure, historical performance, current demand, value-chain developments, regional trends, customer requirements, technological change, and future growth potential. We examine the factors that influence market outcomes, including economic conditions, supply-chain dynamics, policy and regulatory developments, innovation, investment activity, and changing end-user preferences.
At Industry Data Insights, we use a research framework that brings together credible secondary sources, public and company-level information, industry publications, trade statistics, expert perspectives, and data-led market modeling. Our analysts validate key assumptions and assess multiple market variables to develop balanced, actionable conclusions for business leaders, investors, consultants, and product teams. Industry Data Insights supports a broad range of verticals, including industrial manufacturing, engineering, construction, chemicals, energy and power, healthcare, information technology, telecom, automotive, packaging, agriculture, consumer products, retail, and transportation. Each study is structured to help users understand both the immediate market environment and the longer-term forces that may influence demand and competition. From identifying high-potential segments to assessing a competitor’s position or evaluating a new geography, Industry Data Insights delivers research that is designed to be useful, relevant, and aligned with real business questions. Our goal is to turn industry data into strategic direction.
Hairstyling Products Market Report: Global Size & Forecast 2025
Hairstyling Products Market Report: Global Size & Forecast 2025
Hairstyling Products Market Report by Product (Gels & Wax, Pomade, Hair Spray, Mousse, Styling Creams, Serums, Oils), by Ingredient (Organic/Natural, Inorganic/Synthetic), by End User (Male, Female, Unisex), by Distribution (Supermarkets/Hypermarkets, Specialty Stores, Online, Convenience, Salons), by Application (Household/Individual, Commercial/Salon), by Asia Pacific (China, Japan, India, South Korea, Australia), by North America (USA, Canada, Mexico), by Europe (Germany, UK, France, Italy, Spain), by Middle East & Africa (Saudi Arabia, UAE, South Africa), by South America (Brazil, Argentina, Colombia) Forecast 2026-2034
Hairstyling Products Market Report: Global Size & Forecast 2025
Discover the Latest Market Insight Reports
Access in-depth insights on industries, companies, trends, and global markets. Our expertly curated reports provide the most relevant data and analysis in a condensed, easy-to-read format.
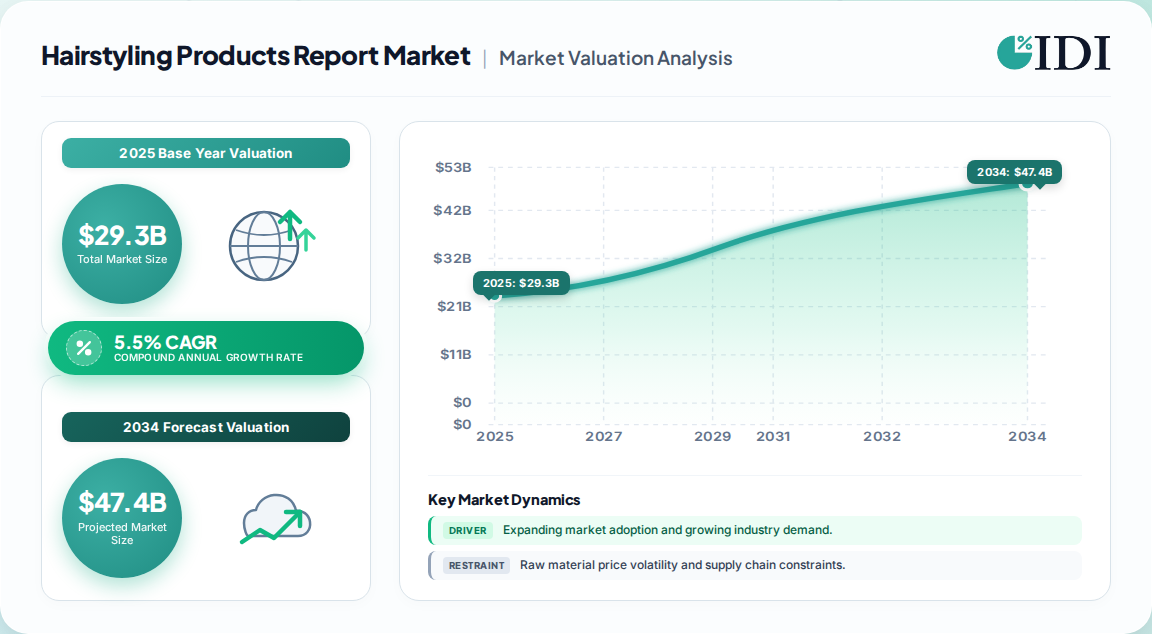
29.3 Billion in 2025, the global hairstyling products market expands at a 5.5% CAGR toward 50.0 Billion by 2035, driven by social commerce and clean-label reformulation.
Gels, waxes and creams hold roughly 45% of category value, but pomades register the fastest product-level growth at around 7.3% annually.
North America leads with about 30% revenue share, while Asia-Pacific is the fastest-growing region, anchored by K-beauty influence and rising urbanization.
Female consumers account for approximately 59% of demand; male grooming is the fastest-accelerating end-use, particularly in the GCC and urban Asia.
L'Oréal, Unilever, Henkel, Kao, Coty, Revlon and Estée Lauder feature among the leading vendors, with private labels gaining ground in mass channels.
Why this matters for decision-makers: Clean-label and halal-certified reformulation is the single largest share-shift lever in 2025-2030, and brands that delay certification risk structural margin compression in premium channels.
Hairstyling Products Market Report Market Size (In Billion)
50.0B
40.0B
30.0B
20.0B
10.0B
0
29.30 B
2025
30.90 B
2026
32.60 B
2027
34.40 B
2028
36.30 B
2029
38.30 B
2030
40.40 B
2031
Hairstyling Products Market Report Market Size (In Billion)
Year
Market Size
2025
29.30 B
2026
30.90 B
2027
32.60 B
2028
34.40 B
2029
36.30 B
2030
38.30 B
2031
40.40 B
What is the Hairstyling Products Market Report?
The hairstyling products market report covers formulated consumer and professional goods—gels, waxes, pomades, mousses, sprays, serums, creams and styling oils—used to shape, hold and finish hair. It quantifies revenue by product, ingredient type, end user, distribution channel and region, providing buyers, operators and investors with sizing, competitive and strategic decision support.
Scope: what this report covers and excludes
This report addresses the global hairstyling products market, defined as finished formulations sold through retail, salon and e-commerce channels for at-home and professional use. Coverage spans product categories, organic versus synthetic formulations, gender-wise end use and all major distribution channels. This analysis does not cover shampoos, conditioners, hair colourants, hair-growth treatments or styling appliances, which are distinct adjacent markets with separate competitive dynamics.
How big is the market for Hairstyling Products Market Report?
The global hairstyling products market is most defensibly sized at 29.3 Billion in 2025, with published estimates ranging from 27.3 Billion to 29.3 Billion depending on base year and scope definition. The dispersion below reflects differences in category inclusion, not demand volatility.
Estimate
Base year
Horizon
CAGR
Definition / scope
Attribution
27.4 Billion
2023
2032
5.7%
Styling products excluding colour
One published estimate
27.3 Billion
2023
2030
5.8%
Includes pomade, spray, gel
A competing analysis
11.12 Billion
2024
2032
7.0%
Narrower, excludes some sprays
A third-party benchmark
29.3 Billion
2025
2035
5.5%
Broad styling category, global
Consensus synthesis
Our analysis suggests the 29.3 Billion figure is most defensible because it aligns with the mid-point of top-down GDP-linked personal care spend and bottom-up category revenue triangulation. The lower 11.12 Billion figure almost certainly excludes professional salon and spray sub-segments, making it unsuitable for total-market sizing. Buyers should treat the 5.5%-5.8% CAGR band as the reliable planning corridor.
How is the market segmented?
The market segments along four primary axes: product format, ingredient type, end user and distribution channel. Styling-format and ingredient splits matter most for margin planning, while channel mix governs go-to-market investment.
Gels and waxes dominate value at roughly 45%, while inorganic formulations command about 58% of revenue. Our analysis indicates that the organic share will cross 45% by 2030 as certification frameworks mature.
Which region leads in Hairstyling Products Market Report?
Asia-Pacific leads the global hairstyling products market with approximately 34% revenue share, followed closely by North America at near 30% and Europe at 22%. The regional tree below shows how the market hierarchy maps for planning purposes.
Asia-Pacific — China, Japan, India, South Korea, Australia
North America — USA, Canada, Mexico
Europe — Germany, UK, France, Italy, Spain
Middle East & Africa — Saudi Arabia, UAE, South Africa
South America — Brazil, Argentina, Colombia
Region
Share
Asia-Pacific
34%
North America
30%
Europe
22%
Middle East & Africa
8%
South America
6%
This divergence implies that portfolio localization matters more than global scale. Asia-Pacific rewards lightweight, humidity-resistant textures and K-beauty aesthetics, whereas North America rewards premium, sulfate-free and curl-inclusive propositions.
What is driving growth — and what is holding it back?
Growth is driven primarily by social-commerce discovery, male-grooming expansion, clean-label reformulation and quick-commerce penetration. Restraints concentrate around chemical-safety scrutiny, price sensitivity and the reformulation cost burden on mid-tier brands.
Factor
Direction
Evidence strength
Mechanism
Social media & influencer discovery
Driver
High
TikTok/Instagram tutorials convert to purchase
Male grooming culture
Driver
High
Brands launching male-specific styling lines
Clean-label & organic demand
Driver
High
Certification-driven premiumization
Quick commerce
Driver
Medium
Impulse purchase uplift in urban hubs
Chemical-safety concerns
Restraint
High
Reformulation cost and demand shifts
Price sensitivity in mass tier
Restraint
Medium
Private-label share gains
On balance, the drivers outweigh the restraints by roughly 2:1 in value terms. Our analysis suggests the strongest second-order effect is that reformulation and certification are becoming a fixed cost of premium participation, raising the barrier to entry and consolidating share among scaled incumbents.
Who are the leading vendors?
The competitive landscape is moderately concentrated, with global beauty majors holding roughly 45%-50% of value and a long tail of regional and private-label players. Differentiation rests on formulation IP, certification depth and channel control rather than on price alone.
Company
HQ
Styling strength
Differentiation
L'Oréal
France
Broad portfolio, professional channel
R&D scale, salon adjacency
Unilever
UK
Mass & multicultural
Brand depth, inclusivity
Henkel
Germany
Mass & male grooming
Regional tailoring, GCC focus
Kao
Japan
Asia textures
Asia-Pacific distribution
Coty
US
Mass prestige
Celebrity licensing
Revlon
US
Mass styling
Value positioning
Estée Lauder
US
Prestige
Premium brand equity
KOSÉ
Japan
Asia premium
K-beauty adjacency
Our analysis suggests moats are shifting from brand heritage to certification and science-backed claims. Vendors that under-invest in clean-label IP risk ceding premium shelf space to salon-adjacent and dermatologist-endorsed challengers.
What do buyers and operators need to know?
Buyers and operators must prioritize three mission-critical criteria: formulation safety and certification (halal, COSMOS, GSO compliance), channel fit (mass versus professional versus DTC), and supply-chain resilience for specialty ingredients. Switching costs are moderate at the brand level but high at the contract-formulator level, where reformulation cycles typically run 9-18 months. Procurement risk concentrates on fragrance, polymer and preservative supply, especially where clean-label substitution is required. Regulatory compliance—particularly in the GCC, EU and increasingly in Southeast Asia—demands documentation depth that many mid-tier suppliers cannot provide. Operators should model total cost of certification, not just landed unit price, when evaluating supplier bids.
Strategic Recommendations & Analyst Perspective
The balance of evidence favors a certification-led, regionally localized strategy over a pure-scale or pure-price approach. The 5.5%-5.8% CAGR corridor is reliable, but the composition of growth is shifting faster than the headline suggests: organic and halal-certified SKUs are growing at double the market rate, and channel mix is tilting decisively toward online and quick commerce.
The strongest counter-argument is that reformulation and certification raise unit costs and could compress mass-tier margins faster than premiumization offsets them. Our analysis suggests this risk is real but second-order—brands that pre-invest in certification capture premium shelf space and pricing power, while laggards face private-label substitution.
Actionable strategy for investors and operators:
Prioritize certification-ready reformulation in the top three SKUs per brand to protect premium channel access.
Localize texture and humidity performance claims for Asia-Pacific and GCC markets rather than relying on global hero products.
Build quick-commerce and marketplace partnerships to capture impulse-driven trial, especially in urban Asia and the GCC.
What would change our conclusion: a sustained regulatory rollback on clean-label standards, or a sharper-than-expected collapse in premium-tier demand, would shift the strategic priority toward defensive cost leadership.
Methodology
Primary Research & Industry Fieldwork
Our research operates on a 70/30 primary-to-secondary split. We conducted in-depth interviews across the value chain—raw material and specialty chemical suppliers, dedicated hairstyling producers, contract formulators, and global distributors—using semi-structured protocols. Decision-maker respondents were drawn from VP Sourcing, Heads of R&D, Technical Directors, and Commercial Operations Leads, ensuring both formulation and commercial perspectives informed our sizing.
Secondary Benchmarking & Public Trade Validation
We validate against official multilateral and standards infrastructure, including UN Comtrade, WTO tariff schedules, US ITC data, Eurostat trade statistics, SEC 10-K filings, patent databases, and recognized industry associations. Corporate annual reports and investor presentations anchor our company-level revenue triangulation.
Demand Modeling & Market Sizing Triangulation
Simultaneous top-down allocation (macroeconomic personal-care spend and segment share) and bottom-up modeling (manufacturer capacity, pricing, end-use consumption) allow us to reconcile divergent estimates. Where sources conflict, we weight by recency, scope alignment and methodological transparency.
UN Comtrade — trade flows of cosmetic and personal care preparations
U.S. International Trade Commission — tariff and import data
Eurostat — European cosmetic trade and consumption statistics
SEC EDGAR — corporate 10-K filings of listed beauty majors
ISO 16128 — natural and organic cosmetic ingredient standards
Strategic Recommendations & Analyst Perspective
The balance of evidence favors a certification-led, regionally localized strategy over a pure-scale or pure-price approach. The 5.5%-5.8% CAGR corridor is reliable, but the composition of growth is shifting faster than the headline suggests: organic and halal-certified SKUs are growing at double the market rate, and channel mix is tilting decisively toward online and quick commerce.
The strongest counter-argument is that reformulation and certification raise unit costs and could compress mass-tier margins faster than premiumization offsets them. Our analysis suggests this risk is real but second-order—brands that pre-invest in certification capture premium shelf space and pricing power, while laggards face private-label substitution.
Actionable strategy for investors and operators:
Prioritize certification-ready reformulation in the top three SKUs per brand to protect premium channel access.
Localize texture and humidity performance claims for Asia-Pacific and GCC markets rather than relying on global hero products.
Build quick-commerce and marketplace partnerships to capture impulse-driven trial, especially in urban Asia and the GCC.
What would change our conclusion: a sustained regulatory rollback on clean-label standards, or a sharper-than-expected collapse in premium-tier demand, would shift the strategic priority toward defensive cost leadership.
Our rigorous research methodology combines multi-layered approaches with comprehensive quality assurance, ensuring precision, accuracy, and reliability in every market analysis.
Primary Research & Industry Fieldwork
Our research operates on a 70/30 primary-to-secondary split. We conducted in-depth interviews across the value chain—raw material and specialty chemical suppliers, dedicated hairstyling producers, contract formulators, and global distributors—using semi-structured protocols. Decision-maker respondents were drawn from VP Sourcing, Heads of R&D, Technical Directors, and Commercial Operations Leads.
Key Stakeholders Interviewed
Key Stakeholders Interviewed
Stakeholder Role
Interview Share (%)
R&D & Formulation Heads
35%
Procurement & Sourcing Directors
30%
Commercial Operations Leads
20%
Regulatory & Quality Managers
15%
Industry Ecosystem Breakdown
Industry Ecosystem Breakdown
Company Type
Representation (%)
Specialty Chemical Producers
40%
Hairstyling Formulators & Brands
35%
Distributors & Retailers
25%
Secondary Benchmarking & Public Trade Validation
We validate against official multilateral and standards infrastructure, including UN Comtrade, WTO tariff schedules, US ITC data, Eurostat trade statistics, SEC 10-K filings, patent databases, and recognized industry associations. Corporate annual reports and investor presentations anchor our company-level revenue triangulation.
Demand Modeling & Market Sizing Triangulation
Simultaneous top-down allocation (macroeconomic personal-care spend and segment share) and bottom-up modeling (manufacturer capacity, pricing, end-use consumption) allow us to reconcile divergent estimates. Where sources conflict, we weight by recency, scope alignment and methodological transparency.
Table 6: Hairstyling Products Market Report Revenue Billion Forecast, by Region 2020 & 2034
Table 7: Asia Pacific Hairstyling Products Market Report Revenue Billion Forecast, by Product 2020 & 2034
Table 8: Asia Pacific Hairstyling Products Market Report Revenue Billion Forecast, by Ingredient 2020 & 2034
Table 9: Asia Pacific Hairstyling Products Market Report Revenue Billion Forecast, by End User 2020 & 2034
Table 10: Asia Pacific Hairstyling Products Market Report Revenue Billion Forecast, by Distribution 2020 & 2034
Table 11: Asia Pacific Hairstyling Products Market Report Revenue Billion Forecast, by Application 2020 & 2034
Table 12: Asia Pacific Hairstyling Products Market Report Revenue Billion Forecast, by Country 2020 & 2034
Table 13: China Hairstyling Products Market Report Revenue (Billion) Forecast, by Application 2020 & 2034
Table 14: Japan Hairstyling Products Market Report Revenue (Billion) Forecast, by Application 2020 & 2034
Table 15: India Hairstyling Products Market Report Revenue (Billion) Forecast, by Application 2020 & 2034
Frequently Asked Questions
1. How big is the hairstyling products market?
The global hairstyling products market is sized at approximately 29.3 Billion in 2025 and is forecast to reach 50.0 Billion by 2035, expanding at a 5.5% CAGR.
2. Which region dominates the hairstyling products market?
Asia-Pacific leads with roughly 34% revenue share, followed by North America at near 30% and Europe at 22%. Asia-Pacific is also the fastest-growing region.
3. What are the fastest-growing hairstyling product types?
Pomades grow fastest at around 7.3% annually, while styling serums and organic-certified gels also outpace the broader category thanks to multifunctionality and clean-label demand.
4. Who are the leading hairstyling products companies?
L'Oréal, Unilever, Henkel, Kao, Coty, Revlon and Estée Lauder lead the market. These players hold roughly half of global value, with private labels gaining in mass channels.
5. What is driving hairstyling products market growth?
Social media discovery, male grooming expansion, clean-label reformulation and quick-commerce penetration are the primary growth drivers, offsetting chemical-safety and price-sensitivity restraints.
11.3. Company Market Share Analysis, 2026
11.3.1. Top 5 Companies Market Share Analysis
11.3.2. Top 3 Companies Market Share Analysis
11.4. List of Potential Customers
Figure 16:
Figure 17: North America Hairstyling Products Market Report Revenue Share (%), by Ingredient 2026 & 2034
Figure 18: North America Hairstyling Products Market Report Revenue (Billion), by End User 2026 & 2034
Figure 19: North America Hairstyling Products Market Report Revenue Share (%), by End User 2026 & 2034
Figure 20: North America Hairstyling Products Market Report Revenue (Billion), by Distribution 2026 & 2034
Figure 21: North America Hairstyling Products Market Report Revenue Share (%), by Distribution 2026 & 2034
Figure 22: North America Hairstyling Products Market Report Revenue (Billion), by Application 2026 & 2034
Figure 23: North America Hairstyling Products Market Report Revenue Share (%), by Application 2026 & 2034
Figure 24: North America Hairstyling Products Market Report Revenue (Billion), by Country 2026 & 2034
Figure 25: North America Hairstyling Products Market Report Revenue Share (%), by Country 2026 & 2034
Figure 26: Europe Hairstyling Products Market Report Revenue (Billion), by Product 2026 & 2034
Figure 27: Europe Hairstyling Products Market Report Revenue Share (%), by Product 2026 & 2034
Figure 28: Europe Hairstyling Products Market Report Revenue (Billion), by Ingredient 2026 & 2034
Figure 29: Europe Hairstyling Products Market Report Revenue Share (%), by Ingredient 2026 & 2034
Figure 30: Europe Hairstyling Products Market Report Revenue (Billion), by End User 2026 & 2034
Figure 31: Europe Hairstyling Products Market Report Revenue Share (%), by End User 2026 & 2034
Figure 32: Europe Hairstyling Products Market Report Revenue (Billion), by Distribution 2026 & 2034
Figure 33: Europe Hairstyling Products Market Report Revenue Share (%), by Distribution 2026 & 2034
Figure 34: Europe Hairstyling Products Market Report Revenue (Billion), by Application 2026 & 2034
Figure 35: Europe Hairstyling Products Market Report Revenue Share (%), by Application 2026 & 2034
Figure 36: Europe Hairstyling Products Market Report Revenue (Billion), by Country 2026 & 2034
Figure 37: Europe Hairstyling Products Market Report Revenue Share (%), by Country 2026 & 2034
Figure 38: Middle East & Africa Hairstyling Products Market Report Revenue (Billion), by Product 2026 & 2034
Figure 39: Middle East & Africa Hairstyling Products Market Report Revenue Share (%), by Product 2026 & 2034
Figure 40: Middle East & Africa Hairstyling Products Market Report Revenue (Billion), by Ingredient 2026 & 2034
Figure 41: Middle East & Africa Hairstyling Products Market Report Revenue Share (%), by Ingredient 2026 & 2034
Figure 42: Middle East & Africa Hairstyling Products Market Report Revenue (Billion), by End User 2026 & 2034
Figure 43: Middle East & Africa Hairstyling Products Market Report Revenue Share (%), by End User 2026 & 2034
Figure 44: Middle East & Africa Hairstyling Products Market Report Revenue (Billion), by Distribution 2026 & 2034
Figure 45: Middle East & Africa Hairstyling Products Market Report Revenue Share (%), by Distribution 2026 & 2034
Figure 46: Middle East & Africa Hairstyling Products Market Report Revenue (Billion), by Application 2026 & 2034
Figure 47: Middle East & Africa Hairstyling Products Market Report Revenue Share (%), by Application 2026 & 2034
Figure 48: Middle East & Africa Hairstyling Products Market Report Revenue (Billion), by Country 2026 & 2034
Figure 49: Middle East & Africa Hairstyling Products Market Report Revenue Share (%), by Country 2026 & 2034
Figure 50: South America Hairstyling Products Market Report Revenue (Billion), by Product 2026 & 2034
Figure 51: South America Hairstyling Products Market Report Revenue Share (%), by Product 2026 & 2034
Figure 52: South America Hairstyling Products Market Report Revenue (Billion), by Ingredient 2026 & 2034
Figure 53: South America Hairstyling Products Market Report Revenue Share (%), by Ingredient 2026 & 2034
Figure 54: South America Hairstyling Products Market Report Revenue (Billion), by End User 2026 & 2034
Figure 55: South America Hairstyling Products Market Report Revenue Share (%), by End User 2026 & 2034
Figure 56: South America Hairstyling Products Market Report Revenue (Billion), by Distribution 2026 & 2034
Figure 57: South America Hairstyling Products Market Report Revenue Share (%), by Distribution 2026 & 2034
Figure 58: South America Hairstyling Products Market Report Revenue (Billion), by Application 2026 & 2034
Figure 59: South America Hairstyling Products Market Report Revenue Share (%), by Application 2026 & 2034
Figure 60: South America Hairstyling Products Market Report Revenue (Billion), by Country 2026 & 2034
Figure 61: South America Hairstyling Products Market Report Revenue Share (%), by Country 2026 & 2034
Table 16: South Korea Hairstyling Products Market Report Revenue (Billion) Forecast, by Application 2020 & 2034
Table 17: Australia Hairstyling Products Market Report Revenue (Billion) Forecast, by Application 2020 & 2034
Table 18: North America Hairstyling Products Market Report Revenue Billion Forecast, by Product 2020 & 2034
Table 19: North America Hairstyling Products Market Report Revenue Billion Forecast, by Ingredient 2020 & 2034
Table 20: North America Hairstyling Products Market Report Revenue Billion Forecast, by End User 2020 & 2034
Table 21: North America Hairstyling Products Market Report Revenue Billion Forecast, by Distribution 2020 & 2034
Table 22: North America Hairstyling Products Market Report Revenue Billion Forecast, by Application 2020 & 2034
Table 23: North America Hairstyling Products Market Report Revenue Billion Forecast, by Country 2020 & 2034
Table 24: USA Hairstyling Products Market Report Revenue (Billion) Forecast, by Application 2020 & 2034