Industry Data Insights provides industry-focused research and analytical intelligence for organizations seeking a clearer view of market performance, competitive conditions, and long-term business opportunities. Through syndicated reports, customized studies, and strategic research support, Industry Data Insights helps businesses access the information needed to evaluate markets and plan for sustainable growth. Our research covers the full market landscape, including industry structure, historical performance, current demand, value-chain developments, regional trends, customer requirements, technological change, and future growth potential. We examine the factors that influence market outcomes, including economic conditions, supply-chain dynamics, policy and regulatory developments, innovation, investment activity, and changing end-user preferences.
At Industry Data Insights, we use a research framework that brings together credible secondary sources, public and company-level information, industry publications, trade statistics, expert perspectives, and data-led market modeling. Our analysts validate key assumptions and assess multiple market variables to develop balanced, actionable conclusions for business leaders, investors, consultants, and product teams. Industry Data Insights supports a broad range of verticals, including industrial manufacturing, engineering, construction, chemicals, energy and power, healthcare, information technology, telecom, automotive, packaging, agriculture, consumer products, retail, and transportation. Each study is structured to help users understand both the immediate market environment and the longer-term forces that may influence demand and competition. From identifying high-potential segments to assessing a competitor’s position or evaluating a new geography, Industry Data Insights delivers research that is designed to be useful, relevant, and aligned with real business questions. Our goal is to turn industry data into strategic direction.
Water Desalination Plant Equipment Market Report 2026
Water Desalination Plant Equipment Market Report by Equipment (Pretreatment Systems, Desalination Devices, Post-treatment Systems, Pumps & Energy-Recovery Devices, Control & Automation), by Source (Seawater, Brackish Water, River Water, Reclaimed Water), by Application (Municipal, Industrial, Agricultural, Others), by Production Capacity (Below 10 m3/hr, 10-100 m3/hr, 100-1, 500 m3/hr, Above 1, 500 m3/hr), by Middle East & Africa (Saudi Arabia, UAE, Egypt, Algeria, Oman, Kuwait, Morocco), by Asia Pacific (China, India, South Korea, Australia, Taiwan, Indonesia, Japan), by North America (USA, Canada, Mexico), by Europe (Spain, Greece, Italy, UK, Cyprus, Malta), by Latin America (Brazil, Chile, Peru, Argentina), by Eurasia (Kazakhstan, Azerbaijan, Russia) Forecast 2026-2034
Water Desalination Plant Equipment Market Report 2026
Discover the Latest Market Insight Reports
Access in-depth insights on industries, companies, trends, and global markets. Our expertly curated reports provide the most relevant data and analysis in a condensed, easy-to-read format.
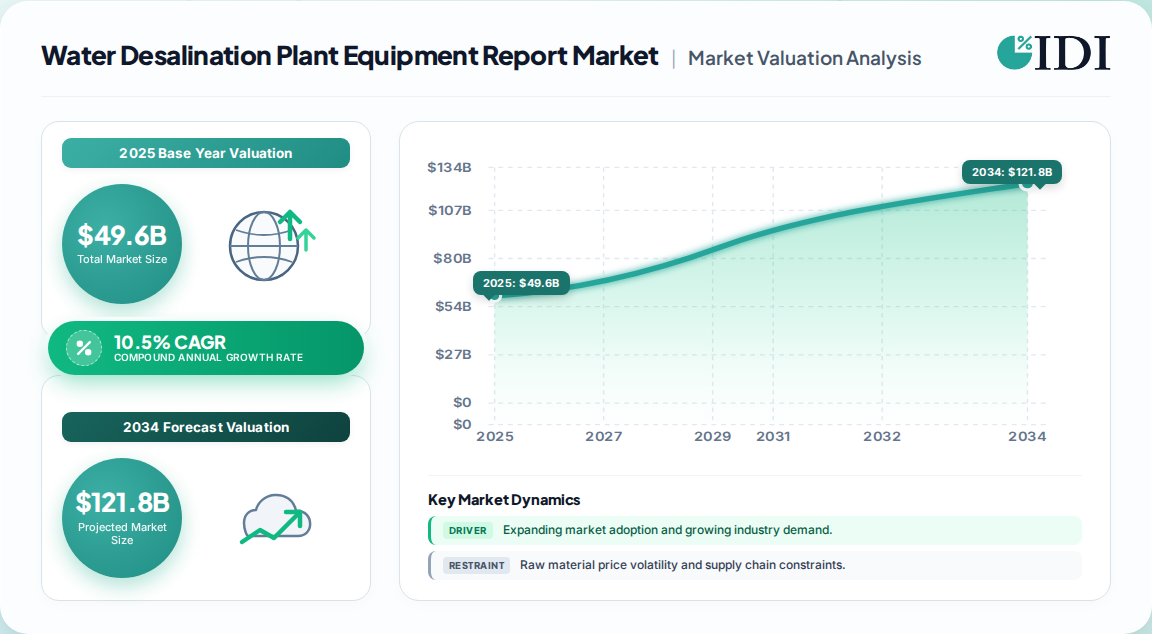
USD 49.6 billion in 2026 for global water desalination plant equipment, rising to USD 99.6 billion by 2033 — a 10.5% CAGR.
Middle East & Africa holds roughly 49% of global revenue, the single largest regional concentration in the water infrastructure sector.
Desalination devices (membrane trains, RO skids, thermal units) account for 44% of equipment value; seawater feeds 60.7% of installed capacity.
Municipal buyers command 50.7% of spend, but industrial self-supply is the faster-compounding demand pool.
Plants above 1,500 m³/hr represent 42.3% of revenue — scale economics still decide who wins contracts.
Competitive field is medium-concentrated: EPC integrators, membrane OEMs and energy-recovery specialists each hold distinct moats.
Why this matters for decision-makers: Equipment suppliers that cannot demonstrate sub-3.0 kWh/m³ specific energy and modular retrofit capability will be locked out of the 2027–2030 replacement wave, where margin — not volume — is decided.
Water Desalination Plant Equipment Market Report Market Size (In Billion)
100.0B
80.0B
60.0B
40.0B
20.0B
0
45.40 B
2025
49.60 B
2026
54.80 B
2027
60.50 B
2028
66.90 B
2029
73.90 B
2030
81.70 B
2031
Water Desalination Plant Equipment Market Report Market Size (In Billion)
Year
Market Size
2025
45.40 B
2026
49.60 B
2027
54.80 B
2028
60.50 B
2029
66.90 B
2030
73.90 B
2031
81.70 B
What is the Water Desalination Plant Equipment Market Report?
The water desalination plant equipment market covers the machinery and systems used to convert seawater, brackish water and river water into potable or process-grade freshwater — including pretreatment, desalination devices, post-treatment, pumps, energy-recovery devices and control systems.
Scope: what this report covers and excludes
Scope is global, covering equipment-level revenue across pretreatment systems, desalination devices, post-treatment systems, pumps and energy-recovery devices, segmented by source, application and production capacity, with 2025 as base year and forecasts to 2033.
This analysis does not cover desalination plant construction and civil works, operating and maintenance service contracts, bottled water, wastewater treatment equipment, or industrial water reuse systems that operate without a desalination stage. Membrane chemistry as a standalone chemicals market is also excluded; only membranes sold as part of equipment are counted.
How big is the market for Water Desalination Plant Equipment Market Report?
Published estimates for this equipment category diverge by a factor of more than two, because some analysts count complete plant EPC value while others count only the mechanical and membrane equipment package delivered to site.
Estimate
Base year
Horizon
CAGR
Definition / scope
Attribution
USD 45.4 B → 99.6 B
2025
2033
10.5%
Equipment package only, excl. civil works
One published estimate (primary benchmark)
USD 50.82 B → 109.42 B
2026
2034
10.06%
Plant equipment incl. post-processing systems
A competing analysis
USD 20.0 B → 42.7 B
2025
2033
10.0%
Narrower equipment-only definition
A narrower-scope estimate
USD 19.61 B → 29.92 B
2026
2031
8.82%
Desalination systems, membrane + thermal
A systems-level estimate
The USD 45–50 billion band is the most defensible starting point. Our analysis suggests the lower USD 20 billion figures exclude pump, valve and control-system content that buyers actually procure, while the USD 50 billion figure captures post-treatment scope. Notably, all four sources converge on 10% CAGR, which is the more reliable signal than any single base value.
How is the market segmented?
Segmentation runs on four axes — equipment type, feed source, end application and plant production capacity — with capacity being the axis that most directly drives unit economics and vendor selection.
One divergence deserves attention: one source ranks brackish water as the largest source segment at 28%, while the primary benchmark puts seawater at 60.7%. This implies different counting conventions — brackish is often counted at the point of industrial self-supply, seawater at municipal plant level. Buyers should reconcile definitions before comparing bids or sizing adjacent opportunities.
Which region leads in the water desalination plant equipment space?
Middle East & Africa leads with roughly 49–53% of global equipment revenue, driven by sovereign water-security programmes in the Gulf, North Africa and the Suez corridor, with Asia-Pacific the fastest-compounding region.
Water Desalination Plant Equipment Market Report Regional Market Share
Loading chart...
Water Desalination Plant Equipment Market Report Regional Market Share
Region
Market Share (%)
Middle East & Africa
0.49%
Asia-Pacific
0.19%
North America
0.12%
Europe
0.1%
Latin America
0.06%
Eurasia
0.04%
Middle East & Africa — Saudi Arabia, UAE, Egypt, Algeria, Oman, Kuwait, Morocco
Asia Pacific — China, India, South Korea, Australia, Taiwan, Indonesia, Japan
North America — USA (California, Texas), Canada, Mexico
Europe — Spain, Greece, Italy, UK, Cyprus, Malta
Latin America — Brazil, Chile, Peru, Argentina
Eurasia — Kazakhstan, Azerbaijan, Russia (Caspian brackish)
Within MEA, leadership is contested: one source names the UAE as the largest single country market, another names Saudi Arabia. Our analysis suggests Saudi Arabia is the forward-looking leader — targets of roughly 8.5 million m³/day of new RO capacity by 2030 imply a 60% capacity jump — while the UAE still leads on installed base. Buyers should treat Saudi Arabia as the demand hotspot and the UAE as the reference-case market for procurement standards.
What is driving growth — and what is holding it back?
Water scarcity and industrial self-supply obligations are the two structural drivers; capital intensity and brine regulation are the two binding constraints. Both drivers are policy-backed, which makes them more durable than commodity-cycle demand.
Factor
Direction
Evidence strength
Mechanism
Municipal water demand in MENA
Driver
Strong
Sovereign funds underwriting multi-billion PPPs
Industrial reuse / ZLD mandates
Driver
Strong
Fabs must recycle 90–95% of process water
Falling RO capex & energy-recovery efficiency
Driver
Strong
Installed costs down 18% since 2020; 98.5% exchanger efficiency
Green-hydrogen cluster demand
Driver
Moderate
9–12 L ultrapure water per kg H₂ embeds desalination in project design
High equipment and energy cost
Restraint
Strong
Capex sensitivity delays procurement in low-budget markets
Brine discharge regulation
Restraint
Moderate
Dilution rules add USD 0.22–0.30/m³ to cost
Membrane fouling and scaling
Restraint
Moderate
Flux loss up to 35% in 18 months; adds USD 0.12–0.20/m³ opex
The balance favours growth. Drivers are structural and state-backed; restraints are largely operating-cost and compliance issues that technology can progressively absorb. Our analysis suggests the second-order effect is more important than the headline CAGR: as RO capex falls, the constraint shifts from capital availability to plant uptime and energy tariff exposure — which repositions equipment value toward monitoring, energy recovery and membrane longevity.
Who are the leading vendors?
No single vendor holds dominant share; the field splits into EPC integrators, membrane OEMs and energy-recovery/component specialists, each with a different moat and a different exposure to price competition.
Company
Category
Core strength
Strategic exposure
Veolia
EPC integrator / operator
Full plant lifecycle and O&M
Public procurement cycles
Doosan Enerbility
EPC / thermal & RO
Large-scale MEA build capability
Capex-cyclical order book
IDE Technologies
Technology / thermal-RO
Thermal and hybrid process leadership
Regulatory brine exposure
Fisia Italimpianti
EPC contractor
MSF/MED and large coastal plants
Energy price sensitivity
Acciona
EPC / infrastructure
Utility-scale water infrastructure
Regional subsidy dependence
DuPont Water Solutions
Membrane OEM
Higher-flux membrane chemistry
Commoditization of membranes
Toray Industries
Membrane OEM
Long-life fibre, replacement economics
Price pressure from Asian entrants
Membrane OEMs hold the strongest structural moat — proprietary chemistry and replacement annuity — but face commoditization: polymer pricing pressure and 15% flux gains per generation erode unit-price premiums. EPC integrators hold relational and balance-sheet moats, yet their margins are exposed to turnkey bidding wars. Our analysis suggests the durable position sits in components where efficiency is measurable at the meter — pressure exchangers, energy-recovery devices and automation — because those are sold on a provable kWh/m³ saving rather than on capex discount.
What do buyers and operators need to know?
Procurement decisions in this category are decided long before price negotiation — they are decided by specific energy consumption, membrane warranty structure and brine compliance route. Buyers should require guaranteed kWh/m³ performance thresholds with liquidated damages, not nameplate capacity alone.
Switching costs are asymmetric. Membrane and pressure-exchanger replacement is a recurring, relatively contestable purchase; but control systems, pretreatment design and hydraulic configuration create multi-year lock-in once commissioned. This means the real negotiation leverage exists at the original equipment package stage, not at replacement.
Regulatory risk is concentrated and rising. Brine discharge limits in California, Spain and Australia impose dilution and diffuser costs that can add USD 0.22–0.30/m³ — enough to alter project viability. Buyers in these jurisdictions should contract for compliance responsibility explicitly rather than accepting generic environmental warranties.
Finally, capacity-class matters. Plants above 1,500 m³/hr capture the largest revenue share and the best unit economics, but modular and containerized units are gaining ground for industrial and remote deployments. Our analysis suggests modular buyers should scrutinise total cost of ownership, because modular capex premiums are frequently understated at the bid stage.
Strategic Recommendations & Analyst Perspective
The balance of evidence favours a constructive, capacity-constrained growth thesis rather than a demand-constrained one. Freshwater supply gaps are policy-recognised, sovereign funding is committed, and RO economics continue to improve in real terms. The strongest counter-argument is capex sensitivity: in subsidy-dependent markets, energy price shocks can delay or defer procurement, which makes order books lumpier than the 10% CAGR implies. That risk is real but does not reverse the trend — it redistributes timing and shifts share toward vendors who can offer phased or modular deployment.
A second-order effect deserves more attention than it receives. As membrane and energy-recovery costs fall, differentiation migrates from hardware to operational performance guarantees. Vendors who can underwrite specific energy consumption, uptime and membrane life will capture premium pricing; those selling on capex alone will face margin compression against Asian component entrants. This is the single most consequential strategic implication in the data.
Finally, geographic concentration cuts both ways. A market where roughly half of revenue sits in one region is efficient to serve but exposed to a single policy and energy-price regime. Diversification toward Asia-Pacific industrial demand and Latin American municipal projects is a hedge, not a growth story — but it is the right hedge.
Actionable strategy:
Equipment vendors should bundle performance guarantees (kWh/m³ and uptime) with hardware to defend margin against component commoditization.
Investors should weight exposure toward energy-recovery, automation and membrane-replacement annuities over turnkey EPC revenue.
Operators in regulated brine jurisdictions should secure compliance-cost allocation in contracts before commissioning, not after.
What would change this conclusion: a sustained energy price shock in MEA that freezes sovereign project awards for more than 18 months, or a step-change in membrane fouling countermeasures that collapses replacement demand. While this overview establishes the strategic frame, precise sub-segment forecasting by capacity class and by country-level project pipeline requires the full report's segment-level modelling.
Research Methodology
Primary Research & Industry Fieldwork
This study applied a 70/30 primary-to-secondary research split. In-depth interviews were conducted across the desalination equipment value chain, including membrane and polymer suppliers, pressure-vessel and pump manufacturers, energy-recovery device specialists, EPC integrators, and regional equipment distributors. Decision-maker designations interviewed included Vice Presidents of Sourcing, Heads of Membrane R&D, Technical Directors of Plant Engineering, and Commercial Operations Leads responsible for tender pricing.
Secondary Benchmarking & Public Trade Validation
Findings were validated against UN Comtrade and WTO trade flows, US ITC and Eurostat tariff and shipment data, corporate 10-K and annual investor filings, patent databases tracking membrane and energy-recovery innovation, and technical standards published by recognised industry associations and multilateral water bodies.
Demand Modeling & Market Sizing Triangulation
Top-down modelling allocated macroeconomic water-infrastructure spend and industrial capex across equipment categories; bottom-up modelling reconstructed manufacturer capacity, unit pricing and end-use consumption by plant capacity class. Both paths were reconciled to a single base-year figure.
UN Comtrade — desalination equipment and membrane trade flows
US Geological Survey (USGS) — global water resource and salinity data
World Economic Forum — freshwater demand-supply gap projections
International Desalination Association (IDA) — installed capacity and plant inventory
Water Desalination Plant Equipment Market Report Regional Market Share
Higher Coverage
Lower Coverage
No Coverage
Water Desalination Plant Equipment Market Report REPORT HIGHLIGHTS
Research Methodology & Data Sources
Our rigorous research methodology combines multi-layered approaches with comprehensive quality assurance, ensuring precision, accuracy, and reliability in every market analysis.
Primary Research & Industry Fieldwork
This study applied a 70/30 primary-to-secondary research split. In-depth interviews were conducted across the desalination equipment value chain, including membrane and polymer suppliers, pressure-vessel and pump manufacturers, energy-recovery device specialists, EPC integrators, and regional equipment distributors. Decision-maker designations interviewed included Vice Presidents of Sourcing, Heads of Membrane R&D, Technical Directors of Plant Engineering, and Commercial Operations Leads responsible for tender pricing.
Key Stakeholders Interviewed
Key Stakeholders Interviewed
Stakeholder Role
Interview Share (%)
Plant Engineering & Technical Directors
40%
Procurement & Sourcing Leads
30%
Commercial Operations & Tender Leads
20%
Regulatory & Environmental Compliance
10%
Industry Ecosystem Breakdown
Industry Ecosystem Breakdown
Company Type
Representation (%)
Membrane & Component Manufacturers
40%
EPC Integrators & Plant Builders
30%
Energy-Recovery & Pump Specialists
20%
Distributors & Regional Traders
10%
Secondary Benchmarking & Public Trade Validation
Findings were validated against UN Comtrade and WTO trade flows, US ITC and Eurostat tariff and shipment data, corporate 10-K and annual investor filings, patent databases tracking membrane and energy-recovery innovation, and technical standards published by recognised industry associations and multilateral water bodies.
Demand Modeling & Market Sizing Triangulation
Top-down modelling allocated macroeconomic water-infrastructure spend and industrial capex across equipment categories; bottom-up modelling reconstructed manufacturer capacity, unit pricing and end-use consumption by plant capacity class. Both paths were reconciled to a single base-year figure.
UN Comtrade — desalination equipment and membrane trade flows
US Geological Survey (USGS) — global water resource and salinity data
World Economic Forum — freshwater demand-supply gap projections
International Desalination Association (IDA) — installed capacity and plant inventory
Aspects
Details
Study Period
2020-2034
Base Year
2025
Estimated Year
2026
Forecast Period
2026-2034
Historical Period
2020-2025
Growth Rate
CAGR of 10.5% from 2020-2034
Segmentation
By Equipment
Pretreatment Systems
Desalination Devices
Post-treatment Systems
Pumps & Energy-Recovery Devices
Control & Automation
By Source
Seawater
Brackish Water
River Water
Reclaimed Water
By Application
Municipal
Industrial
Agricultural
Others
By Production Capacity
Below 10 m3/hr
10-100 m3/hr
100-1
500 m3/hr
Above 1
500 m3/hr
By Geography
Middle East & Africa
Saudi Arabia
UAE
Egypt
Algeria
Oman
Kuwait
Morocco
Asia Pacific
China
India
South Korea
Australia
Taiwan
Indonesia
Japan
North America
USA
Canada
Mexico
Europe
Spain
Greece
Italy
UK
Cyprus
Malta
Latin America
Table of Contents
1. Water Desalination Plant Equipment Market Report Introduction
1.1. Research Scope
1.2. Market Segmentation
1.3. Research Objective
1.4. Definitions and Assumptions
2. Water Desalination Plant Equipment Market Report Executive Summary
2.1. Market Snapshot
3. Water Desalination Plant Equipment Market Report Dynamics
3.1. Introduction
3.2. Market Drivers
3.3. Market Restrains
3.4. Market Trends
4. Water Desalination Plant Equipment Market Report Factor Analysis
4.1. Porters Five Forces
4.1.1. Bargaining Power of Suppliers
4.1.2. Bargaining Power of Buyers
4.1.3. Threat of New Entrants
4.1.4. Threat of Substitutes
4.1.5. Competitive Rivalry
4.2. PESTEL analysis
4.3. BCG Analysis
4.3.1. Stars (High Growth, High Market Share)
4.3.2. Cash Cows (Low Growth, High Market Share)
4.3.3. Question Mark (High Growth, Low Market Share)
4.3.4. Dogs (Low Growth, Low Market Share)
4.4. Ansoff Matrix Analysis
4.5. Supply Chain Analysis
4.6. Regulatory Landscape
4.7. Current Market Potential and Opportunity Assessment (TAM–SAM–SOM Framework)
4.8. IDI Analyst Note
5. Water Desalination Plant Equipment Market Report Analysis, Insights and Forecast, 2020-2034
5.1. Analysis, Insights and Forecast - by Equipment
5.1.1. Pretreatment Systems
5.1.2. Desalination Devices
5.1.3. Post-treatment Systems
5.1.4. Pumps & Energy-Recovery Devices
5.1.5. Control & Automation
5.2. Analysis, Insights and Forecast - by Source
5.2.1. Seawater
5.2.2. Brackish Water
5.2.3. River Water
5.2.4. Reclaimed Water
5.3. Analysis, Insights and Forecast - by Application
5.3.1. Municipal
5.3.2. Industrial
5.3.3. Agricultural
5.3.4. Others
5.4. Analysis, Insights and Forecast - by Production Capacity
5.4.1. Below 10 m3/hr
5.4.2. 10-100 m3/hr
5.4.3. 100-1
5.4.4. 500 m3/hr
5.4.5. Above 1
5.4.6. 500 m3/hr
5.5. Analysis, Insights and Forecast - by Region
5.5.1. Middle East & Africa
5.5.2. Asia Pacific
5.5.3. North America
5.5.4. Europe
5.5.5. Latin America
5.5.6. Eurasia
6. Water Desalination Plant Equipment Market Report Middle East & Africa Analysis, Insights and Forecast, 2020-2034
6.1. Analysis, Insights and Forecast - by Equipment
6.1.1. Pretreatment Systems
6.1.2. Desalination Devices
6.1.3. Post-treatment Systems
6.1.4. Pumps & Energy-Recovery Devices
6.1.5. Control & Automation
6.2. Analysis, Insights and Forecast - by Source
6.2.1. Seawater
6.2.2. Brackish Water
6.2.3. River Water
6.2.4. Reclaimed Water
6.3. Analysis, Insights and Forecast - by Application
6.3.1. Municipal
6.3.2. Industrial
6.3.3. Agricultural
6.3.4. Others
6.4. Analysis, Insights and Forecast - by Production Capacity
6.4.1. Below 10 m3/hr
6.4.2. 10-100 m3/hr
6.4.3. 100-1
6.4.4. 500 m3/hr
6.4.5. Above 1
6.4.6. 500 m3/hr
7. Water Desalination Plant Equipment Market Report Asia Pacific Analysis, Insights and Forecast, 2020-2034
7.1. Analysis, Insights and Forecast - by Equipment
7.1.1. Pretreatment Systems
7.1.2. Desalination Devices
7.1.3. Post-treatment Systems
7.1.4. Pumps & Energy-Recovery Devices
7.1.5. Control & Automation
7.2. Analysis, Insights and Forecast - by Source
7.2.1. Seawater
7.2.2. Brackish Water
7.2.3. River Water
7.2.4. Reclaimed Water
7.3. Analysis, Insights and Forecast - by Application
7.3.1. Municipal
7.3.2. Industrial
7.3.3. Agricultural
7.3.4. Others
7.4. Analysis, Insights and Forecast - by Production Capacity
7.4.1. Below 10 m3/hr
7.4.2. 10-100 m3/hr
7.4.3. 100-1
7.4.4. 500 m3/hr
7.4.5. Above 1
7.4.6. 500 m3/hr
8. Water Desalination Plant Equipment Market Report North America Analysis, Insights and Forecast, 2020-2034
8.1. Analysis, Insights and Forecast - by Equipment
8.1.1. Pretreatment Systems
8.1.2. Desalination Devices
8.1.3. Post-treatment Systems
8.1.4. Pumps & Energy-Recovery Devices
8.1.5. Control & Automation
8.2. Analysis, Insights and Forecast - by Source
8.2.1. Seawater
8.2.2. Brackish Water
8.2.3. River Water
8.2.4. Reclaimed Water
8.3. Analysis, Insights and Forecast - by Application
8.3.1. Municipal
8.3.2. Industrial
8.3.3. Agricultural
8.3.4. Others
8.4. Analysis, Insights and Forecast - by Production Capacity
8.4.1. Below 10 m3/hr
8.4.2. 10-100 m3/hr
8.4.3. 100-1
8.4.4. 500 m3/hr
8.4.5. Above 1
8.4.6. 500 m3/hr
9. Water Desalination Plant Equipment Market Report Europe Analysis, Insights and Forecast, 2020-2034
9.1. Analysis, Insights and Forecast - by Equipment
9.1.1. Pretreatment Systems
9.1.2. Desalination Devices
9.1.3. Post-treatment Systems
9.1.4. Pumps & Energy-Recovery Devices
9.1.5. Control & Automation
9.2. Analysis, Insights and Forecast - by Source
9.2.1. Seawater
9.2.2. Brackish Water
9.2.3. River Water
9.2.4. Reclaimed Water
9.3. Analysis, Insights and Forecast - by Application
9.3.1. Municipal
9.3.2. Industrial
9.3.3. Agricultural
9.3.4. Others
9.4. Analysis, Insights and Forecast - by Production Capacity
9.4.1. Below 10 m3/hr
9.4.2. 10-100 m3/hr
9.4.3. 100-1
9.4.4. 500 m3/hr
9.4.5. Above 1
9.4.6. 500 m3/hr
10. Water Desalination Plant Equipment Market Report Latin America Analysis, Insights and Forecast, 2020-2034
10.1. Analysis, Insights and Forecast - by Equipment
10.1.1. Pretreatment Systems
10.1.2. Desalination Devices
10.1.3. Post-treatment Systems
10.1.4. Pumps & Energy-Recovery Devices
10.1.5. Control & Automation
10.2. Analysis, Insights and Forecast - by Source
10.2.1. Seawater
10.2.2. Brackish Water
10.2.3. River Water
10.2.4. Reclaimed Water
10.3. Analysis, Insights and Forecast - by Application
10.3.1. Municipal
10.3.2. Industrial
10.3.3. Agricultural
10.3.4. Others
10.4. Analysis, Insights and Forecast - by Production Capacity
10.4.1. Below 10 m3/hr
10.4.2. 10-100 m3/hr
10.4.3. 100-1
10.4.4. 500 m3/hr
10.4.5. Above 1
10.4.6. 500 m3/hr
11. Water Desalination Plant Equipment Market Report Eurasia Analysis, Insights and Forecast, 2020-2034
11.1. Analysis, Insights and Forecast - by Equipment
11.1.1. Pretreatment Systems
11.1.2. Desalination Devices
11.1.3. Post-treatment Systems
11.1.4. Pumps & Energy-Recovery Devices
11.1.5. Control & Automation
11.2. Analysis, Insights and Forecast - by Source
11.2.1. Seawater
11.2.2. Brackish Water
11.2.3. River Water
11.2.4. Reclaimed Water
11.3. Analysis, Insights and Forecast - by Application
11.3.1. Municipal
11.3.2. Industrial
11.3.3. Agricultural
11.3.4. Others
11.4. Analysis, Insights and Forecast - by Production Capacity
11.4.1. Below 10 m3/hr
11.4.2. 10-100 m3/hr
11.4.3. 100-1
11.4.4. 500 m3/hr
11.4.5. Above 1
11.4.6. 500 m3/hr
12. Water Desalination Plant Equipment Market Report Competitive Analysis
12.1. Company Profiles
12.1.1. Veolia
12.1.1.1. Company Overview
12.1.1.2. Products
12.1.1.3. Company Financials
12.1.1.4. SWOT Analysis
12.1.2. Doosan Enerbility
12.1.2.1. Company Overview
12.1.2.2. Products
12.1.2.3. Company Financials
12.1.2.4. SWOT Analysis
12.1.3. IDE Technologies
12.1.3.1. Company Overview
12.1.3.2. Products
12.1.3.3. Company Financials
12.1.3.4. SWOT Analysis
12.1.4. Fisia Italimpianti
12.1.4.1. Company Overview
12.1.4.2. Products
12.1.4.3. Company Financials
12.1.4.4. SWOT Analysis
12.1.5. Acciona
12.1.5.1. Company Overview
12.1.5.2. Products
12.1.5.3. Company Financials
12.1.5.4. SWOT Analysis
12.1.6. DuPont Water Solutions
12.1.6.1. Company Overview
12.1.6.2. Products
12.1.6.3. Company Financials
12.1.6.4. SWOT Analysis
12.1.7. Toray Industries
12.1.7.1. Company Overview
12.1.7.2. Products
12.1.7.3. Company Financials
12.1.7.4. SWOT Analysis
12.2. Market Entropy
12.2.1. Company's Key Areas Served
12.2.2. Recent Developments
12.3. Company Market Share Analysis, 2026
12.3.1. Top 5 Companies Market Share Analysis
12.3.2. Top 3 Companies Market Share Analysis
13. Water Desalination Plant Equipment Market Report Research Methodology
List of Figures
Figure 1: Water Desalination Plant Equipment Market Report Revenue Breakdown (Billion, %) by Region 2026 & 2034
Figure 2: Middle East & Africa Water Desalination Plant Equipment Market Report Revenue (Billion), by Equipment 2026 & 2034
Figure 3: Middle East & Africa Water Desalination Plant Equipment Market Report Revenue Share (%), by Equipment 2026 & 2034
Figure 4: Middle East & Africa Water Desalination Plant Equipment Market Report Revenue (Billion), by Source 2026 & 2034
Figure 5: Middle East & Africa Water Desalination Plant Equipment Market Report Revenue Share (%), by Source 2026 & 2034
Figure 6: Middle East & Africa Water Desalination Plant Equipment Market Report Revenue (Billion), by Application 2026 & 2034
Figure 7: Middle East & Africa Water Desalination Plant Equipment Market Report Revenue Share (%), by Application 2026 & 2034
Figure 8: Middle East & Africa Water Desalination Plant Equipment Market Report Revenue (Billion), by Production Capacity 2026 & 2034
Figure 9: Middle East & Africa Water Desalination Plant Equipment Market Report Revenue Share (%), by Production Capacity 2026 & 2034
Figure 10: Middle East & Africa Water Desalination Plant Equipment Market Report Revenue (Billion), by Country 2026 & 2034
Figure 11: Middle East & Africa Water Desalination Plant Equipment Market Report Revenue Share (%), by Country 2026 & 2034
Figure 12: Asia Pacific Water Desalination Plant Equipment Market Report Revenue (Billion), by Equipment 2026 & 2034
Figure 13: Asia Pacific Water Desalination Plant Equipment Market Report Revenue Share (%), by Equipment 2026 & 2034
Figure 14: Asia Pacific Water Desalination Plant Equipment Market Report Revenue (Billion), by Source 2026 & 2034
List of Tables
Table 1: Water Desalination Plant Equipment Market Report Revenue Billion Forecast, by Equipment 2020 & 2034
Table 2: Water Desalination Plant Equipment Market Report Revenue Billion Forecast, by Source 2020 & 2034
Table 3: Water Desalination Plant Equipment Market Report Revenue Billion Forecast, by Application 2020 & 2034
Table 4: Water Desalination Plant Equipment Market Report Revenue Billion Forecast, by Production Capacity 2020 & 2034
Table 5: Water Desalination Plant Equipment Market Report Revenue Billion Forecast, by Region 2020 & 2034
Table 6: Middle East & Africa Water Desalination Plant Equipment Market Report Revenue Billion Forecast, by Equipment 2020 & 2034
Table 7: Middle East & Africa Water Desalination Plant Equipment Market Report Revenue Billion Forecast, by Source 2020 & 2034
Table 8: Middle East & Africa Water Desalination Plant Equipment Market Report Revenue Billion Forecast, by Application 2020 & 2034
Table 9: Middle East & Africa Water Desalination Plant Equipment Market Report Revenue Billion Forecast, by Production Capacity 2020 & 2034
Table 10: Middle East & Africa Water Desalination Plant Equipment Market Report Revenue Billion Forecast, by Country 2020 & 2034
Table 11: Saudi Arabia Water Desalination Plant Equipment Market Report Revenue (Billion) Forecast, by Application 2020 & 2034
Table 12: UAE Water Desalination Plant Equipment Market Report Revenue (Billion) Forecast, by Application 2020 & 2034
Table 13: Egypt Water Desalination Plant Equipment Market Report Revenue (Billion) Forecast, by Application 2020 & 2034
Table 14: Algeria Water Desalination Plant Equipment Market Report Revenue (Billion) Forecast, by Application 2020 & 2034
Frequently Asked Questions
1. How big is the water desalination plant equipment market?
The market is estimated at USD 49.6 billion in 2026 and projected to reach USD 99.6 billion by 2033, growing at a 10.5% CAGR. Broader definitions that include post-treatment systems put the 2026 figure closer to USD 50.8 billion.
2. Which region dominates desalination equipment demand?
Middle East & Africa accounts for roughly 49–53% of global equipment revenue, driven by sovereign water-security programmes in Saudi Arabia, the UAE, Egypt and Algeria. Asia-Pacific is the fastest-growing region, led by China at a double-digit CAGR.
3. Is reverse osmosis or thermal desalination equipment larger?
Membrane and reverse osmosis technology holds the majority share, with RO capturing over 56% of equipment revenue in the primary benchmark and membrane processes around 78% of systems-level spend. Thermal MSF and MED remain relevant for large coastal plants and hybrid configurations.
4. What is driving growth in this market?
Freshwater scarcity, population growth, industrial reuse and zero-liquid-discharge mandates, and falling RO capex are the main drivers. Energy-recovery efficiency reaching 98.5% has pushed specific energy toward 2.2 kWh/m³, improving project economics.
5. What are the main restraints on desalination equipment adoption?
High capital and operating costs, energy price sensitivity, and increasingly strict brine discharge regulation are the principal restraints. Membrane fouling and scaling also add USD 0.12–0.20 per m³ to operating costs.
6. Who are the leading companies in desalination plant equipment?
Key players include Veolia, Doosan Enerbility, IDE Technologies, Fisia Italimpianti, Acciona, DuPont Water Solutions and Toray Industries. No single vendor holds dominant share, and the competitive field is medium-concentrated.
Brazil
Chile
Peru
Argentina
Eurasia
Kazakhstan
Azerbaijan
Russia
12.4. List of Potential Customers
Figure 15: Asia Pacific Water Desalination Plant Equipment Market Report Revenue Share (%), by Source 2026 & 2034
Figure 16: Asia Pacific Water Desalination Plant Equipment Market Report Revenue (Billion), by Application 2026 & 2034
Figure 17: Asia Pacific Water Desalination Plant Equipment Market Report Revenue Share (%), by Application 2026 & 2034
Figure 18: Asia Pacific Water Desalination Plant Equipment Market Report Revenue (Billion), by Production Capacity 2026 & 2034
Figure 19: Asia Pacific Water Desalination Plant Equipment Market Report Revenue Share (%), by Production Capacity 2026 & 2034
Figure 20: Asia Pacific Water Desalination Plant Equipment Market Report Revenue (Billion), by Country 2026 & 2034
Figure 21: Asia Pacific Water Desalination Plant Equipment Market Report Revenue Share (%), by Country 2026 & 2034
Figure 22: North America Water Desalination Plant Equipment Market Report Revenue (Billion), by Equipment 2026 & 2034
Figure 23: North America Water Desalination Plant Equipment Market Report Revenue Share (%), by Equipment 2026 & 2034
Figure 24: North America Water Desalination Plant Equipment Market Report Revenue (Billion), by Source 2026 & 2034
Figure 25: North America Water Desalination Plant Equipment Market Report Revenue Share (%), by Source 2026 & 2034
Figure 26: North America Water Desalination Plant Equipment Market Report Revenue (Billion), by Application 2026 & 2034
Figure 27: North America Water Desalination Plant Equipment Market Report Revenue Share (%), by Application 2026 & 2034
Figure 28: North America Water Desalination Plant Equipment Market Report Revenue (Billion), by Production Capacity 2026 & 2034
Figure 29: North America Water Desalination Plant Equipment Market Report Revenue Share (%), by Production Capacity 2026 & 2034
Figure 30: North America Water Desalination Plant Equipment Market Report Revenue (Billion), by Country 2026 & 2034
Figure 31: North America Water Desalination Plant Equipment Market Report Revenue Share (%), by Country 2026 & 2034
Figure 32: Europe Water Desalination Plant Equipment Market Report Revenue (Billion), by Equipment 2026 & 2034
Figure 33: Europe Water Desalination Plant Equipment Market Report Revenue Share (%), by Equipment 2026 & 2034
Figure 34: Europe Water Desalination Plant Equipment Market Report Revenue (Billion), by Source 2026 & 2034
Figure 35: Europe Water Desalination Plant Equipment Market Report Revenue Share (%), by Source 2026 & 2034
Figure 36: Europe Water Desalination Plant Equipment Market Report Revenue (Billion), by Application 2026 & 2034
Figure 37: Europe Water Desalination Plant Equipment Market Report Revenue Share (%), by Application 2026 & 2034
Figure 38: Europe Water Desalination Plant Equipment Market Report Revenue (Billion), by Production Capacity 2026 & 2034
Figure 39: Europe Water Desalination Plant Equipment Market Report Revenue Share (%), by Production Capacity 2026 & 2034
Figure 40: Europe Water Desalination Plant Equipment Market Report Revenue (Billion), by Country 2026 & 2034
Figure 41: Europe Water Desalination Plant Equipment Market Report Revenue Share (%), by Country 2026 & 2034
Figure 42: Latin America Water Desalination Plant Equipment Market Report Revenue (Billion), by Equipment 2026 & 2034
Figure 43: Latin America Water Desalination Plant Equipment Market Report Revenue Share (%), by Equipment 2026 & 2034
Figure 44: Latin America Water Desalination Plant Equipment Market Report Revenue (Billion), by Source 2026 & 2034
Figure 45: Latin America Water Desalination Plant Equipment Market Report Revenue Share (%), by Source 2026 & 2034
Figure 46: Latin America Water Desalination Plant Equipment Market Report Revenue (Billion), by Application 2026 & 2034
Figure 47: Latin America Water Desalination Plant Equipment Market Report Revenue Share (%), by Application 2026 & 2034
Figure 48: Latin America Water Desalination Plant Equipment Market Report Revenue (Billion), by Production Capacity 2026 & 2034
Figure 49: Latin America Water Desalination Plant Equipment Market Report Revenue Share (%), by Production Capacity 2026 & 2034
Figure 50: Latin America Water Desalination Plant Equipment Market Report Revenue (Billion), by Country 2026 & 2034
Figure 51: Latin America Water Desalination Plant Equipment Market Report Revenue Share (%), by Country 2026 & 2034
Figure 52: Eurasia Water Desalination Plant Equipment Market Report Revenue (Billion), by Equipment 2026 & 2034
Figure 53: Eurasia Water Desalination Plant Equipment Market Report Revenue Share (%), by Equipment 2026 & 2034
Figure 54: Eurasia Water Desalination Plant Equipment Market Report Revenue (Billion), by Source 2026 & 2034
Figure 55: Eurasia Water Desalination Plant Equipment Market Report Revenue Share (%), by Source 2026 & 2034
Figure 56: Eurasia Water Desalination Plant Equipment Market Report Revenue (Billion), by Application 2026 & 2034
Figure 57: Eurasia Water Desalination Plant Equipment Market Report Revenue Share (%), by Application 2026 & 2034
Figure 58: Eurasia Water Desalination Plant Equipment Market Report Revenue (Billion), by Production Capacity 2026 & 2034
Figure 59: Eurasia Water Desalination Plant Equipment Market Report Revenue Share (%), by Production Capacity 2026 & 2034
Figure 60: Eurasia Water Desalination Plant Equipment Market Report Revenue (Billion), by Country 2026 & 2034
Figure 61: Eurasia Water Desalination Plant Equipment Market Report Revenue Share (%), by Country 2026 & 2034
Table 15: Oman Water Desalination Plant Equipment Market Report Revenue (Billion) Forecast, by Application 2020 & 2034
Table 16: Kuwait Water Desalination Plant Equipment Market Report Revenue (Billion) Forecast, by Application 2020 & 2034
Table 17: Morocco Water Desalination Plant Equipment Market Report Revenue (Billion) Forecast, by Application 2020 & 2034
Table 18: Asia Pacific Water Desalination Plant Equipment Market Report Revenue Billion Forecast, by Equipment 2020 & 2034
Table 19: Asia Pacific Water Desalination Plant Equipment Market Report Revenue Billion Forecast, by Source 2020 & 2034
Table 20: Asia Pacific Water Desalination Plant Equipment Market Report Revenue Billion Forecast, by Application 2020 & 2034
Table 21: Asia Pacific Water Desalination Plant Equipment Market Report Revenue Billion Forecast, by Production Capacity 2020 & 2034
Table 22: Asia Pacific Water Desalination Plant Equipment Market Report Revenue Billion Forecast, by Country 2020 & 2034
Table 23: China Water Desalination Plant Equipment Market Report Revenue (Billion) Forecast, by Application 2020 & 2034
Table 24: India Water Desalination Plant Equipment Market Report Revenue (Billion) Forecast, by Application 2020 & 2034
Table 25: South Korea Water Desalination Plant Equipment Market Report Revenue (Billion) Forecast, by Application 2020 & 2034
Table 26: Australia Water Desalination Plant Equipment Market Report Revenue (Billion) Forecast, by Application 2020 & 2034
Table 27: Taiwan Water Desalination Plant Equipment Market Report Revenue (Billion) Forecast, by Application 2020 & 2034
Table 28: Indonesia Water Desalination Plant Equipment Market Report Revenue (Billion) Forecast, by Application 2020 & 2034
Table 29: Japan Water Desalination Plant Equipment Market Report Revenue (Billion) Forecast, by Application 2020 & 2034
Table 30: North America Water Desalination Plant Equipment Market Report Revenue Billion Forecast, by Equipment 2020 & 2034
Table 31: North America Water Desalination Plant Equipment Market Report Revenue Billion Forecast, by Source 2020 & 2034
Table 32: North America Water Desalination Plant Equipment Market Report Revenue Billion Forecast, by Application 2020 & 2034
Table 33: North America Water Desalination Plant Equipment Market Report Revenue Billion Forecast, by Production Capacity 2020 & 2034
Table 34: North America Water Desalination Plant Equipment Market Report Revenue Billion Forecast, by Country 2020 & 2034
Table 35: USA Water Desalination Plant Equipment Market Report Revenue (Billion) Forecast, by Application 2020 & 2034
Table 36: Canada Water Desalination Plant Equipment Market Report Revenue (Billion) Forecast, by Application 2020 & 2034
Table 37: Mexico Water Desalination Plant Equipment Market Report Revenue (Billion) Forecast, by Application 2020 & 2034
Table 38: Europe Water Desalination Plant Equipment Market Report Revenue Billion Forecast, by Equipment 2020 & 2034
Table 39: Europe Water Desalination Plant Equipment Market Report Revenue Billion Forecast, by Source 2020 & 2034
Table 40: Europe Water Desalination Plant Equipment Market Report Revenue Billion Forecast, by Application 2020 & 2034
Table 41: Europe Water Desalination Plant Equipment Market Report Revenue Billion Forecast, by Production Capacity 2020 & 2034
Table 42: Europe Water Desalination Plant Equipment Market Report Revenue Billion Forecast, by Country 2020 & 2034
Table 43: Spain Water Desalination Plant Equipment Market Report Revenue (Billion) Forecast, by Application 2020 & 2034
Table 44: Greece Water Desalination Plant Equipment Market Report Revenue (Billion) Forecast, by Application 2020 & 2034
Table 45: Italy Water Desalination Plant Equipment Market Report Revenue (Billion) Forecast, by Application 2020 & 2034
Table 46: UK Water Desalination Plant Equipment Market Report Revenue (Billion) Forecast, by Application 2020 & 2034
Table 47: Cyprus Water Desalination Plant Equipment Market Report Revenue (Billion) Forecast, by Application 2020 & 2034
Table 48: Malta Water Desalination Plant Equipment Market Report Revenue (Billion) Forecast, by Application 2020 & 2034
Table 49: Latin America Water Desalination Plant Equipment Market Report Revenue Billion Forecast, by Equipment 2020 & 2034
Table 50: Latin America Water Desalination Plant Equipment Market Report Revenue Billion Forecast, by Source 2020 & 2034
Table 51: Latin America Water Desalination Plant Equipment Market Report Revenue Billion Forecast, by Application 2020 & 2034
Table 52: Latin America Water Desalination Plant Equipment Market Report Revenue Billion Forecast, by Production Capacity 2020 & 2034
Table 53: Latin America Water Desalination Plant Equipment Market Report Revenue Billion Forecast, by Country 2020 & 2034
Table 54: Brazil Water Desalination Plant Equipment Market Report Revenue (Billion) Forecast, by Application 2020 & 2034
Table 55: Chile Water Desalination Plant Equipment Market Report Revenue (Billion) Forecast, by Application 2020 & 2034
Table 56: Peru Water Desalination Plant Equipment Market Report Revenue (Billion) Forecast, by Application 2020 & 2034
Table 57: Argentina Water Desalination Plant Equipment Market Report Revenue (Billion) Forecast, by Application 2020 & 2034
Table 58: Eurasia Water Desalination Plant Equipment Market Report Revenue Billion Forecast, by Equipment 2020 & 2034
Table 59: Eurasia Water Desalination Plant Equipment Market Report Revenue Billion Forecast, by Source 2020 & 2034
Table 60: Eurasia Water Desalination Plant Equipment Market Report Revenue Billion Forecast, by Application 2020 & 2034
Table 61: Eurasia Water Desalination Plant Equipment Market Report Revenue Billion Forecast, by Production Capacity 2020 & 2034
Table 62: Eurasia Water Desalination Plant Equipment Market Report Revenue Billion Forecast, by Country 2020 & 2034
Table 63: Kazakhstan Water Desalination Plant Equipment Market Report Revenue (Billion) Forecast, by Application 2020 & 2034
Table 64: Azerbaijan Water Desalination Plant Equipment Market Report Revenue (Billion) Forecast, by Application 2020 & 2034
Table 65: Russia Water Desalination Plant Equipment Market Report Revenue (Billion) Forecast, by Application 2020 & 2034