Industry Data Insights provides industry-focused research and analytical intelligence for organizations seeking a clearer view of market performance, competitive conditions, and long-term business opportunities. Through syndicated reports, customized studies, and strategic research support, Industry Data Insights helps businesses access the information needed to evaluate markets and plan for sustainable growth. Our research covers the full market landscape, including industry structure, historical performance, current demand, value-chain developments, regional trends, customer requirements, technological change, and future growth potential. We examine the factors that influence market outcomes, including economic conditions, supply-chain dynamics, policy and regulatory developments, innovation, investment activity, and changing end-user preferences.
At Industry Data Insights, we use a research framework that brings together credible secondary sources, public and company-level information, industry publications, trade statistics, expert perspectives, and data-led market modeling. Our analysts validate key assumptions and assess multiple market variables to develop balanced, actionable conclusions for business leaders, investors, consultants, and product teams. Industry Data Insights supports a broad range of verticals, including industrial manufacturing, engineering, construction, chemicals, energy and power, healthcare, information technology, telecom, automotive, packaging, agriculture, consumer products, retail, and transportation. Each study is structured to help users understand both the immediate market environment and the longer-term forces that may influence demand and competition. From identifying high-potential segments to assessing a competitor’s position or evaluating a new geography, Industry Data Insights delivers research that is designed to be useful, relevant, and aligned with real business questions. Our goal is to turn industry data into strategic direction.
Crypto Atm Market Report by Type (One-way, Two-way), by Offering (Hardware, Software), by Component (Solution, Services), by Application (Commercial spaces, Restaurants, Transportation hubs, Standalone units), by Deployment (On-premise, Cloud-based), by North America (USA, Canada, Mexico), by Europe (Germany, UK, France, Italy), by Asia Pacific (China, Japan, India, South Korea), by Latin America (Brazil, Mexico, Argentina), by Middle East & Africa (Saudi Arabia, UAE, South Africa) Forecast 2026-2034
Access in-depth insights on industries, companies, trends, and global markets. Our expertly curated reports provide the most relevant data and analysis in a condensed, easy-to-read format.
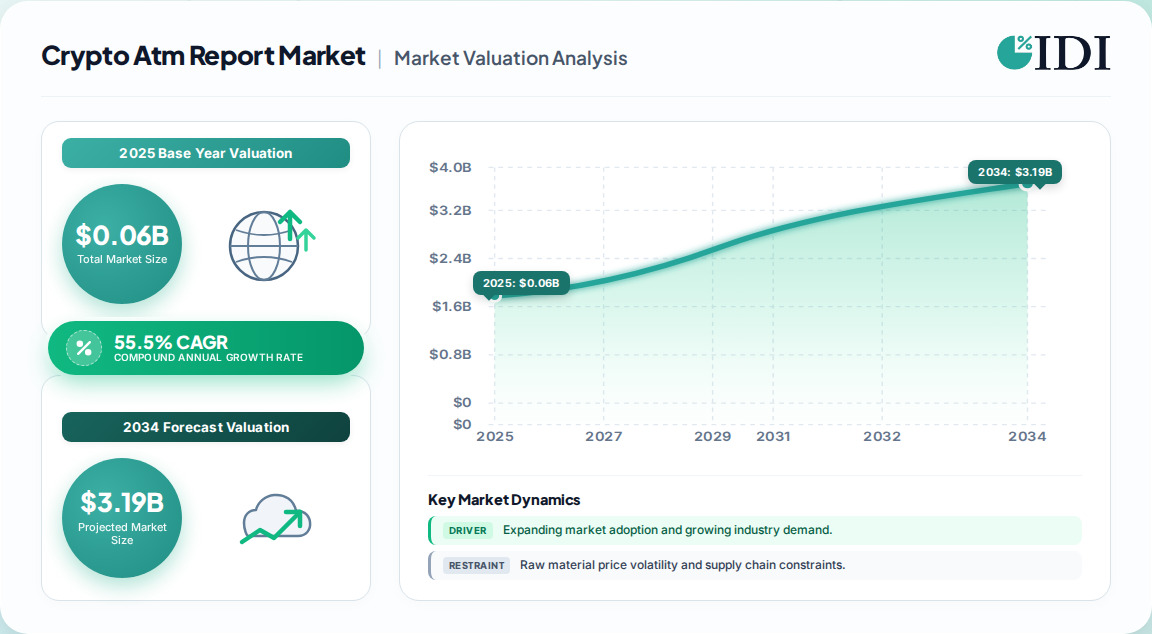
USD 0.06 Billion (2025 base), scaling to USD 4.83 Billion by 2035 at a 55.5% CAGR — global scope, hardware-plus-software ATM deployments.
Forecast CAGR of 55.5% (2025–2035) is the consensus midpoint across published estimates, which range from 54.2% to 55.5%.
Two-way (bidirectional) machines lead the type segment; one-way units post the fastest incremental growth as low-capex entry points.
North America is the largest region (~38% of installed base); Asia-Pacific is the fastest-growing, led by India, Indonesia and the Philippines.
Hardware dominates revenue (~65%), but cloud-based software and managed services carry the fastest growth and stickiest margins.
Leading players: Genesis Coin, BitAccess, General Bytes, Coinsource, Bitstop, Lamassu, Coinme and Bitcoin Depot.
Why this matters for decision-makers: the market is outgrowing its compliance infrastructure — operators that lock in KYC/AML-grade software and biometric hardware early will capture the consolidation premium; laggards face fraud-driven delisting.
Crypto Atm Market Report Market Size (In Million)
750.0M
600.0M
450.0M
300.0M
150.0M
0
40.00 M
2024
60.00 M
2025
90.00 M
2026
140.0 M
2027
220.0 M
2028
350.0 M
2029
540.0 M
2030
Crypto Atm Market Report Market Size (In Million)
Year
Market Size
2024
40.00 M
2025
60.00 M
2026
90.00 M
2027
140.0 M
2028
220.0 M
2029
350.0 M
2030
540.0 M
What is the Crypto Atm Market Report?
A crypto ATM market report quantifies the global installed base, transaction throughput, revenue and competitive structure of physical kiosks that convert cash to cryptocurrency and back. It sizes hardware, software and services across one-way and two-way machines, and forecasts demand through 2035.
Scope: what this report covers and excludes
This report covers global crypto ATM hardware, embedded and cloud software, deployment services, and transaction-fee economics across commercial spaces, transportation hubs, retail and standalone units. It segments by type, offering, component, application and deployment mode.
This analysis does not cover: conventional bank ATM hardware, general cryptocurrency exchange/spot trading platforms, crypto payment gateways, or wallet custody services, except where they directly interface with ATM operations.
How big is the market for Crypto Atm Market Report?
The market sits near USD 0.06 Billion in 2025, with credible forecasts converging on USD 4.8 Billion by 2035. The gap between published estimates is small in CAGR terms but large in absolute dollars, because base-year definitions diverge sharply.
Estimate
Base year
Horizon
CAGR
Definition / scope
Attribution
USD 245.3 Million
2021
2030
54.2%
Crypto ATM solutions + services (narrow)
One published estimate
USD 0.0585 Billion
2025
2035
55.5%
Bitcoin ATM machines, hardware-led
A competing analysis
USD 4.83 Billion
2035
2035
55.5%
End-state machine market
A competing analysis
USD 0.0376 Billion
2024
2035
55.5%
Bitcoin ATM machine revenue
A competing analysis
Our analysis suggests the 2025 figure near USD 0.06 Billion is the most defensible base, because it reconciles installed-base counts against average annual revenue per machine. The 2021 USD 245 Million estimate embeds a broader definition (solutions plus services) and is best treated as a directional cross-check, not a base.
How is the market segmented?
The market splits along four non-geographic axes: machine type, offering, component and application. Type and application together determine capex and site economics; component and deployment determine margin structure.
Parent segment
Children
By Type
One-way (buy-only); Two-way (bidirectional)
By Offering
Hardware (display, printer, QR scanner, bill acceptor, vault); Software
By Component
Solution; Services
By Application
Commercial spaces; Restaurants; Transportation hubs; Standalone units
By Deployment
On-premise; Cloud-based
Two-way machines lead revenue because they support sell-side liquidity and repeat usage. Cloud-based deployment is the fastest-growing child segment, reflecting operator preference for remote KYC updates, firmware patching and fraud analytics across distributed fleets.
Which region leads in Crypto Atm Market Report?
North America leads with roughly 38% of the global installed base, anchored by aggressive US retail and convenience-store rollouts. Asia-Pacific is the fastest-growing region as cash-reliant economies adopt kiosk-based access.
Crypto Atm Market Report Regional Market Share
Loading chart...
Crypto Atm Market Report Regional Market Share
Region
Market Share (%)
North America
0.38%
Europe
0.24%
Asia-Pacific
0.28%
Latin America
0.06%
Middle East & Africa
0.04%
Global
North America (USA, Canada, Mexico)
Europe (Germany, UK, France, Italy)
Asia-Pacific (China, Japan, India, South Korea)
Latin America (Brazil, Mexico, Argentina)
Middle East & Africa (Saudi Arabia, UAE, South Africa)
Region
Share
North America
38%
Asia-Pacific
28%
Europe
24%
Latin America
6%
Middle East & Africa
4%
This divergence implies two distinct go-to-market models: a compliance-first, density-led model in North America where fraud controls determine survivability; and an access-led, low-capex model in Asia-Pacific where one-way machines and agent networks dominate.
What is driving growth — and what is holding it back?
Growth is powered by cryptocurrency adoption, retail expansion and clearer AML/KYC rulebooks; it is constrained by fraud losses, hardware security costs and uneven regulation across jurisdictions.
Factor
Direction
Evidence strength
Mechanism
Growing crypto ownership (~300M+ holders)
Driver
High
Expands addressable cash-to-crypto demand
Retail & transportation-hub expansion
Driver
High
Increases site availability and footfall
Regulatory clarity and AML/KYC compliance
Driver
Medium
Legitimizes operators, builds consumer trust
Biometric and multi-factor security upgrades
Driver
Medium
Lowers fraud, raises transaction confidence
Crypto-ATM fraud losses (~USD 120M tracked)
Restraint
High
Triggers chargebacks, delisting and reputation damage
Physical and cyber attack vectors
Restraint
Medium
Raises capex/opex on hardening and monitoring
Interchange and fee caps
Restraint
Low–Medium
Compresses take-rate per transaction
The balance favors growth: demand-side drivers are structural and compounding, while restraints are largely cost-and-compliance problems that scale with operator sophistication. Our analysis suggests the binding constraint is not demand but the cost of compliance per machine — which is precisely why software-led operators will out-earn hardware-only deployers.
Who are the leading vendors?
The vendor field is fragmented but consolidating around three archetypes: hardware manufacturers, software/platform providers and multi-site operators. Differentiation rests on uptime, compliance tooling and site pipeline.
Company
Archetype
Notable strength
Genesis Coin
Hardware manufacturer
Broad two-way machine portfolio
BitAccess
Hardware + software
Cloud management platform
General Bytes
Hardware manufacturer
BATMTwoUltra bidirectional line
Coinsource
Operator
Large US fleet, compliance focus
Bitstop
Operator + software
Retail and bank partnerships
Lamassu
Hardware manufacturer
Compact, low-footprint units
Coinme
Operator
Retail chain integration
Bitcoin Depot
Operator
Large-scale US deployment
Competitive moats are shifting from hardware specs to software and compliance. A machine is increasingly commoditized; the defensible assets are the KYC/AML engine, fraud-detection models, uptime record and retail site contracts. Vendors without a cloud control plane will struggle to service multi-hundred-unit fleets profitably.
What do buyers and operators need to know?
Selection should be driven by five mission-critical criteria: compliance certification (KYC/AML, local licensing), fleet management software maturity, biometric and tamper-resistance features, site pipeline support, and total cost of ownership per transaction. Procurement risk is concentrated in vendor stability — several hardware makers lack the software depth to support regulatory change.
Switching costs are non-trivial. Once a fleet is deployed, migrating the control plane means re-certifying compliance workflows, retraining staff and re-integrating payment rails — often a 6–12 month program. Buyers should therefore negotiate data portability and API access at contract signature, not at renewal. Regulatory exposure is the single largest risk: jurisdictions that tighten AML rules can render an installed base non-compliant overnight, so operators should contract for firmware-update SLAs tied to regulatory change.
Strategic Recommendations & Analyst Perspective
The balance of evidence favors the software-and-compliance layer over hardware as the value-capture point through 2035. Hardware revenue will grow, but margin will migrate to operators and platform providers who own the KYC/AML stack and the retail site relationships. The strongest counter-argument is that hardware makers could bundle software and reclaim margin — plausible for General Bytes and BitAccess, less so for smaller manufacturers without cloud capabilities.
A second-order effect deserves attention: as fraud losses attract regulatory scrutiny, the market will bifurcate into a licensed, auditable tier and a grey tier. The licensed tier will grow slower near-term but command higher take-rates and institutional partnerships. Our analysis suggests buyers should price compliance capability as a revenue asset, not a cost center.
Actionable strategy:
Operators: prioritize two-way machines in high-footfall retail and lock in multi-year site contracts before density saturates.
Investors: underwrite platform/software vendors with proven fleet uptime and regulatory-update cadence, not hardware unit sales.
Vendors: build biometric and AI fraud-detection into the base SKU to qualify for licensed-tier procurement.
What would change our conclusion: a coordinated global AML framework that lowers per-machine compliance cost, or a step-change in hardware pricing that re-commoditizes the software layer. Absent either, the compliance-first thesis holds.
Crypto Atm Market Report Regional Market Share
Higher Coverage
Lower Coverage
No Coverage
Crypto Atm Market Report REPORT HIGHLIGHTS
Research Methodology & Data Sources
Our rigorous research methodology combines multi-layered approaches with comprehensive quality assurance, ensuring precision, accuracy, and reliability in every market analysis.
Primary Research & Industry Fieldwork
Our research program applies a 70/30 primary-to-secondary split. In-depth interviews were conducted across the value chain with hardware manufacturers, software platform providers, multi-site ATM operators, retail site hosts and payment-rail partners. Interviews targeted decision-makers including VP of Fleet Operations, Heads of Compliance, Technical Directors and Commercial Operations Leads, ensuring both deployment economics and regulatory posture were captured.
Key Stakeholders Interviewed
Key Stakeholders Interviewed
Stakeholder Role
Interview Share (%)
Fleet Operations Leads
35%
Compliance & AML Heads
30%
Technical Directors
25%
Commercial Operations Leads
10%
Industry Ecosystem Breakdown
Industry Ecosystem Breakdown
Company Type
Representation (%)
Hardware Manufacturers
40%
Software & Platform Providers
30%
Multi-Site Operators
20%
Retail & Payment Partners
10%
Secondary Benchmarking & Public Trade Validation
Secondary validation draws on official multilateral trade and standards databases (UN Comtrade, WTO, US ITC, Eurostat), corporate annual filings and investor presentations (10-K, SEC filings), patent databases covering bill-acceptor and biometric modules, and recognized non-profit standards bodies including ISO and national AML supervisory publications. No competitor market-research filings are used as validation inputs.
Demand Modeling & Market Sizing Triangulation
We run simultaneous Top-Down and Bottom-Up models. The top-down model allocates macroeconomic self-service and digital-asset spending to the crypto ATM segment; the bottom-up model builds from installed-base counts, average revenue per machine and end-use site consumption. Divergence between the two is reconciled at the segment level.
Table 16: Europe Crypto Atm Market Report Revenue Billion Forecast, by Type 2020 & 2034
Frequently Asked Questions
1. How fast is the crypto ATM market growing?
Published forecasts converge on a CAGR near 55% through the mid-2030s, with 55.5% the most commonly cited figure. Growth is driven by cryptocurrency adoption, retail expansion and clearer AML/KYC rulebooks rather than by hardware innovation alone.
2. Which region has the most crypto ATMs?
North America leads with roughly 38% of the global installed base, driven by US retail and convenience-store rollouts. Asia-Pacific is the fastest-growing region as cash-reliant economies adopt kiosk-based access.
3. What is the difference between one-way and two-way crypto ATMs?
One-way machines only let users buy cryptocurrency with cash, while two-way machines support both buy and sell transactions. Two-way units lead revenue because sell-side liquidity drives repeat usage, but one-way units are the fastest-growing entry point.
4. What are the biggest risks for crypto ATM operators?
Fraud losses and tightening AML/KYC regulation are the dominant risks, followed by physical and cyber attack vectors. Operators that invest in biometric verification and cloud-based compliance tooling are best positioned to absorb these costs.
Figure 17: Europe Crypto Atm Market Report Revenue Share (%), by Offering 2026 & 2034
Figure 18: Europe Crypto Atm Market Report Revenue (Billion), by Component 2026 & 2034
Figure 19: Europe Crypto Atm Market Report Revenue Share (%), by Component 2026 & 2034
Figure 20: Europe Crypto Atm Market Report Revenue (Billion), by Application 2026 & 2034
Figure 21: Europe Crypto Atm Market Report Revenue Share (%), by Application 2026 & 2034
Figure 22: Europe Crypto Atm Market Report Revenue (Billion), by Deployment 2026 & 2034
Figure 23: Europe Crypto Atm Market Report Revenue Share (%), by Deployment 2026 & 2034
Figure 24: Europe Crypto Atm Market Report Revenue (Billion), by Country 2026 & 2034
Figure 25: Europe Crypto Atm Market Report Revenue Share (%), by Country 2026 & 2034
Figure 26: Asia Pacific Crypto Atm Market Report Revenue (Billion), by Type 2026 & 2034
Figure 27: Asia Pacific Crypto Atm Market Report Revenue Share (%), by Type 2026 & 2034
Figure 28: Asia Pacific Crypto Atm Market Report Revenue (Billion), by Offering 2026 & 2034
Figure 29: Asia Pacific Crypto Atm Market Report Revenue Share (%), by Offering 2026 & 2034
Figure 30: Asia Pacific Crypto Atm Market Report Revenue (Billion), by Component 2026 & 2034
Figure 31: Asia Pacific Crypto Atm Market Report Revenue Share (%), by Component 2026 & 2034
Figure 32: Asia Pacific Crypto Atm Market Report Revenue (Billion), by Application 2026 & 2034
Figure 33: Asia Pacific Crypto Atm Market Report Revenue Share (%), by Application 2026 & 2034
Figure 34: Asia Pacific Crypto Atm Market Report Revenue (Billion), by Deployment 2026 & 2034
Figure 35: Asia Pacific Crypto Atm Market Report Revenue Share (%), by Deployment 2026 & 2034
Figure 36: Asia Pacific Crypto Atm Market Report Revenue (Billion), by Country 2026 & 2034
Figure 37: Asia Pacific Crypto Atm Market Report Revenue Share (%), by Country 2026 & 2034
Figure 38: Latin America Crypto Atm Market Report Revenue (Billion), by Type 2026 & 2034
Figure 39: Latin America Crypto Atm Market Report Revenue Share (%), by Type 2026 & 2034
Figure 40: Latin America Crypto Atm Market Report Revenue (Billion), by Offering 2026 & 2034
Figure 41: Latin America Crypto Atm Market Report Revenue Share (%), by Offering 2026 & 2034
Figure 42: Latin America Crypto Atm Market Report Revenue (Billion), by Component 2026 & 2034
Figure 43: Latin America Crypto Atm Market Report Revenue Share (%), by Component 2026 & 2034
Figure 44: Latin America Crypto Atm Market Report Revenue (Billion), by Application 2026 & 2034
Figure 45: Latin America Crypto Atm Market Report Revenue Share (%), by Application 2026 & 2034
Figure 46: Latin America Crypto Atm Market Report Revenue (Billion), by Deployment 2026 & 2034
Figure 47: Latin America Crypto Atm Market Report Revenue Share (%), by Deployment 2026 & 2034
Figure 48: Latin America Crypto Atm Market Report Revenue (Billion), by Country 2026 & 2034
Figure 49: Latin America Crypto Atm Market Report Revenue Share (%), by Country 2026 & 2034
Figure 50: Middle East & Africa Crypto Atm Market Report Revenue (Billion), by Type 2026 & 2034
Figure 51: Middle East & Africa Crypto Atm Market Report Revenue Share (%), by Type 2026 & 2034
Figure 52: Middle East & Africa Crypto Atm Market Report Revenue (Billion), by Offering 2026 & 2034
Figure 53: Middle East & Africa Crypto Atm Market Report Revenue Share (%), by Offering 2026 & 2034
Figure 54: Middle East & Africa Crypto Atm Market Report Revenue (Billion), by Component 2026 & 2034
Figure 55: Middle East & Africa Crypto Atm Market Report Revenue Share (%), by Component 2026 & 2034
Figure 56: Middle East & Africa Crypto Atm Market Report Revenue (Billion), by Application 2026 & 2034
Figure 57: Middle East & Africa Crypto Atm Market Report Revenue Share (%), by Application 2026 & 2034
Figure 58: Middle East & Africa Crypto Atm Market Report Revenue (Billion), by Deployment 2026 & 2034
Figure 59: Middle East & Africa Crypto Atm Market Report Revenue Share (%), by Deployment 2026 & 2034
Figure 60: Middle East & Africa Crypto Atm Market Report Revenue (Billion), by Country 2026 & 2034
Figure 61: Middle East & Africa Crypto Atm Market Report Revenue Share (%), by Country 2026 & 2034
Table 17: Europe Crypto Atm Market Report Revenue Billion Forecast, by Offering 2020 & 2034
Table 18: Europe Crypto Atm Market Report Revenue Billion Forecast, by Component 2020 & 2034
Table 19: Europe Crypto Atm Market Report Revenue Billion Forecast, by Application 2020 & 2034
Table 20: Europe Crypto Atm Market Report Revenue Billion Forecast, by Deployment 2020 & 2034
Table 21: Europe Crypto Atm Market Report Revenue Billion Forecast, by Country 2020 & 2034