
Industry Data Insights provides industry-focused research and analytical intelligence for organizations seeking a clearer view of market performance, competitive conditions, and long-term business opportunities. Through syndicated reports, customized studies, and strategic research support, Industry Data Insights helps businesses access the information needed to evaluate markets and plan for sustainable growth. Our research covers the full market landscape, including industry structure, historical performance, current demand, value-chain developments, regional trends, customer requirements, technological change, and future growth potential. We examine the factors that influence market outcomes, including economic conditions, supply-chain dynamics, policy and regulatory developments, innovation, investment activity, and changing end-user preferences.
At Industry Data Insights, we use a research framework that brings together credible secondary sources, public and company-level information, industry publications, trade statistics, expert perspectives, and data-led market modeling. Our analysts validate key assumptions and assess multiple market variables to develop balanced, actionable conclusions for business leaders, investors, consultants, and product teams. Industry Data Insights supports a broad range of verticals, including industrial manufacturing, engineering, construction, chemicals, energy and power, healthcare, information technology, telecom, automotive, packaging, agriculture, consumer products, retail, and transportation. Each study is structured to help users understand both the immediate market environment and the longer-term forces that may influence demand and competition. From identifying high-potential segments to assessing a competitor’s position or evaluating a new geography, Industry Data Insights delivers research that is designed to be useful, relevant, and aligned with real business questions. Our goal is to turn industry data into strategic direction.



Nov 18 2026
234

Shweta Thorat
Research Associate
Access in-depth insights on industries, companies, trends, and global markets. Our expertly curated reports provide the most relevant data and analysis in a condensed, easy-to-read format.

See the similar reports
| Year | Market Size |
|---|---|
| 2025 | 102.5 B |
| 2026 | 106.0 B |
| 2027 | 110.3 B |
| 2028 | 114.9 B |
| 2029 | 119.6 B |
| 2030 | 124.5 B |
| 2031 | 129.6 B |
The U.S. household appliances market covers consumer spending on appliances used in private households for cooking, refrigeration, cleaning, laundry, and air treatment. It spans major appliances (refrigerators, ranges, dishwashers, washers, dryers, air conditioners) and small appliances (vacuum cleaners, coffee machines, air fryers, irons, personal-care devices).
This analysis covers the U.S. B2C household appliance market by product (major vs. small), distribution channel (hypermarkets, electronic stores, online), and technology (conventional vs. smart/connected), with a 2026–2033 forecast horizon. This analysis does not cover consumer electronics, fans and fan heaters, lamps and lighting, professional/commercial appliance sales, or aftermarket service and repair revenue.
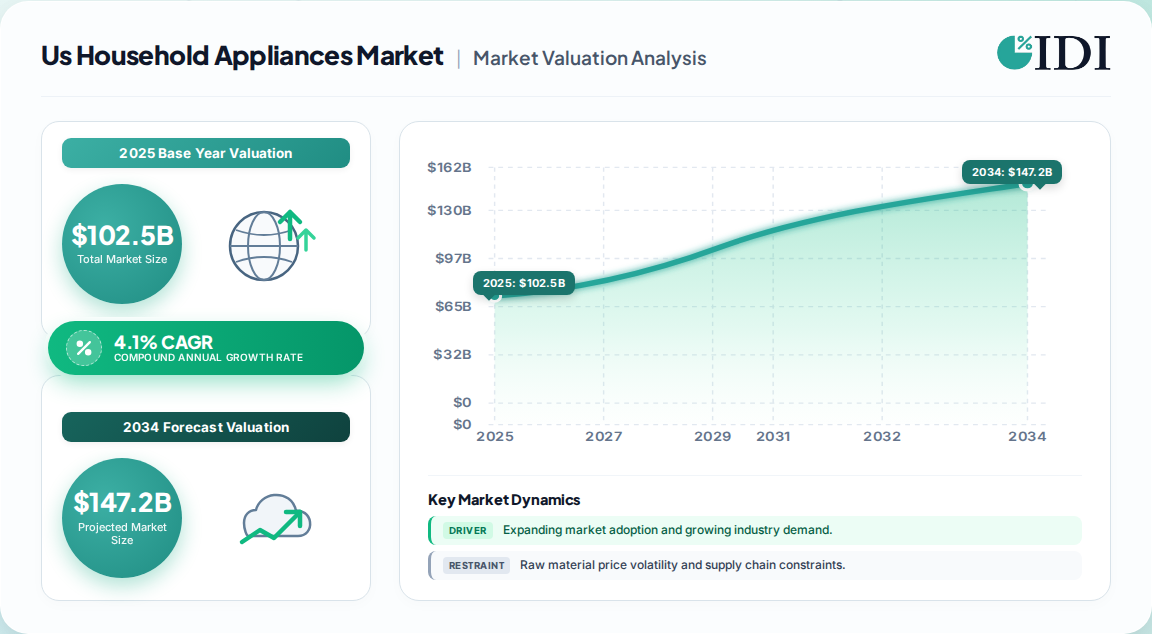
The most defensible 2025 base is USD 102.5 billion, which climbs to USD 106.0 billion in 2026 and USD 140.7 billion by 2033 at a 4.1% CAGR. Competing estimates differ mainly by definitional boundary — whether small appliances, air conditioners, and B2B volumes are included.
| Estimate | Base year | Horizon | CAGR | Definition / scope | Attribution |
|---|---|---|---|---|---|
| USD 102.5B (2025); USD 140.7B (2033) | 2025 | 2026–2033 | 4.1% | Broad B2C, major + small appliances, all channels | One published estimate |
| USD 87.26B (2025); USD 105.45B (2031) | 2025 | 2026–2031 | 3.21% | Home appliances excluding some small/personal-care items | A competing analysis |
| USD 90.06B (2026); USD 105.45B (2031) | 2026 | 2026–2031 | 3.21% | Same narrower definition, 2026 base | A competing analysis |
| USD 25.0B (2026, manufacturing revenue) | 2026 | 2026–2031 | -0.1% (2026) | Domestic production only, NAICS 33522 | Official-style industry benchmark |
Our analysis suggests the higher USD 102.5 billion figure is the better planning base for brands and retailers: it matches observed retail revenue and includes the fast-growing small-appliance and connected categories. The USD 25.0 billion manufacturing figure is a supply-side measure and has declined at a 2.6% CAGR over 2021–2026 — a divergence that implies U.S. consumption is increasingly served by imports rather than domestic output. For buyers, that means supply-chain and tariff exposure, not domestic capacity, is the binding constraint.
Segmentation follows three axes: product tier (major vs. small), distribution channel (electronic stores, hypermarkets, online), and technology (conventional vs. smart/connected). Major appliances dominate revenue, but small appliances and connected models drive incremental growth.
| Parent segment | Children | Share / growth signal |
|---|---|---|
| By Product | Major Appliances (refrigerators, freezers, dishwashers, washers, dryers, ranges, cooktops, ovens, air conditioners); Small Appliances (vacuums, coffee machines, air fryers, irons, personal care, toasters) | Major 87.1% share (2025); Small 5.9% CAGR |
| By Distribution Channel | Hypermarkets & Supermarkets; Electronic Stores; Online | Electronic stores 40.9% (2025); online fastest-growing |
| By Technology | Conventional; Smart/Connected | Conventional 60.55% (2025); smart 15.95% CAGR |
| By Region | South; West; Midwest; Northeast | South 36.35% (2025); West 5.48% CAGR |
The South leads with 36.35% of 2025 U.S. household appliance revenue, followed by the West, Midwest, and Northeast. The West is the fastest-growing region at a 5.48% CAGR through 2031, reflecting rapid household formation and higher smart-appliance adoption.
| Region | Market Share (%) |
|---|---|
| South | 0.36% |
| West | 0.24% |
| Midwest | 0.21% |
| Northeast | 0.18% |
| Region | 2025 revenue share | Growth outlook |
|---|---|---|
| South | 36.35% | Stable, above-average volume |
| West | 24.4% | Fastest, 5.48% CAGR |
| Midwest | 21.1% | Mature replacement demand |
| Northeast | 18.1% | Efficiency-led upgrades |
Regional demand is shaped by housing stock age, utility rebate programs, and climate. The South's volume leadership reflects population growth and large installed bases of air conditioning and refrigeration; the West's momentum reflects premium smart-home penetration and aggressive electrification incentives. Vendors should weight distribution and installer partnerships toward the South for scale, but prioritize the West for premium connected launches.
Growth is driven by replacement demand, energy-efficiency mandates, smart-home integration, and premium kitchen remodeling, partially offset by longer replacement cycles, high financing costs, and tariff-driven price inflation.
| Factor | Direction | Evidence strength | Mechanism |
|---|---|---|---|
| ENERGY STAR / DOE compliance cycle | Positive | High | Mandates shorten replacement timelines; 2028 cooking standard alone yields USD 1.6B consumer savings |
| Smart/IoT adoption (Matter 1.3) | Positive | High | +1.2% CAGR impact; interoperability reduces vendor lock-in hesitation |
| IRA heat-pump incentives | Positive | High | Up to USD 2,000 credit and USD 14,000 rebate accelerate high-efficiency upgrades |
| Premium modular kitchens | Positive | Medium | Built-in, coordinated suites lift average selling prices |
| Social-media-led small-appliance demand | Positive | Medium | Air fryers reached 60% household penetration by 2023 |
| Longer replacement cycles | Negative | High | Durable goods deferred amid financing costs |
| Tariffs and import dependence | Negative | Medium | Domestic manufacturing declined 2.6% CAGR 2021–2026, raising landed costs |
The balance favors growth, but the quality of growth is shifting: compliance-driven and incentive-driven purchases are less discretionary and more predictable than fashion-led small-appliance spikes. Our analysis suggests the 4.1% CAGR is achievable only if smart-feature attach rates keep rising; a stall in connected adoption would compress growth toward the 3.2% lower bound seen in narrower estimates.
The U.S. market is moderately concentrated: LG, GE Appliances, Whirlpool, and Samsung hold roughly 60.6% of major-appliance units, while Lowe's and Home Depot control more than three-quarters of retail volume.
| Company | Unit share (Q2 2026) | Dollar share | Position / moat |
|---|---|---|---|
| LG | 19.6% | 23.0% | Premium mix, +3.4 pt unit-to-dollar gap, ecosystem pull |
| GE Appliances (Haier) | 17.1% | 13.4% | Value-weighted volume, builder and SmartHQ channel |
| Whirlpool | 12.5% | 10.3% | Declining share; legacy brand, mass-market base |
| Samsung | 11.4% | 12.8% | Design-led, Bespoke AI; volume pressure |
| Lowe's | 41.0% retail units | 37.7% | Volume leader; weaker dollar-per-transaction |
| Home Depot | 35.5% retail units | 36.9% | Pro-oriented, higher ticket value |
Differentiation rests on three moats: connected ecosystems (LG and Samsung), builder and pro relationships (GE, Home Depot), and installed-base service networks. Whirlpool's 2.0-point unit decline in a single quarter shows that brand heritage alone no longer defends share when competitors bundle interoperability and premium design. Retailers, not manufacturers, increasingly control the final margin — Home Depot earns 1.4 points more dollar than unit share, while Lowe's gives up 3.3 points.
Procurement decisions should prioritize total cost of ownership, not sticker price. ENERGY STAR certification and DOE compliance dates are now commercial requirements: misaligned inventory can become unsellable at a standard change. Buyers should contractually require compliance-roadmap disclosure from suppliers.
Switching costs are rising for connected appliances. Matter 1.3 reduces lock-in at the protocol level, but app ecosystems, subscription services, and installer training still create friction. Operators should test interoperability before committing to a single platform, and should negotiate data-sharing and firmware-support terms explicitly.
The most under-priced risk is supply-chain concentration. With domestic manufacturing shrinking at a 2.6% CAGR, tariff and logistics shocks transmit directly to retail pricing. Dual-sourcing and domestic-assembly commitments are worth a premium in contract negotiations. Finally, channel economics differ sharply: the South rewards scale distribution, the West rewards premium assortment, and online requires installation and financing integration to convert.
The balance of evidence favors a value-over-volume strategy. The U.S. market will grow at roughly 4% annually, but nearly all incremental margin sits in connected, energy-efficient, and premium-design products. Vendors that compete on price alone face the same trajectory as Whirlpool — share loss despite rising consideration.
The strongest counter-argument is that affordability pressure and deferred replacement could suppress premium demand, pushing growth toward the 3.2% low end. That risk is real, but it argues for financing innovation and mid-tier connected products, not a retreat to conventional appliances, which still hold 60.55% of the base and are commoditizing fastest.
Actionable strategy:
What would change our conclusion: a sustained rise in interest rates that pushes replacement cycles beyond 12 years, or a regulatory rollback of IRA rebates, would shift the defensible CAGR toward 3.0–3.2% and favor value-tier portfolios.
A material shift in three indicators would revise the forecast: household appliance replacement age extending beyond 12 years, repeal or non-renewal of IRA heat-pump incentives, and a sustained decline in smart-appliance attach rates below 35%. Conversely, accelerated Matter adoption and new DOE standards would support the upper bound of 4.5%+ growth. Monitoring quarterly retail share and brand consideration data is the fastest way to detect inflection.
Our rigorous research methodology combines multi-layered approaches with comprehensive quality assurance, ensuring precision, accuracy, and reliability in every market analysis.
Our research employs a 70/30 primary-to-secondary split. In-depth interviews were conducted with executives across the value chain: component and raw-material suppliers, OEM appliance producers, contract manufacturers, national distributors, and major retail buying organizations. Respondents included VP-level Sourcing leads, Heads of Product R&D, Technical Directors for compliance and standards, and Commercial Operations Leads responsible for channel economics.
| Stakeholder Role | Interview Share (%) |
|---|---|
| Sourcing & Procurement Leads | 35% |
| Product R&D & Technical Directors | 30% |
| Commercial Operations & Channel Leads | 35% |
| Company Type | Representation (%) |
|---|---|
| OEM Appliance Producers | 40% |
| Component & Material Suppliers | 25% |
| National Distributors & Retailers | 35% |
We triangulate primary findings against official multilateral and national databases, including UN Comtrade, WTO trade statistics, U.S. International Trade Commission filings, and Eurostat Comext. Corporate annual reports (10-K and SEC filings), investor presentations, patent databases, and recognized technical standards bodies — including ENERGY STAR, DOE appliance standards, and Matter connectivity specifications — provide independent validation.
We run simultaneous top-down and bottom-up models. The top-down approach allocates macroeconomic household consumption and retail sales by segment and channel; the bottom-up approach models manufacturer capacity, product pricing, and end-use consumption by household cohort. Convergence between the two establishes the base-year size and growth path.
| Dimension | Analytical Scope | Methodology Applied | Validation Level |
|---|---|---|---|
| Base-Year Market Size | Value in USD for base year | Bottom-up production & revenue triangulation | High |
| Forecast Horizon | Multi-year compound projection | Historical CAGR, regression analysis & demand elasticity | High |
| Regional Distribution | Regional share breakdown | Cross-border trade flow analysis & regional consumption | High |
| Competitive Landscape | Leading market players | Annual reports, capacity mapping & commercial filings | High |
| Aspects | Details |
|---|---|
| Study Period | 2020-2034 |
| Base Year | 2025 |
| Estimated Year | 2026 |
| Forecast Period | 2026-2034 |
| Historical Period | 2020-2025 |
| Growth Rate | CAGR of 4.1% from 2020-2034 |
| Segmentation |
|
The U.S. household appliances market was valued at USD 102.5 billion in 2025 and is projected to reach USD 140.7 billion by 2033, growing at a 4.1% CAGR from 2026 to 2033.
Smart and connected appliances are the fastest-growing tier, with smart refrigerators expanding at an 11.86% CAGR through 2031, while small appliances grow at 5.9% annually.
LG leads with 19.6% of major-appliance units and 23.0% of dollars in Q2 2026, followed by GE Appliances, Whirlpool, and Samsung. Lowe's and Home Depot dominate retail.
The South accounted for 36.35% of U.S. household appliance revenue in 2025, while the West is the fastest-growing region at a 5.48% CAGR through 2031.
Replacement demand, ENERGY STAR and DOE compliance cycles, IRA heat-pump incentives, smart-home integration, and premium kitchen remodeling are the primary growth drivers.
