Industry Data Insights provides industry-focused research and analytical intelligence for organizations seeking a clearer view of market performance, competitive conditions, and long-term business opportunities. Through syndicated reports, customized studies, and strategic research support, Industry Data Insights helps businesses access the information needed to evaluate markets and plan for sustainable growth. Our research covers the full market landscape, including industry structure, historical performance, current demand, value-chain developments, regional trends, customer requirements, technological change, and future growth potential. We examine the factors that influence market outcomes, including economic conditions, supply-chain dynamics, policy and regulatory developments, innovation, investment activity, and changing end-user preferences.
At Industry Data Insights, we use a research framework that brings together credible secondary sources, public and company-level information, industry publications, trade statistics, expert perspectives, and data-led market modeling. Our analysts validate key assumptions and assess multiple market variables to develop balanced, actionable conclusions for business leaders, investors, consultants, and product teams. Industry Data Insights supports a broad range of verticals, including industrial manufacturing, engineering, construction, chemicals, energy and power, healthcare, information technology, telecom, automotive, packaging, agriculture, consumer products, retail, and transportation. Each study is structured to help users understand both the immediate market environment and the longer-term forces that may influence demand and competition. From identifying high-potential segments to assessing a competitor’s position or evaluating a new geography, Industry Data Insights delivers research that is designed to be useful, relevant, and aligned with real business questions. Our goal is to turn industry data into strategic direction.
Healthy Vegetable Chips Market Report by Product (Vegetables(Root Vegetable, Leafy Green, Mixed), Fruits), by Processing (Plain & Salted, Spiced & Seasoned, Cheese-Flavored, Baked/Air-Fried, Vacuum-Fried, Others), by Distribution Channel (Offline(Supermarkets/Hypermarkets, Convenience Stores, Specialty), Online), by Ingredient Source (Plant-Based, Animal-Based Blends, Hybrid), by End Use (Retail, Foodservice), by North America (United States, Canada, Mexico), by Europe (Germany, UK, France, Italy, Spain), by Asia Pacific (China, Japan, India, South Korea, Australia), by Latin America (Brazil, Mexico, Argentina), by Middle East & Africa (Saudi Arabia, UAE, South Africa) Forecast 2026-2034
Access in-depth insights on industries, companies, trends, and global markets. Our expertly curated reports provide the most relevant data and analysis in a condensed, easy-to-read format.
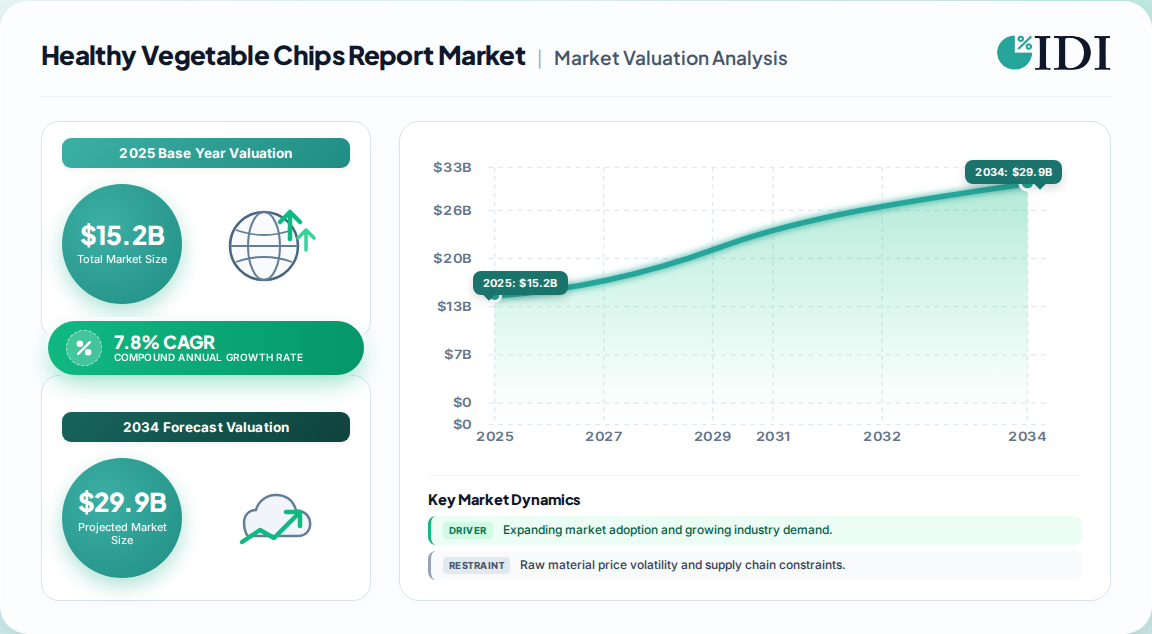
The global healthy vegetable chips category reached 15.2 Billion in 2025 and is forecast to hit 27.8 Billion by 2033, expanding at a disciplined 7.8% CAGR.
Offline retail still controls roughly 89% of value, but online is the fastest-growing channel, reshaping launch economics for emerging brands.
Vegetable-based chips hold 95.3% of the combined healthy fruit-and-vegetable chips pool; fruit chips remain a high-growth niche.
North America leads with 33.8% of global revenue; Asia Pacific posts the steepest regional CAGR through 2033.
The competitive set spans legacy giants (PepsiCo, Hain Celestial) and specialty insurgents (Kibo Foods, Bare Snacks, Rhythm Foods, Simply 7).
Why this matters for decision-makers: clean-label reformulation is now a license to operate, not a differentiator — vendors that fail to cut palm oil, artificial additives, and sodium risk shelf delisting and margin compression.
Healthy Vegetable Chips Market Report Market Size (In Billion)
25.0B
20.0B
15.0B
10.0B
5.0B
0
15.20 B
2025
16.40 B
2026
17.70 B
2027
19.10 B
2028
20.60 B
2029
22.20 B
2030
23.90 B
2031
Healthy Vegetable Chips Market Report Market Size (In Billion)
Year
Market Size
2025
15.20 B
2026
16.40 B
2027
17.70 B
2028
19.10 B
2029
20.60 B
2030
22.20 B
2031
23.90 B
What is the Healthy Vegetable Chips Market Report?
The Healthy Vegetable Chips Market Report quantifies the global value, volume, and segmentation of better-for-you snacks made from whole vegetables such as kale, beetroot, carrot, and sweet potato, typically baked, air-fried, or vacuum-fried rather than conventionally deep-fried, spanning retail and foodservice channels.
Scope: what this report covers and excludes
This analysis covers processed vegetable-based chip products sold through retail and foodservice channels across five regions, segmented by product, processing method, and distribution. This analysis does not cover fresh produce, conventional potato chips, vegetable juices, or powdered vegetable supplements.
How big is the market for Healthy Vegetable Chips Market Report?
The category is a double-digit-billion-dollar global snack vertical, but published estimates diverge sharply because "vegetable chips" is defined inconsistently across sources — some count only non-potato veggie chips, others fold in the full fruit-and-vegetable chip universe.
Estimate
Base Year
Horizon
CAGR
Definition / scope
Attribution
15.2 Billion
2025
2033
7.8%
Global healthy fruit and vegetable chips, retail value
One published estimate
2.1 Billion
2025
2035
7.2%
Non-potato veggie chips only, global
A competing analysis
60.5 Billion
2024
2030
6.7%
All fruit and vegetable chips incl. conventional processed
A competing analysis
6.70 Billion
2025
2031
7.61%
North America healthy snack chips (all substrates)
A competing analysis
1.15 Billion
2024
2035
7.97%
United States healthy vegetable chips only
A competing analysis
Our analysis suggests the 15.2 Billion figure is the most defensible anchor for this report: it isolates the healthy formulation from conventional processed vegetable chips while retaining full global coverage. The 60.5 Billion figure conflates healthy and mainstream products; the 2.1 Billion figure is a legitimate but narrow non-potato subset. Buyers should treat the 15.2→27.8 Billion trajectory as the planning baseline and apply the narrower 2.1→4.2 Billion band for dedicated non-potato SKU portfolios.
How is the market segmented?
Segmentation splits along three axes — product substrate, processing method, and distribution channel — with processing increasingly determining price tier and perceived health value.
Root vegetable chips (sweet potato, beet, carrot) hold the largest revenue share, driven by familiar taste and strong vitamin/antioxidant positioning. Leafy green chips — kale and spinach — dominate the non-potato niche and command premium pricing. Fruit chips are the fastest-growing substrate but remain a small share of total value.
Which region leads in Healthy Vegetable Chips Market Report?
North America leads the global healthy vegetable chips market with 33.8% revenue share in 2025, underpinned by the highest per-capita clean-label scrutiny and the deepest specialty retail shelf penetration.
The U.S. is the single largest country market and accounts for the bulk of North American value; Asia Pacific is the fastest-growing region as urban snacking habits and e-commerce penetration accelerate. Europe presents a premium organic-led opportunity but is restrained by fragmented retail and stricter labeling rules.
What is driving growth — and what is holding it back?
Growth is driven by a structural shift in snacking frequency and composition — roughly 88–94% of global consumers now snack daily, and two-thirds actively seek portion-controlled, better-for-you options.
Factor
Direction
Evidence strength
Mechanism
Clean-label and simple-ingredient demand
Driver
High
Rejection of palm oil, artificial additives, and long ingredient lists
Daily snacking normalization
Driver
High
Snacks replacing meals; 60% prefer smaller, more frequent eating
Plant-based and gluten-free preference
Driver
High
Flexitarian adoption drives kale, beet, lentil, and cassava substrates
Health-aware Gen Z / Millennial cohorts
Driver
Medium-High
Social-media nutrition content accelerates trial and repeat
Online grocery expansion
Driver
Medium
Lowers entry cost for niche brands, widens SKU discovery
High raw material and production cost
Restraint
High
Specialty vegetable sourcing and low-oil processing inflate unit cost
Short shelf life and texture instability
Restraint
Medium-High
Limits distribution radius and foodservice adoption
Competition from conventional chips
Restraint
High
Price and availability advantage of legacy potato snacks
Appetite-suppressant treatment adoption
Restraint
Emerging
Moderates volume expansion in high-income markets
The balance of evidence favors the drivers: demand-side forces are structural and multi-year, while restraints are largely cost and shelf-life problems that processing innovation (vacuum frying, air-frying, modified-atmosphere packaging) can progressively erode. The net effect is a durable high-single-digit CAGR rather than explosive growth.
Who are the leading vendors?
The competitive landscape is medium-concentration, with legacy snack giants buying into the category and specialty insurgents defending authenticity-led positions.
Company
Positioning
Core strength
PepsiCo
Legacy giant, portfolio reformulator
Distribution scale, clean-label commitments across Lay's/Tostitos
Chickpea and plant-protein chips, clean-label focus
Bare Snacks
Specialty
Baked apple and vegetable chips, no-additive positioning
Rhythm Foods
Specialty
Kale and superfood chips, premium health retail
Sensible Portions
Mainstream better-for-you
Veggie straws and chips, broad grocery penetration
Simply 7
Challenger
Lentil, quinoa, and veggie chips, allergen-friendly
Garden Veggie Snacks
Challenger
Vegetable-forward positioning, value tier
Differentiation rests on three moats: substrate authenticity (actual vegetable content versus vegetable-flavored starch), processing claims (baked/air-fried, no palm oil), and retail relationship depth. Legacy players win on distribution and shelf space; insurgents win on trust and premium positioning. Acquisition of niche brands by majors is a recurring route to scale.
What do buyers and operators need to know?
Procurement decisions in this category hinge on far more than unit price. Buyers must verify actual vegetable content and ingredient order on-pack, because "veggie" claims are inconsistently regulated and some products are starch-based with vegetable powder. Clean-label verification — no palm oil, no artificial colors, no added MSG — should be contractually specified, not assumed.
Shelf-life and texture stability are the primary operational risks. Baked and air-fried products have shorter shelf life and higher breakage rates than conventional chips, which raises shrink and limits long-haul distribution. Buyers should negotiate moisture-barrier packaging and coded freshness guarantees.
Regulatory compliance varies by market: U.S. labeling follows FDA nutrition and claim rules; EU markets enforce stricter health-claim and additive regulation; export markets may require country-of-origin and organic certification. Switching costs are moderate — reformulation to a new substrate or oil takes 6–12 months and requires re-validation of taste, texture, and shelf life, so supplier continuity matters. The gap between published category totals and reliable sub-segment forecasts is wide; precise SKU-level demand planning requires the full report's granular segmentation.
Strategic Recommendations & Analyst Perspective
The balance of evidence favors a selective growth thesis: the category will compound at roughly 7–8% through the early 2030s, but value will concentrate in clean-label, non-potato substrates and in channels that let niche brands bypass legacy shelf gatekeepers. The strongest counter-argument is cost-driven commoditization — if vacuum-frying and air-frying costs fall fast, mainstream potato-chip giants could flood the category with cheap "veggie" variants and compress specialty margins.
Our analysis suggests the more likely outcome is bifurcation: a value tier dominated by legacy brands and a premium tier defended by authenticity, organic certification, and functional claims. Investors should weight exposure toward brands with verifiable ingredient integrity and online-native distribution, not toward capacity alone.
For operators: prioritize a non-potato or leafy-green SKU with a documented no-palm-oil, baked/air-fried claim to capture premium shelf and e-commerce discovery.
For investors: favor assets with online channel momentum and clean-label certification, as these are the segments least exposed to legacy price competition.
For buyers: lock multi-year supply with texture and shelf-life SLAs, since reformulation switching costs are high and quality failures are the leading cause of delisting.
What would change this conclusion: a sharp, sustained fall in specialty vegetable input costs combined with regulatory tightening on "veggie" claims would shift advantage decisively toward scaled incumbents. Absent that, the premium clean-label tier remains the highest-value position.
Our rigorous research methodology combines multi-layered approaches with comprehensive quality assurance, ensuring precision, accuracy, and reliability in every market analysis.
Primary Research & Industry Fieldwork
Our research program applies a 70/30 primary-to-secondary split, with the majority of analytical effort devoted to direct industry engagement. We conduct in-depth interviews across the value chain, including raw vegetable suppliers and co-packers, specialized vegetable-chip producers, contract formulators and seasoning blenders, and global distributors and retail buyers. Within these organizations we target decision-makers including VP of Sourcing, Heads of R&D and Product Development, Technical and Quality Directors, and Commercial Operations Leads, ensuring both supply-side and demand-side perspectives are captured.
Key Stakeholders Interviewed
Key Stakeholders Interviewed
Stakeholder Role
Interview Share (%)
VP of Sourcing & Procurement
30%
Heads of R&D & Product Development
30%
Technical & Quality Directors
25%
Commercial Operations Leads
15%
Industry Ecosystem Breakdown
Industry Ecosystem Breakdown
Company Type
Representation (%)
Raw Vegetable Suppliers & Co-Packers
30%
Specialized Vegetable-Chip Producers
35%
Contract Formulators & Seasoning Blenders
20%
Global Distributors & Retail Buyers
15%
Secondary Benchmarking & Public Trade Validation
Secondary validation draws on official multilateral trade databases (UN Comtrade, WTO, US ITC, Eurostat), corporate annual filings and investor presentations (10-K, SEC filings), patent databases covering frying and dehydration technologies, and recognized non-profit technical standards and industry associations relevant to snack foods and nutrition labeling.
Demand Modeling & Market Sizing Triangulation
We run simultaneous top-down and bottom-up triangulation. The top-down model allocates macroeconomic snack-food spend to the healthy vegetable chip segment by region and channel; the bottom-up model aggregates manufacturer capacity, realized pricing, and end-use consumption across retail and foodservice. Divergences between the two are reconciled through channel checks and trade-flow analysis.
The global healthy fruit and vegetable chips market was valued at 15.2 Billion in 2025 and is projected to reach 27.8 Billion by 2033, growing at a 7.8% CAGR. Vegetable-based chips account for 95.3% of that value.
2. Which region leads the healthy vegetable chips market?
North America leads with 33.8% revenue share in 2025, driven by clean-label scrutiny and deep specialty retail penetration. Asia Pacific is the fastest-growing region through 2033, supported by urbanization and e-commerce expansion.
3. What are the main drivers of healthy vegetable chips demand?
Daily snacking normalization, clean-label preference, plant-based and gluten-free adoption, and health-aware Gen Z and Millennial cohorts are the primary drivers. Roughly 88–94% of global consumers now snack at least once daily.
4. Who are the leading companies in healthy vegetable chips?
Leading players include PepsiCo, Hain Celestial (TERRA), Kibo Foods, Bare Snacks, Rhythm Foods, Sensible Portions, Simply 7, and Garden Veggie Snacks. Legacy giants compete on distribution while insurgents defend authenticity and premium positioning.
5. What challenges restrain the healthy vegetable chips market?
High raw material and production costs, short shelf life, texture instability, and strong competition from conventional potato chips are the main restraints. These limit distribution radius and mass-market price competitiveness.
Figure 16: Europe Healthy Vegetable Chips Market Report Revenue (Billion), by Processing 2026 & 2034
Figure 17: Europe Healthy Vegetable Chips Market Report Revenue Share (%), by Processing 2026 & 2034
Figure 18: Europe Healthy Vegetable Chips Market Report Revenue (Billion), by Distribution Channel 2026 & 2034
Figure 19: Europe Healthy Vegetable Chips Market Report Revenue Share (%), by Distribution Channel 2026 & 2034
Figure 20: Europe Healthy Vegetable Chips Market Report Revenue (Billion), by Ingredient Source 2026 & 2034
Figure 21: Europe Healthy Vegetable Chips Market Report Revenue Share (%), by Ingredient Source 2026 & 2034
Figure 22: Europe Healthy Vegetable Chips Market Report Revenue (Billion), by End Use 2026 & 2034
Figure 23: Europe Healthy Vegetable Chips Market Report Revenue Share (%), by End Use 2026 & 2034
Figure 24: Europe Healthy Vegetable Chips Market Report Revenue (Billion), by Country 2026 & 2034
Figure 25: Europe Healthy Vegetable Chips Market Report Revenue Share (%), by Country 2026 & 2034
Figure 26: Asia Pacific Healthy Vegetable Chips Market Report Revenue (Billion), by Product 2026 & 2034
Figure 27: Asia Pacific Healthy Vegetable Chips Market Report Revenue Share (%), by Product 2026 & 2034
Figure 28: Asia Pacific Healthy Vegetable Chips Market Report Revenue (Billion), by Processing 2026 & 2034
Figure 29: Asia Pacific Healthy Vegetable Chips Market Report Revenue Share (%), by Processing 2026 & 2034
Figure 30: Asia Pacific Healthy Vegetable Chips Market Report Revenue (Billion), by Distribution Channel 2026 & 2034
Figure 31: Asia Pacific Healthy Vegetable Chips Market Report Revenue Share (%), by Distribution Channel 2026 & 2034
Figure 32: Asia Pacific Healthy Vegetable Chips Market Report Revenue (Billion), by Ingredient Source 2026 & 2034
Figure 33: Asia Pacific Healthy Vegetable Chips Market Report Revenue Share (%), by Ingredient Source 2026 & 2034
Figure 34: Asia Pacific Healthy Vegetable Chips Market Report Revenue (Billion), by End Use 2026 & 2034
Figure 35: Asia Pacific Healthy Vegetable Chips Market Report Revenue Share (%), by End Use 2026 & 2034
Figure 36: Asia Pacific Healthy Vegetable Chips Market Report Revenue (Billion), by Country 2026 & 2034
Figure 37: Asia Pacific Healthy Vegetable Chips Market Report Revenue Share (%), by Country 2026 & 2034
Figure 38: Latin America Healthy Vegetable Chips Market Report Revenue (Billion), by Product 2026 & 2034
Figure 39: Latin America Healthy Vegetable Chips Market Report Revenue Share (%), by Product 2026 & 2034
Figure 40: Latin America Healthy Vegetable Chips Market Report Revenue (Billion), by Processing 2026 & 2034
Figure 41: Latin America Healthy Vegetable Chips Market Report Revenue Share (%), by Processing 2026 & 2034
Figure 42: Latin America Healthy Vegetable Chips Market Report Revenue (Billion), by Distribution Channel 2026 & 2034
Figure 43: Latin America Healthy Vegetable Chips Market Report Revenue Share (%), by Distribution Channel 2026 & 2034
Figure 44: Latin America Healthy Vegetable Chips Market Report Revenue (Billion), by Ingredient Source 2026 & 2034
Figure 45: Latin America Healthy Vegetable Chips Market Report Revenue Share (%), by Ingredient Source 2026 & 2034
Figure 46: Latin America Healthy Vegetable Chips Market Report Revenue (Billion), by End Use 2026 & 2034
Figure 47: Latin America Healthy Vegetable Chips Market Report Revenue Share (%), by End Use 2026 & 2034
Figure 48: Latin America Healthy Vegetable Chips Market Report Revenue (Billion), by Country 2026 & 2034
Figure 49: Latin America Healthy Vegetable Chips Market Report Revenue Share (%), by Country 2026 & 2034
Figure 50: Middle East & Africa Healthy Vegetable Chips Market Report Revenue (Billion), by Product 2026 & 2034
Figure 51: Middle East & Africa Healthy Vegetable Chips Market Report Revenue Share (%), by Product 2026 & 2034
Figure 52: Middle East & Africa Healthy Vegetable Chips Market Report Revenue (Billion), by Processing 2026 & 2034
Figure 53: Middle East & Africa Healthy Vegetable Chips Market Report Revenue Share (%), by Processing 2026 & 2034
Figure 54: Middle East & Africa Healthy Vegetable Chips Market Report Revenue (Billion), by Distribution Channel 2026 & 2034
Figure 55: Middle East & Africa Healthy Vegetable Chips Market Report Revenue Share (%), by Distribution Channel 2026 & 2034
Figure 56: Middle East & Africa Healthy Vegetable Chips Market Report Revenue (Billion), by Ingredient Source 2026 & 2034
Figure 57: Middle East & Africa Healthy Vegetable Chips Market Report Revenue Share (%), by Ingredient Source 2026 & 2034
Figure 58: Middle East & Africa Healthy Vegetable Chips Market Report Revenue (Billion), by End Use 2026 & 2034
Figure 59: Middle East & Africa Healthy Vegetable Chips Market Report Revenue Share (%), by End Use 2026 & 2034
Figure 60: Middle East & Africa Healthy Vegetable Chips Market Report Revenue (Billion), by Country 2026 & 2034
Figure 61: Middle East & Africa Healthy Vegetable Chips Market Report Revenue Share (%), by Country 2026 & 2034
Table 16: Europe Healthy Vegetable Chips Market Report Revenue Billion Forecast, by Product 2020 & 2034
Table 17: Europe Healthy Vegetable Chips Market Report Revenue Billion Forecast, by Processing 2020 & 2034
Table 18: Europe Healthy Vegetable Chips Market Report Revenue Billion Forecast, by Distribution Channel 2020 & 2034
Table 19: Europe Healthy Vegetable Chips Market Report Revenue Billion Forecast, by Ingredient Source 2020 & 2034
Table 20: Europe Healthy Vegetable Chips Market Report Revenue Billion Forecast, by End Use 2020 & 2034
Table 21: Europe Healthy Vegetable Chips Market Report Revenue Billion Forecast, by Country 2020 & 2034