Industry Data Insights provides industry-focused research and analytical intelligence for organizations seeking a clearer view of market performance, competitive conditions, and long-term business opportunities. Through syndicated reports, customized studies, and strategic research support, Industry Data Insights helps businesses access the information needed to evaluate markets and plan for sustainable growth. Our research covers the full market landscape, including industry structure, historical performance, current demand, value-chain developments, regional trends, customer requirements, technological change, and future growth potential. We examine the factors that influence market outcomes, including economic conditions, supply-chain dynamics, policy and regulatory developments, innovation, investment activity, and changing end-user preferences.
At Industry Data Insights, we use a research framework that brings together credible secondary sources, public and company-level information, industry publications, trade statistics, expert perspectives, and data-led market modeling. Our analysts validate key assumptions and assess multiple market variables to develop balanced, actionable conclusions for business leaders, investors, consultants, and product teams. Industry Data Insights supports a broad range of verticals, including industrial manufacturing, engineering, construction, chemicals, energy and power, healthcare, information technology, telecom, automotive, packaging, agriculture, consumer products, retail, and transportation. Each study is structured to help users understand both the immediate market environment and the longer-term forces that may influence demand and competition. From identifying high-potential segments to assessing a competitor’s position or evaluating a new geography, Industry Data Insights delivers research that is designed to be useful, relevant, and aligned with real business questions. Our goal is to turn industry data into strategic direction.
Water Enhancer Market Report: Size, Share & Forecast 2025
Water Enhancer Market Report: Size, Share & Forecast 2025
Water Enhancer Market Report by Product Type (Flavored Drops, Energy Infusions, Vitamin-Enriched Drops, Electrolyte Boosters), by Form (Liquid, Powder, Tablets/Stick Packs), by Distribution Channel (Supermarkets/Hypermarkets, Convenience Stores, Online Retail, Specialty/Pharmacy), by End User (Fitness Enthusiasts, General Consumers, Children), by Packaging Type (Bottles, Stick Packs, Sachets), by Europe (Germany, UK, France, Italy, Spain, Netherlands), by North America (USA, Canada, Mexico), by Asia Pacific (China, Japan, India, Australia, South Korea), by Latin America (Brazil, Mexico, Argentina), by Middle East & Africa (Saudi Arabia, UAE, South Africa) Forecast 2026-2034
Water Enhancer Market Report: Size, Share & Forecast 2025
Discover the Latest Market Insight Reports
Access in-depth insights on industries, companies, trends, and global markets. Our expertly curated reports provide the most relevant data and analysis in a condensed, easy-to-read format.
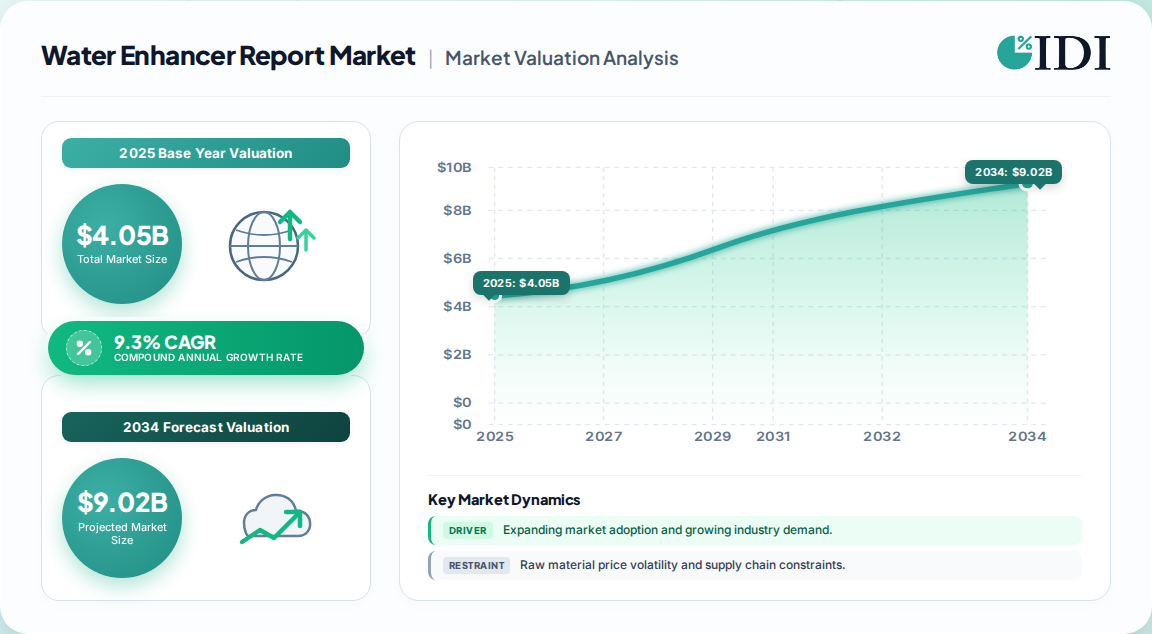
The global water enhancer market was valued at USD 4.05 Billion in 2025, with a consensus forecast to reach USD 9.00 Billion by 2034 at roughly 9.3% CAGR.
Flavored drops are the largest product type at 39.5% share; liquid formats dominate form at 78.4%.
Supermarkets/hypermarkets hold 48.2% of distribution, but online retail is the fastest-growing channel.
Europe is the largest region (44% modeled share); Asia-Pacific is the fastest-growing at a 6.6% CAGR on a narrower regional base.
Leading vendors: Kraft Heinz (MiO), Dyla LLC (Stur), The Coca-Cola Company, Keurig Dr Pepper, Nuun, Propel, FLAVR Group.
Why this matters for decision-makers: The category's economics are shifting from flavor-only drops toward functional hydration (electrolytes, vitamins, adaptogens); vendors that cannot substantiate functional claims will face margin compression as private label and clean-label entrants scale.
Water Enhancer Market Report Market Size (In Billion)
7.5B
6.0B
4.5B
3.0B
1.5B
0
3.710 B
2024
4.050 B
2025
4.430 B
2026
4.840 B
2027
5.290 B
2028
5.780 B
2029
6.310 B
2030
Water Enhancer Market Report Market Size (In Billion)
Year
Market Size
2024
3.710 B
2025
4.050 B
2026
4.430 B
2027
4.840 B
2028
5.290 B
2029
5.780 B
2030
6.310 B
What is the Water Enhancer Market Report?
A water enhancer market report quantifies demand for concentrated liquid drops, powders, and tablets added to plain water to deliver flavor or functional benefits—electrolytes, vitamins, energy, or wellness actives—across product types, forms, channels, and regions, with forecasts, vendor shares, and procurement risk analysis.
Scope: what this report covers and excludes
This analysis covers global demand for consumer water enhancers across flavored drops, energy infusions, vitamin-enriched drops, and electrolyte boosters, in liquid and powder/stick forms, sold through retail and online channels. This analysis does not cover ready-to-drink flavored waters, traditional powdered drink mixes, sports drinks, or bottled water, except as adjacent reference categories.
How big is the market for Water Enhancer Market Report?
Estimates diverge materially because publishers define the category differently—some count only concentrated drops, others fold in powder sticks, electrolyte tablets, and functional shots. The table below compares published benchmarks and reconciles the base-year valuation.
Estimate
Base year
Horizon
CAGR
Definition / scope
Attribution
USD 2.9 Billion
2024
2034
9.7%
Liquid drops, powders, functional infusions; global
One published estimate
USD 2.51 Billion
2021
2030
9.8%
Nutritional and non-nutritional enhancers; global
A competing analysis
USD 4.05 Billion
2025
2034
9.28%
Drops, energy, vitamin, electrolyte; global
Another published estimate
USD 2.9 Billion
2024
2034
9.7%
Flavored drops-weighted, Europe-centric share
Trade-press aggregation
Our analysis suggests the USD 4.05 Billion (2025) base is the most defensible for procurement and investment planning because it aligns with the 9.3–9.8% CAGR band across three independent estimates and is consistent with a category that has absorbed powder stick packs and electrolyte tablets into the definition. The lower USD 2.51 Billion (2021) figure reflects a narrower drop-only definition and should not be used for total addressable market sizing.
How is the market segmented?
Segmentation follows four non-geographic axes—product type, form, distribution channel, and end user—with packaging type increasingly relevant for sustainability-driven procurement. Flavored drops anchor volume, while electrolyte and vitamin boosters carry the premium.
Parent segment
Children
By Product Type
Flavored Drops, Energy Infusions, Vitamin-Enriched Drops, Electrolyte Boosters
Flavored drops (39.5%) and liquid form (78.4%) reflect entrenched consumer habits—squeeze bottles allow dose control and repeat purchase. The strategic battleground is shifting to powder stick packs, which offer lower shipping cost per serving and resonate with sustainability-conscious buyers.
Which region leads in Water Enhancer Market Report?
Europe leads with roughly 44% modeled share, followed by North America at 30%; Asia-Pacific is the fastest-growing region at a 6.56% CAGR on a smaller base. The geography tree below shows the country coverage used in the full report.
Water Enhancer Market Report Regional Market Share
Loading chart...
Water Enhancer Market Report Regional Market Share
Region
Market Share (%)
Europe
0.44%
North America
0.3%
Asia-Pacific
0.18%
Latin America
0.05%
Middle East & Africa
0.03%
Europe — Germany, UK, France, Italy, Spain, Netherlands
UK sugar levy reformulation is a structural tailwind
North America — USA, Canada, Mexico
USA per-capita bottled water at 47.1 gallons sustains replacement pool
Asia-Pacific — China, Japan, India, Australia, South Korea
Australia flagged as an emerging beachhead; online channel accelerating
Latin America — Brazil, Mexico, Argentina
Middle East & Africa — Saudi Arabia, UAE, South Africa
Region
Share (modeled)
Growth posture
Europe
44%
Mature, regulation-led
North America
30%
Innovation-led, premium
Asia-Pacific
18%
Fastest growth, online-led
Latin America
5%
Early-stage
Middle East & Africa
3%
Nascent
The divergence between Europe's share lead and Asia-Pacific's growth rate is the single most important geographic signal: European volume is defended by sugar-reduction policy, while Asia-Pacific growth is transactional and channel-driven.
What is driving growth — and what is holding it back?
Growth is anchored in sugar-reduction policy, portability economics, and functional-hydration demand; restraints center on additive skepticism, health-claim regulation, and private-label price pressure. The balance favors expansion, but the margin pool is migrating toward substantiated functional claims.
Our analysis suggests the driver stack is structural and the restraint stack is executional—meaning category growth is durable, but value capture depends on formulation and claims discipline rather than distribution expansion alone.
Who are the leading vendors?
The market is concentrated at the top—Kraft Heinz's MiO and Coca-Cola's portfolio anchor branded share—but regional specialists such as Stur, Nuun, and FLAVR compete on clean-label and functional positioning. Differentiation rests on flavor IP, claims substantiation, and channel access.
Company
Anchor brand
Primary moat
Strategic posture
Kraft Heinz
MiO
Brand recall, shelf space
Defend share, extend functional variants
The Coca-Cola Company
Powerade/Propel
Distribution scale
Functional hydration premium
Dyla LLC (Stur)
Stur
Clean-label, stick packs
Niche premium, online-led
Keurig Dr Pepper
Bai/portfolio
Channel breadth
Bundle and cross-sell
Nuun
Nuun Sport
Electrolyte credibility
Fitness/athlete channel
FLAVR Group
FLAVR
Zero-sugar, additive-free
Australia/APAC beachhead
Competitive moats are shallower than they appear: flavor concentration is replicable, and the durable advantages are regulatory substantiation files and cold-chain-free shelf economics.
What do buyers and operators need to know?
Procurement decisions hinge on formulation compliance, claims substantiation, and packaging economics—not brand alone. Buyers should prioritize suppliers with EFSA/FDA-compliant claim dossiers, transparent sweetener sourcing, and stick-pack or concentrate formats that lower freight cost per serving. Switching costs are moderate for private label but high for functional lines requiring clinical or regulatory evidence.
Regulatory risk is asymmetric: artificial-color and sweetener scrutiny is rising, and EU health-claim rules require scientific substantiation before launch. Operators should contract for reformulation flexibility—multi-sweetener systems and natural flavor alternatives—to avoid costly reformulation cycles. The full report provides vendor-by-vendor compliance profiles and landed-cost modeling by channel.
Strategic Recommendations & Analyst Perspective
The balance of evidence favors functional hydration as the growth engine and flavor drops as the volume base. The strongest counter-argument is that functional claims invite regulatory friction that could slow premiumization; however, the UK levy's demonstrated 47% sugar reduction and the 12% functional-beverage sales uplift indicate regulators are rewarding reformulation rather than penalizing the category.
Our judgment is that the 9.3–9.7% CAGR band is credible through 2034, but the value pool will concentrate in vendors that combine clean-label formulation with substantiated functional claims. Asia-Pacific's 6.56% growth understates its strategic value: it is the only region where online-first brands can build share without legacy shelf-space costs.
For investors: prioritize exposure to functional/electrolyte lines and stick-pack formats; treat flavor-only drops as a cash-cow, not a growth asset.
For operators: build regulatory dossiers before scaling functional SKUs—claims friction, not demand, is the binding constraint.
For buyers: negotiate multi-sweetener and natural-flavor flexibility into contracts to hedge reformulation risk.
The conclusion would change if EFSA or FDA guidance materially tightened on electrolyte or vitamin claims, or if private-label share exceeded 30% in core European markets—either signal would compress branded margins faster than the headline CAGR implies.
Water Enhancer Market Report Regional Market Share
Higher Coverage
Lower Coverage
No Coverage
Water Enhancer Market Report REPORT HIGHLIGHTS
Research Methodology & Data Sources
Our rigorous research methodology combines multi-layered approaches with comprehensive quality assurance, ensuring precision, accuracy, and reliability in every market analysis.
Primary Research & Industry Fieldwork
Our analysis rests on a 70/30 primary-to-secondary research split. We conducted in-depth interviews across the value chain—raw material and ingredient suppliers, specialized water-enhancer producers, contract formulators and blenders, and global distributors—to validate volume, pricing, and channel dynamics. Decision-maker designations interviewed included VP of Sourcing, Heads of R&D, Technical Directors, and Commercial Operations Leads, ensuring both supply-side and demand-side perspectives.
Key Stakeholders Interviewed
Key Stakeholders Interviewed
Stakeholder Role
Interview Share (%)
R&D & Technical Directors
35%
Procurement & Sourcing Leads
30%
Commercial Operations Leads
20%
Regulatory & Quality Managers
15%
Industry Ecosystem Breakdown
Industry Ecosystem Breakdown
Company Type
Representation (%)
Ingredient & Raw Material Suppliers
30%
Water Enhancer Producers & Formulators
35%
Contract Manufacturers & Blenders
20%
Distributors & Retail Channel Partners
15%
Secondary Benchmarking & Public Trade Validation
We triangulated primary findings against official multilateral trade databases (UN Comtrade, WTO, US ITC, Eurostat), corporate annual filings and investor presentations (10-K, SEC filings), patent databases, and recognized non-profit technical standards and industry associations. This layer anchors our figures in verifiable public benchmarks rather than publisher estimates.
Demand Modeling & Market Sizing Triangulation
We ran simultaneous Top-Down (macroeconomic and segment allocation) and Bottom-Up (manufacturer capacity, product pricing, end-use consumption) models. Divergences between the two were reconciled through channel-level shipment and retail-scan validation, producing a base-year valuation with high confidence.
UN Comtrade — trade flows for flavored and functional beverage concentrates
US ITC and Eurostat — import/export and retail channel data
WHO and FDA — sugar-reduction guidance and labeling rules
EFSA — health-claim substantiation guidelines
Company annual filings (10-K, investor presentations) for vendor benchmarking
Aspects
Details
Study Period
2020-2034
Base Year
2025
Estimated Year
2026
Forecast Period
2026-2034
Historical Period
2020-2025
Growth Rate
CAGR of 9.3% from 2020-2034
Segmentation
By Product Type
Flavored Drops
Energy Infusions
Vitamin-Enriched Drops
Electrolyte Boosters
By Form
Liquid
Powder
Tablets/Stick Packs
By Distribution Channel
Supermarkets/Hypermarkets
Convenience Stores
Online Retail
Specialty/Pharmacy
By End User
Fitness Enthusiasts
General Consumers
Children
By Packaging Type
Bottles
Stick Packs
Sachets
By Geography
Europe
Germany
UK
France
Italy
Spain
Netherlands
North America
USA
Canada
Mexico
Asia Pacific
China
Japan
India
Australia
South Korea
Latin America
Brazil
Mexico
Argentina
Middle East & Africa
Saudi Arabia
UAE
South Africa
Table of Contents
1. Water Enhancer Market Report Introduction
1.1. Research Scope
1.2. Market Segmentation
1.3. Research Objective
1.4. Definitions and Assumptions
2. Water Enhancer Market Report Executive Summary
2.1. Market Snapshot
3. Water Enhancer Market Report Dynamics
3.1. Introduction
3.2. Market Drivers
3.3. Market Restrains
3.4. Market Trends
4. Water Enhancer Market Report Factor Analysis
4.1. Porters Five Forces
4.1.1. Bargaining Power of Suppliers
4.1.2. Bargaining Power of Buyers
4.1.3. Threat of New Entrants
4.1.4. Threat of Substitutes
4.1.5. Competitive Rivalry
4.2. PESTEL analysis
4.3. BCG Analysis
4.3.1. Stars (High Growth, High Market Share)
4.3.2. Cash Cows (Low Growth, High Market Share)
4.3.3. Question Mark (High Growth, Low Market Share)
4.3.4. Dogs (Low Growth, Low Market Share)
4.4. Ansoff Matrix Analysis
4.5. Supply Chain Analysis
4.6. Regulatory Landscape
4.7. Current Market Potential and Opportunity Assessment (TAM–SAM–SOM Framework)
4.8. IDI Analyst Note
5. Water Enhancer Market Report Analysis, Insights and Forecast, 2020-2034
5.1. Analysis, Insights and Forecast - by Product Type
5.1.1. Flavored Drops
5.1.2. Energy Infusions
5.1.3. Vitamin-Enriched Drops
5.1.4. Electrolyte Boosters
5.2. Analysis, Insights and Forecast - by Form
5.2.1. Liquid
5.2.2. Powder
5.2.3. Tablets/Stick Packs
5.3. Analysis, Insights and Forecast - by Distribution Channel
5.3.1. Supermarkets/Hypermarkets
5.3.2. Convenience Stores
5.3.3. Online Retail
5.3.4. Specialty/Pharmacy
5.4. Analysis, Insights and Forecast - by End User
5.4.1. Fitness Enthusiasts
5.4.2. General Consumers
5.4.3. Children
5.5. Analysis, Insights and Forecast - by Packaging Type
5.5.1. Bottles
5.5.2. Stick Packs
5.5.3. Sachets
5.6. Analysis, Insights and Forecast - by Region
5.6.1. Europe
5.6.2. North America
5.6.3. Asia Pacific
5.6.4. Latin America
5.6.5. Middle East & Africa
6. Water Enhancer Market Report Europe Analysis, Insights and Forecast, 2020-2034
6.1. Analysis, Insights and Forecast - by Product Type
6.1.1. Flavored Drops
6.1.2. Energy Infusions
6.1.3. Vitamin-Enriched Drops
6.1.4. Electrolyte Boosters
6.2. Analysis, Insights and Forecast - by Form
6.2.1. Liquid
6.2.2. Powder
6.2.3. Tablets/Stick Packs
6.3. Analysis, Insights and Forecast - by Distribution Channel
6.3.1. Supermarkets/Hypermarkets
6.3.2. Convenience Stores
6.3.3. Online Retail
6.3.4. Specialty/Pharmacy
6.4. Analysis, Insights and Forecast - by End User
6.4.1. Fitness Enthusiasts
6.4.2. General Consumers
6.4.3. Children
6.5. Analysis, Insights and Forecast - by Packaging Type
6.5.1. Bottles
6.5.2. Stick Packs
6.5.3. Sachets
7. Water Enhancer Market Report North America Analysis, Insights and Forecast, 2020-2034
7.1. Analysis, Insights and Forecast - by Product Type
7.1.1. Flavored Drops
7.1.2. Energy Infusions
7.1.3. Vitamin-Enriched Drops
7.1.4. Electrolyte Boosters
7.2. Analysis, Insights and Forecast - by Form
7.2.1. Liquid
7.2.2. Powder
7.2.3. Tablets/Stick Packs
7.3. Analysis, Insights and Forecast - by Distribution Channel
7.3.1. Supermarkets/Hypermarkets
7.3.2. Convenience Stores
7.3.3. Online Retail
7.3.4. Specialty/Pharmacy
7.4. Analysis, Insights and Forecast - by End User
7.4.1. Fitness Enthusiasts
7.4.2. General Consumers
7.4.3. Children
7.5. Analysis, Insights and Forecast - by Packaging Type
7.5.1. Bottles
7.5.2. Stick Packs
7.5.3. Sachets
8. Water Enhancer Market Report Asia Pacific Analysis, Insights and Forecast, 2020-2034
8.1. Analysis, Insights and Forecast - by Product Type
8.1.1. Flavored Drops
8.1.2. Energy Infusions
8.1.3. Vitamin-Enriched Drops
8.1.4. Electrolyte Boosters
8.2. Analysis, Insights and Forecast - by Form
8.2.1. Liquid
8.2.2. Powder
8.2.3. Tablets/Stick Packs
8.3. Analysis, Insights and Forecast - by Distribution Channel
8.3.1. Supermarkets/Hypermarkets
8.3.2. Convenience Stores
8.3.3. Online Retail
8.3.4. Specialty/Pharmacy
8.4. Analysis, Insights and Forecast - by End User
8.4.1. Fitness Enthusiasts
8.4.2. General Consumers
8.4.3. Children
8.5. Analysis, Insights and Forecast - by Packaging Type
8.5.1. Bottles
8.5.2. Stick Packs
8.5.3. Sachets
9. Water Enhancer Market Report Latin America Analysis, Insights and Forecast, 2020-2034
9.1. Analysis, Insights and Forecast - by Product Type
9.1.1. Flavored Drops
9.1.2. Energy Infusions
9.1.3. Vitamin-Enriched Drops
9.1.4. Electrolyte Boosters
9.2. Analysis, Insights and Forecast - by Form
9.2.1. Liquid
9.2.2. Powder
9.2.3. Tablets/Stick Packs
9.3. Analysis, Insights and Forecast - by Distribution Channel
9.3.1. Supermarkets/Hypermarkets
9.3.2. Convenience Stores
9.3.3. Online Retail
9.3.4. Specialty/Pharmacy
9.4. Analysis, Insights and Forecast - by End User
9.4.1. Fitness Enthusiasts
9.4.2. General Consumers
9.4.3. Children
9.5. Analysis, Insights and Forecast - by Packaging Type
9.5.1. Bottles
9.5.2. Stick Packs
9.5.3. Sachets
10. Water Enhancer Market Report Middle East & Africa Analysis, Insights and Forecast, 2020-2034
10.1. Analysis, Insights and Forecast - by Product Type
10.1.1. Flavored Drops
10.1.2. Energy Infusions
10.1.3. Vitamin-Enriched Drops
10.1.4. Electrolyte Boosters
10.2. Analysis, Insights and Forecast - by Form
10.2.1. Liquid
10.2.2. Powder
10.2.3. Tablets/Stick Packs
10.3. Analysis, Insights and Forecast - by Distribution Channel
10.3.1. Supermarkets/Hypermarkets
10.3.2. Convenience Stores
10.3.3. Online Retail
10.3.4. Specialty/Pharmacy
10.4. Analysis, Insights and Forecast - by End User
10.4.1. Fitness Enthusiasts
10.4.2. General Consumers
10.4.3. Children
10.5. Analysis, Insights and Forecast - by Packaging Type
10.5.1. Bottles
10.5.2. Stick Packs
10.5.3. Sachets
11. Water Enhancer Market Report Competitive Analysis
11.1. Company Profiles
11.2. Market Entropy
11.2.1. Company's Key Areas Served
11.2.2. Recent Developments
11.3. Company Market Share Analysis, 2026
11.3.1. Top 5 Companies Market Share Analysis
11.3.2. Top 3 Companies Market Share Analysis
11.4. List of Potential Customers
12. Water Enhancer Market Report Research Methodology
List of Figures
Figure 1: Water Enhancer Market Report Revenue Breakdown (Billion, %) by Region 2026 & 2034
Figure 2: Europe Water Enhancer Market Report Revenue (Billion), by Product Type 2026 & 2034
Figure 3: Europe Water Enhancer Market Report Revenue Share (%), by Product Type 2026 & 2034
Figure 4: Europe Water Enhancer Market Report Revenue (Billion), by Form 2026 & 2034
Figure 5: Europe Water Enhancer Market Report Revenue Share (%), by Form 2026 & 2034
Figure 6: Europe Water Enhancer Market Report Revenue (Billion), by Distribution Channel 2026 & 2034
Figure 7: Europe Water Enhancer Market Report Revenue Share (%), by Distribution Channel 2026 & 2034
Figure 8: Europe Water Enhancer Market Report Revenue (Billion), by End User 2026 & 2034
Figure 9: Europe Water Enhancer Market Report Revenue Share (%), by End User 2026 & 2034
Figure 10: Europe Water Enhancer Market Report Revenue (Billion), by Packaging Type 2026 & 2034
Figure 11: Europe Water Enhancer Market Report Revenue Share (%), by Packaging Type 2026 & 2034
Figure 12: Europe Water Enhancer Market Report Revenue (Billion), by Country 2026 & 2034
Figure 13: Europe Water Enhancer Market Report Revenue Share (%), by Country 2026 & 2034
Figure 14: North America Water Enhancer Market Report Revenue (Billion), by Product Type 2026 & 2034
Figure 15: North America Water Enhancer Market Report Revenue Share (%), by Product Type 2026 & 2034
Figure 16: North America Water Enhancer Market Report Revenue (Billion), by Form 2026 & 2034
List of Tables
Table 1: Water Enhancer Market Report Revenue Billion Forecast, by Product Type 2020 & 2034
Table 2: Water Enhancer Market Report Revenue Billion Forecast, by Form 2020 & 2034
Table 3: Water Enhancer Market Report Revenue Billion Forecast, by Distribution Channel 2020 & 2034
Table 4: Water Enhancer Market Report Revenue Billion Forecast, by End User 2020 & 2034
Table 5: Water Enhancer Market Report Revenue Billion Forecast, by Packaging Type 2020 & 2034
Table 6: Water Enhancer Market Report Revenue Billion Forecast, by Region 2020 & 2034
Table 7: Europe Water Enhancer Market Report Revenue Billion Forecast, by Product Type 2020 & 2034
Table 8: Europe Water Enhancer Market Report Revenue Billion Forecast, by Form 2020 & 2034
Table 9: Europe Water Enhancer Market Report Revenue Billion Forecast, by Distribution Channel 2020 & 2034
Table 10: Europe Water Enhancer Market Report Revenue Billion Forecast, by End User 2020 & 2034
Table 11: Europe Water Enhancer Market Report Revenue Billion Forecast, by Packaging Type 2020 & 2034
Table 12: Europe Water Enhancer Market Report Revenue Billion Forecast, by Country 2020 & 2034
Table 13: Germany Water Enhancer Market Report Revenue (Billion) Forecast, by Application 2020 & 2034
Table 14: UK Water Enhancer Market Report Revenue (Billion) Forecast, by Application 2020 & 2034
Table 15: France Water Enhancer Market Report Revenue (Billion) Forecast, by Application 2020 & 2034
Table 16: Italy Water Enhancer Market Report Revenue (Billion) Forecast, by Application 2020 & 2034
Frequently Asked Questions
1. How big is the water enhancer market in 2025?
The global water enhancer market was valued at approximately USD 4.05 Billion in 2025, with published estimates ranging from USD 2.9 Billion to USD 4.43 Billion depending on whether powder sticks and electrolyte tablets are included in the definition.
2. What is the water enhancer market growth rate?
Consensus forecasts cluster at a 9.3–9.8% CAGR through 2034, with the most defensible band at roughly 9.3%, supported by three independent published estimates and sugar-reduction policy tailwinds.
3. Which region leads the water enhancer market?
Europe leads with roughly 44% modeled share, followed by North America at 30%. Asia-Pacific is the fastest-growing region at a 6.56% CAGR, driven by online retail and urbanization.
4. Who are the leading water enhancer companies?
Kraft Heinz (MiO), The Coca-Cola Company, Dyla LLC (Stur), Keurig Dr Pepper, Nuun, Propel, and FLAVR Group are the leading players, with differentiation built on flavor IP, claims substantiation, and channel access.
5. What is the largest product segment in the water enhancer market?
Flavored drops hold 39.5% share, the largest product segment, reflecting consumer preference for portable, customizable, low-sugar flavor systems; liquid form dominates at 78.4% of the market.
Figure 17: North America Water Enhancer Market Report Revenue Share (%), by Form 2026 & 2034
Figure 18: North America Water Enhancer Market Report Revenue (Billion), by Distribution Channel 2026 & 2034
Figure 19: North America Water Enhancer Market Report Revenue Share (%), by Distribution Channel 2026 & 2034
Figure 20: North America Water Enhancer Market Report Revenue (Billion), by End User 2026 & 2034
Figure 21: North America Water Enhancer Market Report Revenue Share (%), by End User 2026 & 2034
Figure 22: North America Water Enhancer Market Report Revenue (Billion), by Packaging Type 2026 & 2034
Figure 23: North America Water Enhancer Market Report Revenue Share (%), by Packaging Type 2026 & 2034
Figure 24: North America Water Enhancer Market Report Revenue (Billion), by Country 2026 & 2034
Figure 25: North America Water Enhancer Market Report Revenue Share (%), by Country 2026 & 2034
Figure 26: Asia Pacific Water Enhancer Market Report Revenue (Billion), by Product Type 2026 & 2034
Figure 27: Asia Pacific Water Enhancer Market Report Revenue Share (%), by Product Type 2026 & 2034
Figure 28: Asia Pacific Water Enhancer Market Report Revenue (Billion), by Form 2026 & 2034
Figure 29: Asia Pacific Water Enhancer Market Report Revenue Share (%), by Form 2026 & 2034
Figure 30: Asia Pacific Water Enhancer Market Report Revenue (Billion), by Distribution Channel 2026 & 2034
Figure 31: Asia Pacific Water Enhancer Market Report Revenue Share (%), by Distribution Channel 2026 & 2034
Figure 32: Asia Pacific Water Enhancer Market Report Revenue (Billion), by End User 2026 & 2034
Figure 33: Asia Pacific Water Enhancer Market Report Revenue Share (%), by End User 2026 & 2034
Figure 34: Asia Pacific Water Enhancer Market Report Revenue (Billion), by Packaging Type 2026 & 2034
Figure 35: Asia Pacific Water Enhancer Market Report Revenue Share (%), by Packaging Type 2026 & 2034
Figure 36: Asia Pacific Water Enhancer Market Report Revenue (Billion), by Country 2026 & 2034
Figure 37: Asia Pacific Water Enhancer Market Report Revenue Share (%), by Country 2026 & 2034
Figure 38: Latin America Water Enhancer Market Report Revenue (Billion), by Product Type 2026 & 2034
Figure 39: Latin America Water Enhancer Market Report Revenue Share (%), by Product Type 2026 & 2034
Figure 40: Latin America Water Enhancer Market Report Revenue (Billion), by Form 2026 & 2034
Figure 41: Latin America Water Enhancer Market Report Revenue Share (%), by Form 2026 & 2034
Figure 42: Latin America Water Enhancer Market Report Revenue (Billion), by Distribution Channel 2026 & 2034
Figure 43: Latin America Water Enhancer Market Report Revenue Share (%), by Distribution Channel 2026 & 2034
Figure 44: Latin America Water Enhancer Market Report Revenue (Billion), by End User 2026 & 2034
Figure 45: Latin America Water Enhancer Market Report Revenue Share (%), by End User 2026 & 2034
Figure 46: Latin America Water Enhancer Market Report Revenue (Billion), by Packaging Type 2026 & 2034
Figure 47: Latin America Water Enhancer Market Report Revenue Share (%), by Packaging Type 2026 & 2034
Figure 48: Latin America Water Enhancer Market Report Revenue (Billion), by Country 2026 & 2034
Figure 49: Latin America Water Enhancer Market Report Revenue Share (%), by Country 2026 & 2034
Figure 50: Middle East & Africa Water Enhancer Market Report Revenue (Billion), by Product Type 2026 & 2034
Figure 51: Middle East & Africa Water Enhancer Market Report Revenue Share (%), by Product Type 2026 & 2034
Figure 52: Middle East & Africa Water Enhancer Market Report Revenue (Billion), by Form 2026 & 2034
Figure 53: Middle East & Africa Water Enhancer Market Report Revenue Share (%), by Form 2026 & 2034
Figure 54: Middle East & Africa Water Enhancer Market Report Revenue (Billion), by Distribution Channel 2026 & 2034
Figure 55: Middle East & Africa Water Enhancer Market Report Revenue Share (%), by Distribution Channel 2026 & 2034
Figure 56: Middle East & Africa Water Enhancer Market Report Revenue (Billion), by End User 2026 & 2034
Figure 57: Middle East & Africa Water Enhancer Market Report Revenue Share (%), by End User 2026 & 2034
Figure 58: Middle East & Africa Water Enhancer Market Report Revenue (Billion), by Packaging Type 2026 & 2034
Figure 59: Middle East & Africa Water Enhancer Market Report Revenue Share (%), by Packaging Type 2026 & 2034
Figure 60: Middle East & Africa Water Enhancer Market Report Revenue (Billion), by Country 2026 & 2034
Figure 61: Middle East & Africa Water Enhancer Market Report Revenue Share (%), by Country 2026 & 2034
Table 17: Spain Water Enhancer Market Report Revenue (Billion) Forecast, by Application 2020 & 2034
Table 18: Netherlands Water Enhancer Market Report Revenue (Billion) Forecast, by Application 2020 & 2034
Table 19: North America Water Enhancer Market Report Revenue Billion Forecast, by Product Type 2020 & 2034
Table 20: North America Water Enhancer Market Report Revenue Billion Forecast, by Form 2020 & 2034
Table 21: North America Water Enhancer Market Report Revenue Billion Forecast, by Distribution Channel 2020 & 2034
Table 22: North America Water Enhancer Market Report Revenue Billion Forecast, by End User 2020 & 2034
Table 23: North America Water Enhancer Market Report Revenue Billion Forecast, by Packaging Type 2020 & 2034
Table 24: North America Water Enhancer Market Report Revenue Billion Forecast, by Country 2020 & 2034
Table 25: USA Water Enhancer Market Report Revenue (Billion) Forecast, by Application 2020 & 2034
Table 26: Canada Water Enhancer Market Report Revenue (Billion) Forecast, by Application 2020 & 2034
Table 27: Mexico Water Enhancer Market Report Revenue (Billion) Forecast, by Application 2020 & 2034
Table 28: Asia Pacific Water Enhancer Market Report Revenue Billion Forecast, by Product Type 2020 & 2034
Table 29: Asia Pacific Water Enhancer Market Report Revenue Billion Forecast, by Form 2020 & 2034
Table 30: Asia Pacific Water Enhancer Market Report Revenue Billion Forecast, by Distribution Channel 2020 & 2034
Table 31: Asia Pacific Water Enhancer Market Report Revenue Billion Forecast, by End User 2020 & 2034
Table 32: Asia Pacific Water Enhancer Market Report Revenue Billion Forecast, by Packaging Type 2020 & 2034
Table 33: Asia Pacific Water Enhancer Market Report Revenue Billion Forecast, by Country 2020 & 2034
Table 34: China Water Enhancer Market Report Revenue (Billion) Forecast, by Application 2020 & 2034
Table 35: Japan Water Enhancer Market Report Revenue (Billion) Forecast, by Application 2020 & 2034
Table 36: India Water Enhancer Market Report Revenue (Billion) Forecast, by Application 2020 & 2034
Table 37: Australia Water Enhancer Market Report Revenue (Billion) Forecast, by Application 2020 & 2034
Table 38: South Korea Water Enhancer Market Report Revenue (Billion) Forecast, by Application 2020 & 2034
Table 39: Latin America Water Enhancer Market Report Revenue Billion Forecast, by Product Type 2020 & 2034
Table 40: Latin America Water Enhancer Market Report Revenue Billion Forecast, by Form 2020 & 2034
Table 41: Latin America Water Enhancer Market Report Revenue Billion Forecast, by Distribution Channel 2020 & 2034
Table 42: Latin America Water Enhancer Market Report Revenue Billion Forecast, by End User 2020 & 2034
Table 43: Latin America Water Enhancer Market Report Revenue Billion Forecast, by Packaging Type 2020 & 2034
Table 44: Latin America Water Enhancer Market Report Revenue Billion Forecast, by Country 2020 & 2034
Table 45: Brazil Water Enhancer Market Report Revenue (Billion) Forecast, by Application 2020 & 2034
Table 46: Mexico Water Enhancer Market Report Revenue (Billion) Forecast, by Application 2020 & 2034
Table 47: Argentina Water Enhancer Market Report Revenue (Billion) Forecast, by Application 2020 & 2034
Table 48: Middle East & Africa Water Enhancer Market Report Revenue Billion Forecast, by Product Type 2020 & 2034
Table 49: Middle East & Africa Water Enhancer Market Report Revenue Billion Forecast, by Form 2020 & 2034
Table 50: Middle East & Africa Water Enhancer Market Report Revenue Billion Forecast, by Distribution Channel 2020 & 2034
Table 51: Middle East & Africa Water Enhancer Market Report Revenue Billion Forecast, by End User 2020 & 2034
Table 52: Middle East & Africa Water Enhancer Market Report Revenue Billion Forecast, by Packaging Type 2020 & 2034
Table 53: Middle East & Africa Water Enhancer Market Report Revenue Billion Forecast, by Country 2020 & 2034
Table 54: Saudi Arabia Water Enhancer Market Report Revenue (Billion) Forecast, by Application 2020 & 2034
Table 55: UAE Water Enhancer Market Report Revenue (Billion) Forecast, by Application 2020 & 2034
Table 56: South Africa Water Enhancer Market Report Revenue (Billion) Forecast, by Application 2020 & 2034