Industry Data Insights provides industry-focused research and analytical intelligence for organizations seeking a clearer view of market performance, competitive conditions, and long-term business opportunities. Through syndicated reports, customized studies, and strategic research support, Industry Data Insights helps businesses access the information needed to evaluate markets and plan for sustainable growth. Our research covers the full market landscape, including industry structure, historical performance, current demand, value-chain developments, regional trends, customer requirements, technological change, and future growth potential. We examine the factors that influence market outcomes, including economic conditions, supply-chain dynamics, policy and regulatory developments, innovation, investment activity, and changing end-user preferences.
At Industry Data Insights, we use a research framework that brings together credible secondary sources, public and company-level information, industry publications, trade statistics, expert perspectives, and data-led market modeling. Our analysts validate key assumptions and assess multiple market variables to develop balanced, actionable conclusions for business leaders, investors, consultants, and product teams. Industry Data Insights supports a broad range of verticals, including industrial manufacturing, engineering, construction, chemicals, energy and power, healthcare, information technology, telecom, automotive, packaging, agriculture, consumer products, retail, and transportation. Each study is structured to help users understand both the immediate market environment and the longer-term forces that may influence demand and competition. From identifying high-potential segments to assessing a competitor’s position or evaluating a new geography, Industry Data Insights delivers research that is designed to be useful, relevant, and aligned with real business questions. Our goal is to turn industry data into strategic direction.
Knitting Yarn Ball Retail Market Report: 2025 Industry Analysis
Knitting Yarn Ball Retail Market Report by Channel (Physical Stores, Online Channels, Wholesale), by Material (Cotton, Wool, Silk, Acrylic, Blends), by Weight (Sport, DK, Worsted, Bulky), by Yarn Form (Skein, Ball, Cone), by Texture (Smooth, Textured, Novelty), by End User (Individual Consumers, Commercial Users, Educational Institutions), by North America (USA, Canada, Mexico), by Europe (Germany, UK, France, Italy, Spain), by Asia Pacific (China, Japan, India, South Korea, Australia & New Zealand), by Latin America (Brazil, Argentina), by Middle East & Africa (Saudi Arabia, UAE, South Africa) Forecast 2026-2034
Knitting Yarn Ball Retail Market Report: 2025 Industry Analysis
Discover the Latest Market Insight Reports
Access in-depth insights on industries, companies, trends, and global markets. Our expertly curated reports provide the most relevant data and analysis in a condensed, easy-to-read format.
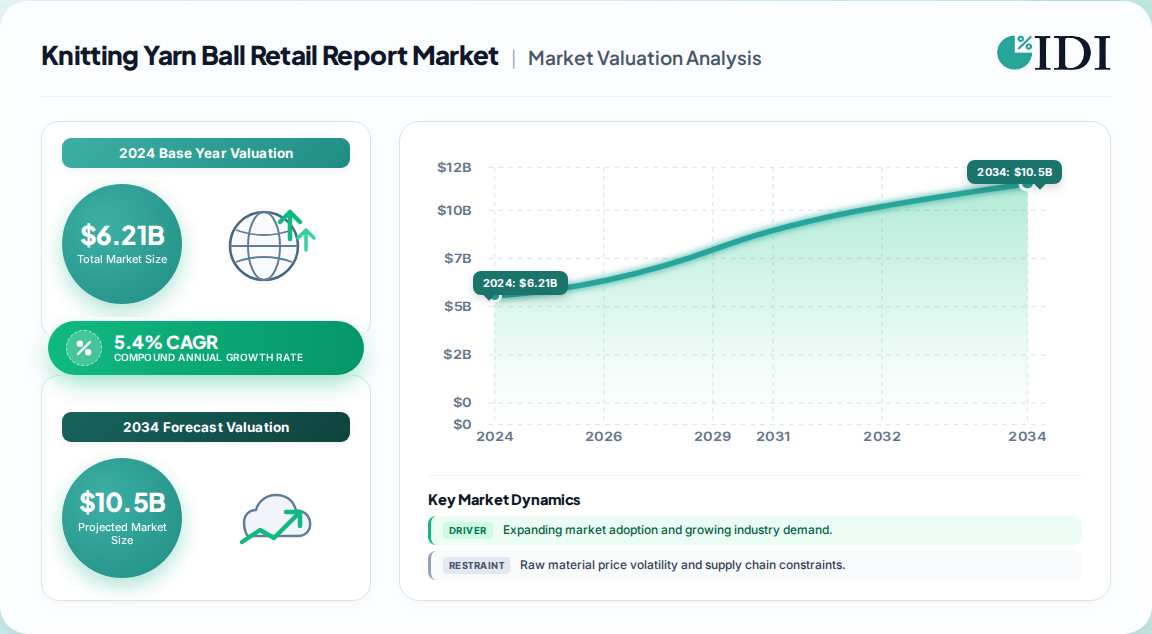
Market size: USD 6.21 Billion in 2024, with a base-case forecast of USD 9.89 Billion by 2033 at a 5.4% CAGR.
Growth divergence: Competing estimates range from USD 9.03 Billion (2034, 5.1% CAGR) to USD 11.1 Billion (2035, 5.40% CAGR), signaling definitional ambiguity in scope and base year.
Leading segment: Wool dominates materials at 56.2% revenue share (2024), while the online channel is the fastest-growing at a 6.6% CAGR.
Leading region: Europe holds 38.4% of global revenue, anchored by heritage mills and sustainability standards.
Vendor landscape: Lion Brand, Spinrite (Yarnspirations), Rowan, Cascade, and Hobbii lead a fragmented, low-concentration market.
Demand driver: The Craft Industry Alliance reports active crafters start ~19 projects annually, sustaining repeat replenishment cycles.
Why this matters for decision-makers: The next 3 years will reward vendors that resolve inventory complexity across dye lots and shade substitutions — the single greatest source of conversion loss and margin leakage in the category.
Knitting Yarn Ball Retail Market Report Market Size (In Billion)
10.0B
8.0B
6.0B
4.0B
2.0B
0
6.210 B
2024
6.550 B
2025
6.900 B
2026
7.270 B
2027
7.660 B
2028
8.080 B
2029
8.510 B
2030
Knitting Yarn Ball Retail Market Report Market Size (In Billion)
Year
Market Size
2024
6.210 B
2025
6.550 B
2026
6.900 B
2027
7.270 B
2028
7.660 B
2029
8.080 B
2030
8.510 B
What is the Knitting Yarn Ball Retail Market Report?
The knitting yarn ball retail market report is a comprehensive analysis of the global industry that sells yarn balls to hobbyists, crafters, and small apparel makers. It covers channel (physical vs. online), material (cotton, wool, silk, blends), pricing, and regional dynamics, providing decision-ready forecasts through 2033.
Scope: what this report covers and excludes
This report covers the global knitting yarn ball retail market across 2024–2033. It analyzes distribution channels (physical stores, online channels, wholesale), materials (cotton, wool, silk, acrylic, blends), weights (sport, DK, worsted, bulky), yarn forms (skein, ball, cone), textures (smooth, textured, novelty), and end users (individual, commercial, educational).
It excludes industrial textile manufacturing, automated knitted-garment production, adjacent craft categories (crochet hooks, weaving looms, macramé cord), and raw fiber commodity trading. This analysis does not cover apparel retail or fast fashion.
How big is the market for Knitting Yarn Ball Retail Market Report?
Multiple published benchmarks converge on a market of approximately USD 6.21 billion in 2024, but the forecast horizon and terminal value diverge meaningfully based on differing scope definitions and base-year adjustments. The table below reconciles the estimates.
Estimate
Base Year
Horizon
CAGR
Definition / scope
Attribution
USD 6.21 Bn
2024
2033
5.4%
Global retail sales of yarn balls by channel & material
One published estimate
USD 6.21 Bn
2024
2035
5.40%
Global retail, fiber-type segmented
A competing analysis
USD 5.73 Bn
2024
2035
5.66%
Global retail, channel & material segmented
A competing analysis
USD 5.64 Bn
2025
2034
5.1%
Global retail, channel & material segmented
A competing analysis
USD 8.4 Bn
2026
2036
5.0%
Global retail, yarn type & weight segmented
A competing analysis
Our analysis suggests the most defensible benchmark is the USD 6.21 billion base for 2024 with a 5.4% CAGR through 2033. This estimate aligns with the midpoint of competing CAGRs (5.0%–5.66%) and the most common scope definition (retail channel + material). The USD 8.4 billion 2026 figure is an outlier and likely includes wholesale or commercial volumes, inflating the base by 20–30%. Buyers should anchor on the 5.4–5.5% corridor.
How is the market segmented?
The knitting yarn ball retail market is segmented by channel, material, yarn weight, yarn form, texture, and end user. Physical stores remain dominant, but online is the fastest-growing channel at a 6.6% CAGR.
Material: Wool held 56.2% share in 2024, but cotton is forecast to grow at a significant rate due to breathability and hypoallergenic properties. Channel: Physical stores hold 81.0% of revenue, driven by tactile shopping preferences; online is the growth engine at 6.6% CAGR. End user: Individual consumers account for ~68% of demand, reflecting hobbyist-driven repeat purchases.
Which region leads in Knitting Yarn Ball Retail Market Report?
Europe leads the global knitting yarn ball retail market with 38.4% revenue share in 2024, anchored by heritage mills, design-led brands, and stringent sustainability credentials. North America follows with a robust crafting culture, while Asia-Pacific is the fastest-growing region due to rising DIY adoption.
Our analysis suggests Europe's dominance is structural, not cyclical: heritage brands (Rowan, Debbie Bliss, Sirdar) command premium pricing, and EU eco-labeling standards create a moat. Asia-Pacific's low base (22%) implies the highest incremental growth pool. Vendors seeking volume growth should prioritize China and India, where urbanization and social commerce are accelerating hobby adoption.
What is driving growth — and what is holding it back?
Growth is driven by rising DIY culture, e-commerce expansion, and sustainability trends. Restraints include inventory complexity across dye lots, seasonal demand volatility, and pressure on premium pricing. The net balance strongly favors growth, with demand outpacing supply-side constraints.
Factor
Direction
Evidence strength
Mechanism
Rising crafting popularity among 18–34s
Driver
High
40% of 18-34s engaged in knitting in past year
E-commerce expansion
Driver
High
Online channel growing at 6.6% CAGR
Sustainability demand
Driver
High
~60% of consumers will pay premium for eco-friendly
Community engagement
Driver
Medium
~50% of knitters attend workshops or events
Inventory complexity (dye lots, substitutions)
Restraint
High
Causes conversion loss and project incompletion
Fiber price volatility
Restraint
Medium
Wool and cotton commodity swings compress margins
Seasonality (Q4 weighting)
Restraint
Medium
Concentrated holiday gifting demand
Our analysis suggests the driver-restraint balance is more nuanced than headline CAGRs imply. While demand-side forces are robust, the operational constraint — managing dye-lot consistency and shade replenishment — is the binding constraint on revenue realization. Retailers that solve for inventory fidelity will capture outsized share of the growing base.
Who are the leading vendors?
The market is fragmented with moderate-to-low concentration. Leaders differentiate through brand heritage, fiber innovation, and omnichannel reach. No single vendor exceeds 10% global share, creating a competitive landscape where niche specialization thrives.
Company
Headquarters
Primary strength
Differentiation
Lion Brand Yarn
USA
Brand recognition, mass-market reach
Broad distribution, accessible pricing
Spinrite (Yarnspirations: Bernat, Red Heart, Patons)
Canada
Portfolio breadth
Multi-brand strategy across price tiers
Rowan Yarns
UK
Premium heritage
Design-led, luxury positioning
Cascade Yarns
USA
Value-premium balance
Strong LYS relationships
Hobbii
Denmark
Online-first, community
Subscription and bundle strategy
Schachenmayr
Germany
European heritage
Quality and sustainability credentials
Differentiation hinges on three axes: fiber provenance (mulesing-free wool, organic cotton), colorway curation (hand-dyed, limited drops), and educational attachment (patterns, tutorials, kits). Competitive moats are built through LYS partnerships, designer collaborations, and dye-lot reliability — not through price alone. Private labels are gaining share at entry-level, squeezing mid-tier brands.
What do buyers and operators need to know?
Buyers and operators must prioritize dye-lot consistency and shade replenishment above all else. These are the mission-critical selection criteria in a category where project incompletion from mismatched shades is the primary source of customer churn. Switching costs are moderate but rising as consumers build pattern libraries tied to specific yarn weights and gauges.
Procurement risks include fiber price volatility (wool and cotton), supply chain concentration in dye-houses, and seasonal capacity crunches. Regulatory compliance is expanding: EU eco-labeling, mulesing-free certification, and organic fiber traceability are becoming table stakes for premium shelf space. Operators should also monitor the bifurcation between value private labels and indie premium brands — this is reshaping assortment economics and requiring tighter SKU governance to prevent choice overload.
Strategic Recommendations & Analyst Perspective
The balance of evidence favors a cautiously optimistic outlook: 5.4% CAGR is achievable, but the upside is concentrated in specific channels and geographies. The strongest counter-argument is that sustainability premiums may compress as value players enter the eco-segment, eroding the pricing power that currently justifies premium positioning. Our analysis suggests this risk is real but not imminent — certification costs create a near-term barrier.
Actionable Strategy:
Invest in inventory fidelity systems — retailers that solve dye-lot matching and shade replenishment will capture disproportionate repeat-purchase volume and reduce returns.
Prioritize Asia-Pacific for volume growth — the 22% base share implies the largest incremental pool; localize assortment for warmer climates (cotton, bamboo blends).
Build community-led attachment — workshops, subscription boxes, and pattern bundles lift lifetime value and defend against private-label encroachment.
What would change our conclusion: a sustained contraction in discretionary craft spending, or a structural shift toward automated knitwear that displaces hobbyist demand. Neither is visible in current data.
Methodology
Primary Research & Industry Fieldwork
Our analysis is built on a 70/30 primary-to-secondary research split. We conducted in-depth interviews with stakeholders across the value chain, including raw fiber suppliers, yarn spinners and dyers, contract manufacturers, specialty retailers, and global distributors. Decision-maker designations interviewed included VP of Sourcing, Heads of Merchandising, Category Directors, and Commercial Operations Leads.
Secondary Benchmarking & Public Trade Validation
We triangulated primary findings against official multilateral trade databases (UN Comtrade, WTO, Eurostat), corporate annual filings (10-K, SEC), patent databases, and recognized industry associations including The Craft Yarn Council and Textile Exchange. All benchmark data was cross-validated for scope consistency.
Demand Modeling & Market Sizing Triangulation
We employed simultaneous Top-Down (macroeconomic craft-spending allocation) and Bottom-Up (manufacturer capacity, pricing, and end-use consumption) modeling. Divergences between the two approaches were resolved through weighted reconciliation, with the bottom-up model anchoring base-year valuation.
Our rigorous research methodology combines multi-layered approaches with comprehensive quality assurance, ensuring precision, accuracy, and reliability in every market analysis.
Primary Research & Industry Fieldwork
Our analysis is built on a 70/30 primary-to-secondary research split. We conducted in-depth interviews with stakeholders across the value chain, including raw fiber suppliers, yarn spinners and dyers, contract manufacturers, specialty retailers, and global distributors. Decision-maker designations interviewed included VP of Sourcing, Heads of Merchandising, Category Directors, and Commercial Operations Leads.
Key Stakeholders Interviewed
Key Stakeholders Interviewed
Stakeholder Role
Interview Share (%)
VP of Sourcing
30%
Heads of Merchandising
30%
Category Directors
25%
Commercial Operations Leads
15%
Industry Ecosystem Breakdown
Industry Ecosystem Breakdown
Company Type
Representation (%)
Fiber Suppliers & Spinners
30%
Yarn Manufacturers & Dyers
35%
Retailers & Distributors
25%
Industry Associations
10%
Secondary Benchmarking & Public Trade Validation
We triangulated primary findings against official multilateral trade databases (UN Comtrade, WTO, Eurostat), corporate annual filings (10-K, SEC), patent databases, and recognized industry associations including The Craft Yarn Council and Textile Exchange. All benchmark data was cross-validated for scope consistency.
Demand Modeling & Market Sizing Triangulation
We employed simultaneous Top-Down (macroeconomic craft-spending allocation) and Bottom-Up (manufacturer capacity, pricing, and end-use consumption) modeling. Divergences between the two approaches were resolved through weighted reconciliation, with the bottom-up model anchoring base-year valuation.
Table 6: Knitting Yarn Ball Retail Market Report Revenue Billion Forecast, by End User 2020 & 2034
Table 7: Knitting Yarn Ball Retail Market Report Revenue Billion Forecast, by Region 2020 & 2034
Table 8: North America Knitting Yarn Ball Retail Market Report Revenue Billion Forecast, by Channel 2020 & 2034
Table 9: North America Knitting Yarn Ball Retail Market Report Revenue Billion Forecast, by Material 2020 & 2034
Table 10: North America Knitting Yarn Ball Retail Market Report Revenue Billion Forecast, by Weight 2020 & 2034
Table 11: North America Knitting Yarn Ball Retail Market Report Revenue Billion Forecast, by Yarn Form 2020 & 2034
Table 12: North America Knitting Yarn Ball Retail Market Report Revenue Billion Forecast, by Texture 2020 & 2034
Table 13: North America Knitting Yarn Ball Retail Market Report Revenue Billion Forecast, by End User 2020 & 2034
Table 14: North America Knitting Yarn Ball Retail Market Report Revenue Billion Forecast, by Country 2020 & 2034
Table 15: USA Knitting Yarn Ball Retail Market Report Revenue (Billion) Forecast, by Application 2020 & 2034
Frequently Asked Questions
1. How big is the knitting yarn ball retail market?
The global knitting yarn ball retail market was valued at USD 6.21 billion in 2024 and is projected to reach USD 9.89 billion by 2033, growing at a 5.4% CAGR. Europe leads with 38.4% revenue share.
2. What is the fastest-growing channel in knitting yarn retail?
The online channel is the fastest-growing segment at a 6.6% CAGR, driven by e-commerce accessibility, virtual craft communities, and subscription-based yarn boxes. Physical stores still hold 81% of revenue due to tactile shopping preferences.
3. Which material dominates the knitting yarn ball market?
Wool dominates with 56.2% revenue share in 2024, favored for warmth and durability. Cotton is forecast to grow significantly due to breathability, hypoallergenic properties, and demand for summer apparel and baby items.
4. Who are the leading companies in the knitting yarn ball retail market?
Key players include Lion Brand Yarn, Spinrite (Yarnspirations: Bernat, Red Heart, Patons), Rowan Yarns, Cascade Yarns, Hobbii, and Schachenmayr. The market is fragmented with no single vendor exceeding 10% global share.
5. What is driving growth in the knitting yarn ball market?
Growth is driven by rising DIY culture among 18–34s (40% engagement), e-commerce expansion (6.6% CAGR), sustainability demand (~60% willing to pay premium), and community engagement (~50% attend workshops).
Figure 16: Europe Knitting Yarn Ball Retail Market Report Revenue (Billion), by Channel 2026 & 2034
Figure 17: Europe Knitting Yarn Ball Retail Market Report Revenue Share (%), by Channel 2026 & 2034
Figure 18: Europe Knitting Yarn Ball Retail Market Report Revenue (Billion), by Material 2026 & 2034
Figure 19: Europe Knitting Yarn Ball Retail Market Report Revenue Share (%), by Material 2026 & 2034
Figure 20: Europe Knitting Yarn Ball Retail Market Report Revenue (Billion), by Weight 2026 & 2034
Figure 21: Europe Knitting Yarn Ball Retail Market Report Revenue Share (%), by Weight 2026 & 2034
Figure 22: Europe Knitting Yarn Ball Retail Market Report Revenue (Billion), by Yarn Form 2026 & 2034
Figure 23: Europe Knitting Yarn Ball Retail Market Report Revenue Share (%), by Yarn Form 2026 & 2034
Figure 24: Europe Knitting Yarn Ball Retail Market Report Revenue (Billion), by Texture 2026 & 2034
Figure 25: Europe Knitting Yarn Ball Retail Market Report Revenue Share (%), by Texture 2026 & 2034
Figure 26: Europe Knitting Yarn Ball Retail Market Report Revenue (Billion), by End User 2026 & 2034
Figure 27: Europe Knitting Yarn Ball Retail Market Report Revenue Share (%), by End User 2026 & 2034
Figure 28: Europe Knitting Yarn Ball Retail Market Report Revenue (Billion), by Country 2026 & 2034
Figure 29: Europe Knitting Yarn Ball Retail Market Report Revenue Share (%), by Country 2026 & 2034
Figure 30: Asia Pacific Knitting Yarn Ball Retail Market Report Revenue (Billion), by Channel 2026 & 2034
Figure 31: Asia Pacific Knitting Yarn Ball Retail Market Report Revenue Share (%), by Channel 2026 & 2034
Figure 32: Asia Pacific Knitting Yarn Ball Retail Market Report Revenue (Billion), by Material 2026 & 2034
Figure 33: Asia Pacific Knitting Yarn Ball Retail Market Report Revenue Share (%), by Material 2026 & 2034
Figure 34: Asia Pacific Knitting Yarn Ball Retail Market Report Revenue (Billion), by Weight 2026 & 2034
Figure 35: Asia Pacific Knitting Yarn Ball Retail Market Report Revenue Share (%), by Weight 2026 & 2034
Figure 36: Asia Pacific Knitting Yarn Ball Retail Market Report Revenue (Billion), by Yarn Form 2026 & 2034
Figure 37: Asia Pacific Knitting Yarn Ball Retail Market Report Revenue Share (%), by Yarn Form 2026 & 2034
Figure 38: Asia Pacific Knitting Yarn Ball Retail Market Report Revenue (Billion), by Texture 2026 & 2034
Figure 39: Asia Pacific Knitting Yarn Ball Retail Market Report Revenue Share (%), by Texture 2026 & 2034
Figure 40: Asia Pacific Knitting Yarn Ball Retail Market Report Revenue (Billion), by End User 2026 & 2034
Figure 41: Asia Pacific Knitting Yarn Ball Retail Market Report Revenue Share (%), by End User 2026 & 2034
Figure 42: Asia Pacific Knitting Yarn Ball Retail Market Report Revenue (Billion), by Country 2026 & 2034
Figure 43: Asia Pacific Knitting Yarn Ball Retail Market Report Revenue Share (%), by Country 2026 & 2034
Figure 44: Latin America Knitting Yarn Ball Retail Market Report Revenue (Billion), by Channel 2026 & 2034
Figure 45: Latin America Knitting Yarn Ball Retail Market Report Revenue Share (%), by Channel 2026 & 2034
Figure 46: Latin America Knitting Yarn Ball Retail Market Report Revenue (Billion), by Material 2026 & 2034
Figure 47: Latin America Knitting Yarn Ball Retail Market Report Revenue Share (%), by Material 2026 & 2034
Figure 48: Latin America Knitting Yarn Ball Retail Market Report Revenue (Billion), by Weight 2026 & 2034
Figure 49: Latin America Knitting Yarn Ball Retail Market Report Revenue Share (%), by Weight 2026 & 2034
Figure 50: Latin America Knitting Yarn Ball Retail Market Report Revenue (Billion), by Yarn Form 2026 & 2034
Figure 51: Latin America Knitting Yarn Ball Retail Market Report Revenue Share (%), by Yarn Form 2026 & 2034
Figure 52: Latin America Knitting Yarn Ball Retail Market Report Revenue (Billion), by Texture 2026 & 2034
Figure 53: Latin America Knitting Yarn Ball Retail Market Report Revenue Share (%), by Texture 2026 & 2034
Figure 54: Latin America Knitting Yarn Ball Retail Market Report Revenue (Billion), by End User 2026 & 2034
Figure 55: Latin America Knitting Yarn Ball Retail Market Report Revenue Share (%), by End User 2026 & 2034
Figure 56: Latin America Knitting Yarn Ball Retail Market Report Revenue (Billion), by Country 2026 & 2034
Figure 57: Latin America Knitting Yarn Ball Retail Market Report Revenue Share (%), by Country 2026 & 2034
Figure 58: Middle East & Africa Knitting Yarn Ball Retail Market Report Revenue (Billion), by Channel 2026 & 2034
Figure 59: Middle East & Africa Knitting Yarn Ball Retail Market Report Revenue Share (%), by Channel 2026 & 2034
Figure 60: Middle East & Africa Knitting Yarn Ball Retail Market Report Revenue (Billion), by Material 2026 & 2034
Figure 61: Middle East & Africa Knitting Yarn Ball Retail Market Report Revenue Share (%), by Material 2026 & 2034
Figure 62: Middle East & Africa Knitting Yarn Ball Retail Market Report Revenue (Billion), by Weight 2026 & 2034
Figure 63: Middle East & Africa Knitting Yarn Ball Retail Market Report Revenue Share (%), by Weight 2026 & 2034
Figure 64: Middle East & Africa Knitting Yarn Ball Retail Market Report Revenue (Billion), by Yarn Form 2026 & 2034
Figure 65: Middle East & Africa Knitting Yarn Ball Retail Market Report Revenue Share (%), by Yarn Form 2026 & 2034
Figure 66: Middle East & Africa Knitting Yarn Ball Retail Market Report Revenue (Billion), by Texture 2026 & 2034
Figure 67: Middle East & Africa Knitting Yarn Ball Retail Market Report Revenue Share (%), by Texture 2026 & 2034
Figure 68: Middle East & Africa Knitting Yarn Ball Retail Market Report Revenue (Billion), by End User 2026 & 2034
Figure 69: Middle East & Africa Knitting Yarn Ball Retail Market Report Revenue Share (%), by End User 2026 & 2034
Figure 70: Middle East & Africa Knitting Yarn Ball Retail Market Report Revenue (Billion), by Country 2026 & 2034
Figure 71: Middle East & Africa Knitting Yarn Ball Retail Market Report Revenue Share (%), by Country 2026 & 2034