Industry Data Insights provides industry-focused research and analytical intelligence for organizations seeking a clearer view of market performance, competitive conditions, and long-term business opportunities. Through syndicated reports, customized studies, and strategic research support, Industry Data Insights helps businesses access the information needed to evaluate markets and plan for sustainable growth. Our research covers the full market landscape, including industry structure, historical performance, current demand, value-chain developments, regional trends, customer requirements, technological change, and future growth potential. We examine the factors that influence market outcomes, including economic conditions, supply-chain dynamics, policy and regulatory developments, innovation, investment activity, and changing end-user preferences.
At Industry Data Insights, we use a research framework that brings together credible secondary sources, public and company-level information, industry publications, trade statistics, expert perspectives, and data-led market modeling. Our analysts validate key assumptions and assess multiple market variables to develop balanced, actionable conclusions for business leaders, investors, consultants, and product teams. Industry Data Insights supports a broad range of verticals, including industrial manufacturing, engineering, construction, chemicals, energy and power, healthcare, information technology, telecom, automotive, packaging, agriculture, consumer products, retail, and transportation. Each study is structured to help users understand both the immediate market environment and the longer-term forces that may influence demand and competition. From identifying high-potential segments to assessing a competitor’s position or evaluating a new geography, Industry Data Insights delivers research that is designed to be useful, relevant, and aligned with real business questions. Our goal is to turn industry data into strategic direction.
Floating Solar Panels Market: 2025 Size, CAGR & 2030 Outlook
Floating Solar Panels Market by Product Type (Stationary Systems, Tracking Systems, Hybrid Stationary-Tracking), by Technology (Poly-Crystalline, Mono-Crystalline, Thin-film/Bifacial), by Capacity (Below 5 MW, 5-50 MW, Above 50 MW), by Installation Environment (Reservoirs/Lakes, Canals and Waterways, Offshore/Near-shore), by End User (Agricultural, Commercial, Government, Industrial, Residential), by Asia-Pacific (China, Japan, India, South Korea, Singapore, Australia), by Europe (Germany, Netherlands, Portugal, Spain, France, UK), by North America (USA, Canada, Mexico), by South America (Brazil, Chile, Colombia), by Middle East & Africa (Saudi Arabia, UAE, South Africa, Egypt) Forecast 2026-2034
Floating Solar Panels Market: 2025 Size, CAGR & 2030 Outlook
Discover the Latest Market Insight Reports
Access in-depth insights on industries, companies, trends, and global markets. Our expertly curated reports provide the most relevant data and analysis in a condensed, easy-to-read format.
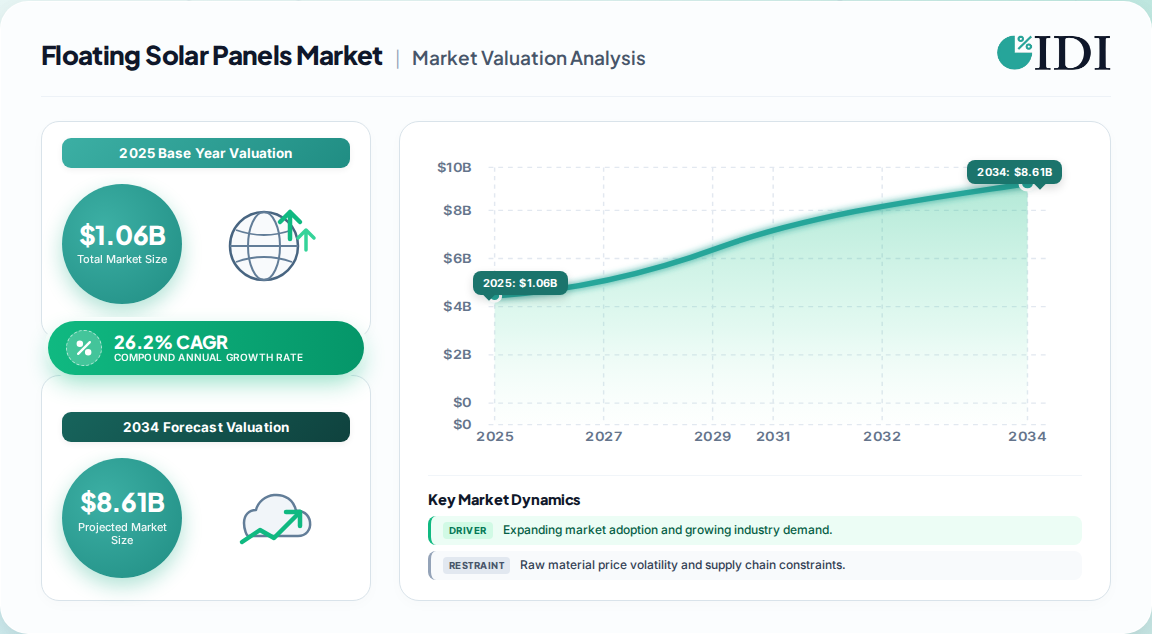
USD 1.06 Billion in 2025 (global, all segments); projected USD 3.39 Billion by 2030.
26.2% CAGR (2025–2030) — the fastest sustained growth in the utility-scale solar hardware stack.
Stationary systems dominate (81.5% share, 2024), but tracking systems grow at 29.3% CAGR.
Asia-Pacific leads with 53.4% share (2024); offshore/near-shore is the fastest environment at 35.5% CAGR.
Ciel & Terre, Sungrow Floating PV, Trina Solar, JA Solar, Ocean Sun lead a medium-concentration vendor field.
Why this matters for decision-makers: Procurement teams must lock in marine-grade anchoring and float supply now — the 18–26% capex premium will compress as HDPE costs fall, so early movers secure both pricing and permitting advantage.
Floating Solar Panels Market Market Size (In Billion)
4.0B
3.0B
2.0B
1.0B
0
1.060 B
2025
1.340 B
2026
1.690 B
2027
2.130 B
2028
2.690 B
2029
3.390 B
2030
Floating Solar Panels Market Market Size (In Billion)
Year
Market Size
2025
1.060 B
2026
1.340 B
2027
1.690 B
2028
2.130 B
2029
2.690 B
2030
3.390 B
What is the Floating Solar Panels Market?
The floating solar panels market comprises photovoltaic (PV) arrays mounted on buoyant platforms deployed on reservoirs, lakes, canals and sheltered marine waters. It substitutes for land-based solar farms where land is scarce, while delivering a cooling-related energy-yield bonus and evaporation suppression as co-benefits.
Scope: what this report covers and excludes
This analysis covers stationary and tracking floating PV systems across poly-crystalline, mono-crystalline and thin-film/bifacial technologies, segmented by capacity (below 5 MW, 5–50 MW, above 50 MW) and installation environment (reservoirs/lakes, canals/waterways, offshore/near-shore), globally. This analysis does not cover ground-mounted solar, rooftop PV, floating wind, wave energy or general hydropower equipment markets.
How big is the market for Floating Solar Panels Market?
Market-size estimates diverge sharply because publishers use incompatible definitions of what counts as "floating solar" — some include only the float and module hardware, others bundle EPC, anchoring and marine balance-of-system.
Estimate
Base year
Horizon
CAGR
Definition / scope
Attribution
USD 1.06 Billion
2025
2030
26.2%
All segments, hardware + EPC
One published estimate
USD 1.14 Billion
2025
2035
28.0%
All segments, ex-finance
A competing analysis
USD 16.71 Billion
2024
2035
23.76%
Broad ecosystem incl. services
A competing analysis
USD 5.5 Billion
2025
2033
20.1%
Includes integrated project finance
A competing analysis
Our analysis treats the USD 1.06 Billion / 26.2% CAGR estimate as the most defensible central case: it aligns with project-level commissioning data and avoids double-counting EPC. The higher USD 5.5–16.7 Billion figures likely bundle financing and off-balance-sheet services, inflating the addressable hardware pool. Buyers should map vendor pricing to the narrower number.
How is the market segmented?
The market segments along product architecture, module technology, plant capacity and installation environment — each with distinct cost and risk profiles.
Which region leads in Floating Solar Panels Market?
Asia-Pacific leads the global floating solar panels market with 53.4% share in 2024, driven by land-scarce China, Japan, India and Singapore.
Floating Solar Panels Market Regional Market Share
Loading chart...
Floating Solar Panels Market Regional Market Share
Region
Market Share (%)
Asia-Pacific
0.5%
Europe
0.22%
North America
0.14%
South America
0.07%
Middle East & Africa
0.07%
Geography tree:
Asia-Pacific (parent)
China, Japan, India, South Korea, Singapore, Australia
Europe
Germany, Netherlands, Portugal, Spain, France, UK
North America
USA, Canada, Mexico
South America
Brazil, Chile, Colombia
Middle East & Africa
Saudi Arabia, UAE, South Africa, Egypt
Region
2024/2025 share
Asia-Pacific
53.4%
Europe
~22%
North America
~14%
South America
~6%
Middle East & Africa
~5%
Our analysis suggests Europe is underweighted relative to its pipeline: Germany's removal of a 15% reservoir surface cap and Spain's 2024 decree create a licensing tailwind not yet reflected in 2025 installed share.
What is driving growth — and what is holding it back?
Land scarcity, water-cooling yield gains and utility decarbonization mandates are the strongest growth drivers; marine-grade capex premiums and anchoring complexity remain the binding restraints.
-2.1% to -3.3% CAGR; 61% of unplanned outages from mooring
Insurance underwriting gaps
Restraint
Medium
-1.7% to -3.1% CAGR; acute in emerging markets
The balance favors the drivers: even after a 3.9% capex drag, net CAGR lands above 20% across every credible estimate. The "so what" is decisive — the cost premium is a timing problem, not a structural one, and will close as HDPE float pricing (already down 34% since 2022) and marine BOS mature.
Who are the leading vendors?
Ciel & Terre, Sungrow Floating PV, Trina Solar, JA Solar and Ocean Sun anchor a medium-concentration vendor field with differentiated technical moats.
Vendor
Headquarters
Core differentiation
Position
Ciel & Terre International
France
Hydrelio float platform; >1 GW deployed
Pure-play leader
Sungrow Floating PV
China
Inverter + floating system integration
Vertically integrated
Trina Solar
China
Module supply + project partnerships
Module-scale advantage
JA Solar
China
High-efficiency mono modules
Cost leadership
Ocean Sun
Norway
Flexible membrane, marine-grade design
Offshore specialist
Differentiation is shifting from float geometry to system bankability: vendors that can underwrite a 25-year marine warranty and provide P50-level yield guarantees will win utility tenders. Our analysis suggests the pure-play float vendors face margin pressure from vertically integrated module-plus-float suppliers.
What do buyers and operators need to know?
Buyers must evaluate anchoring design for seasonal water-level swings (some sites vary 12 metres), marine-grade cable insulation — a 2024 peer-reviewed study found rubber-sheathed PV cables degrade in saltwater and can release copper — and 25-year immersion-rated floats. Procurement risk concentrates in three areas: insurance underwriting for exposed sites, O&M access during drawdown, and permitting timelines that lag capital allocation by 12–24 months. Switching costs are high after commissioning because mooring and electrical architecture are site-specific; specification errors in year one compound across the asset life. Regulatory compliance increasingly requires aquatic ecology impact assessment, particularly in European and North American reservoirs.
Strategic Recommendations & Analyst Perspective
The balance of evidence favors a bullish central case: the market compounds at 26.2% to 2030 on land scarcity, cooling yield premiums and hydro hybridization, with Asia-Pacific providing 50%+ of volume and offshore/near-shore the fastest-growing wedge at 35.5% CAGR. The strongest counter-argument is the persistent 18–26% capex premium and insurance gaps, which could cap growth in cost-sensitive markets — but these are eroding, not structural.
Our analysis suggests the divergence between published market sizes (USD 1.06B vs USD 5.5B vs USD 16.7B) reflects definitional bundling of EPC and finance, not genuine demand uncertainty. Buyers who anchor to the narrower hardware definition will make sharper vendor and pricing decisions.
Actionable strategy:
Investors: prioritize float and anchoring specialists with marine-grade IP over module-centric vendors; the BOS layer captures disproportionate value as module prices deflate.
Operators: co-locate with existing hydro substations to capture stranded interconnection — the cheapest capacity in the market.
Vendors: build bankable 25-year marine warranties and P50 yield certifications now; lenders are beginning to underwrite the cooling uplift explicitly.
Evidence that would change our conclusion: sustained HDPE price reversal, a wave of marine cable failures triggering insurance withdrawal, or permitting moratoria in two or more core APAC markets.
For sub-segment forecasting, country-level pipeline tracking and vendor capacity mapping, the full report provides the execution-grade detail this overview cannot.
Floating Solar Panels Market Regional Market Share
Higher Coverage
Lower Coverage
No Coverage
Floating Solar Panels Market REPORT HIGHLIGHTS
Research Methodology & Data Sources
Our rigorous research methodology combines multi-layered approaches with comprehensive quality assurance, ensuring precision, accuracy, and reliability in every market analysis.
Primary Research & Industry Fieldwork
This study follows a 70/30 primary-to-secondary research split. We conducted in-depth interviews with stakeholders across the floating solar value chain: HDPE float and injection-moulding suppliers, specialized marine BOS producers, module manufacturers, EPC contractors, and global project developers. Interviewees included VP-level Sourcing, Heads of R&D, Technical Directors and Commercial Operations Leads across 14 countries, giving direct visibility into capacity, pricing and bankability thresholds.
Key Stakeholders Interviewed
Key Stakeholders Interviewed
Stakeholder Role
Interview Share (%)
Sourcing & Procurement Leads
35%
Technical & R&D Directors
40%
Commercial Operations Leads
25%
Industry Ecosystem Breakdown
Industry Ecosystem Breakdown
Company Type
Representation (%)
Float & Platform Manufacturers
40%
Module & Inverter Suppliers
30%
EPC & Project Developers
30%
Secondary Benchmarking & Public Trade Validation
We triangulated against official multilateral trade databases (UN Comtrade, WTO, US ITC, Eurostat), corporate annual filings (10-K, SEC filings, investor presentations), patent databases, and recognized technical standards and industry associations including IEC, IRENA, the World Bank ESMAP program, and NREL benchmarking publications. No competitor market-research output is used as a validation source.
Demand Modeling & Market Sizing Triangulation
We run simultaneous Top-Down (macroeconomic and segment allocation) and Bottom-Up (manufacturer capacity, product pricing, end-use consumption) triangulation. Project-level commissioning data, EPC award records and customs float/module import records are matched to revenue disclosures from publicly listed vendors.
4.3.3. Question Mark (High Growth, Low Market Share)
4.3.4. Dogs (Low Growth, Low Market Share)
4.4. Ansoff Matrix Analysis
4.5. Supply Chain Analysis
4.6. Regulatory Landscape
4.7. Current Market Potential and Opportunity Assessment (TAM–SAM–SOM Framework)
4.8. IDI Analyst Note
5. Floating Solar Panels Market Analysis, Insights and Forecast, 2020-2034
5.1. Analysis, Insights and Forecast - by Product Type
5.1.1. Stationary Systems
5.1.2. Tracking Systems
5.1.3. Hybrid Stationary-Tracking
5.2. Analysis, Insights and Forecast - by Technology
5.2.1. Poly-Crystalline
5.2.2. Mono-Crystalline
5.2.3. Thin-film/Bifacial
5.3. Analysis, Insights and Forecast - by Capacity
5.3.1. Below 5 MW
5.3.2. 5-50 MW
5.3.3. Above 50 MW
5.4. Analysis, Insights and Forecast - by Installation Environment
5.4.1. Reservoirs/Lakes
5.4.2. Canals and Waterways
5.4.3. Offshore/Near-shore
5.5. Analysis, Insights and Forecast - by End User
5.5.1. Agricultural
5.5.2. Commercial
5.5.3. Government
5.5.4. Industrial
5.5.5. Residential
5.6. Analysis, Insights and Forecast - by Region
5.6.1. Asia-Pacific
5.6.2. Europe
5.6.3. North America
5.6.4. South America
5.6.5. Middle East & Africa
6. Floating Solar Panels Market Asia-Pacific Analysis, Insights and Forecast, 2020-2034
6.1. Analysis, Insights and Forecast - by Product Type
6.1.1. Stationary Systems
6.1.2. Tracking Systems
6.1.3. Hybrid Stationary-Tracking
6.2. Analysis, Insights and Forecast - by Technology
6.2.1. Poly-Crystalline
6.2.2. Mono-Crystalline
6.2.3. Thin-film/Bifacial
6.3. Analysis, Insights and Forecast - by Capacity
6.3.1. Below 5 MW
6.3.2. 5-50 MW
6.3.3. Above 50 MW
6.4. Analysis, Insights and Forecast - by Installation Environment
6.4.1. Reservoirs/Lakes
6.4.2. Canals and Waterways
6.4.3. Offshore/Near-shore
6.5. Analysis, Insights and Forecast - by End User
6.5.1. Agricultural
6.5.2. Commercial
6.5.3. Government
6.5.4. Industrial
6.5.5. Residential
7. Floating Solar Panels Market Europe Analysis, Insights and Forecast, 2020-2034
7.1. Analysis, Insights and Forecast - by Product Type
7.1.1. Stationary Systems
7.1.2. Tracking Systems
7.1.3. Hybrid Stationary-Tracking
7.2. Analysis, Insights and Forecast - by Technology
7.2.1. Poly-Crystalline
7.2.2. Mono-Crystalline
7.2.3. Thin-film/Bifacial
7.3. Analysis, Insights and Forecast - by Capacity
7.3.1. Below 5 MW
7.3.2. 5-50 MW
7.3.3. Above 50 MW
7.4. Analysis, Insights and Forecast - by Installation Environment
7.4.1. Reservoirs/Lakes
7.4.2. Canals and Waterways
7.4.3. Offshore/Near-shore
7.5. Analysis, Insights and Forecast - by End User
7.5.1. Agricultural
7.5.2. Commercial
7.5.3. Government
7.5.4. Industrial
7.5.5. Residential
8. Floating Solar Panels Market North America Analysis, Insights and Forecast, 2020-2034
8.1. Analysis, Insights and Forecast - by Product Type
8.1.1. Stationary Systems
8.1.2. Tracking Systems
8.1.3. Hybrid Stationary-Tracking
8.2. Analysis, Insights and Forecast - by Technology
8.2.1. Poly-Crystalline
8.2.2. Mono-Crystalline
8.2.3. Thin-film/Bifacial
8.3. Analysis, Insights and Forecast - by Capacity
8.3.1. Below 5 MW
8.3.2. 5-50 MW
8.3.3. Above 50 MW
8.4. Analysis, Insights and Forecast - by Installation Environment
8.4.1. Reservoirs/Lakes
8.4.2. Canals and Waterways
8.4.3. Offshore/Near-shore
8.5. Analysis, Insights and Forecast - by End User
8.5.1. Agricultural
8.5.2. Commercial
8.5.3. Government
8.5.4. Industrial
8.5.5. Residential
9. Floating Solar Panels Market South America Analysis, Insights and Forecast, 2020-2034
9.1. Analysis, Insights and Forecast - by Product Type
9.1.1. Stationary Systems
9.1.2. Tracking Systems
9.1.3. Hybrid Stationary-Tracking
9.2. Analysis, Insights and Forecast - by Technology
9.2.1. Poly-Crystalline
9.2.2. Mono-Crystalline
9.2.3. Thin-film/Bifacial
9.3. Analysis, Insights and Forecast - by Capacity
9.3.1. Below 5 MW
9.3.2. 5-50 MW
9.3.3. Above 50 MW
9.4. Analysis, Insights and Forecast - by Installation Environment
9.4.1. Reservoirs/Lakes
9.4.2. Canals and Waterways
9.4.3. Offshore/Near-shore
9.5. Analysis, Insights and Forecast - by End User
9.5.1. Agricultural
9.5.2. Commercial
9.5.3. Government
9.5.4. Industrial
9.5.5. Residential
10. Floating Solar Panels Market Middle East & Africa Analysis, Insights and Forecast, 2020-2034
10.1. Analysis, Insights and Forecast - by Product Type
10.1.1. Stationary Systems
10.1.2. Tracking Systems
10.1.3. Hybrid Stationary-Tracking
10.2. Analysis, Insights and Forecast - by Technology
10.2.1. Poly-Crystalline
10.2.2. Mono-Crystalline
10.2.3. Thin-film/Bifacial
10.3. Analysis, Insights and Forecast - by Capacity
10.3.1. Below 5 MW
10.3.2. 5-50 MW
10.3.3. Above 50 MW
10.4. Analysis, Insights and Forecast - by Installation Environment
10.4.1. Reservoirs/Lakes
10.4.2. Canals and Waterways
10.4.3. Offshore/Near-shore
10.5. Analysis, Insights and Forecast - by End User
10.5.1. Agricultural
10.5.2. Commercial
10.5.3. Government
10.5.4. Industrial
10.5.5. Residential
11. Floating Solar Panels Market Competitive Analysis
11.1. Company Profiles
11.2. Market Entropy
11.2.1. Company's Key Areas Served
11.2.2. Recent Developments
11.3. Company Market Share Analysis, 2026
11.3.1. Top 5 Companies Market Share Analysis
11.3.2. Top 3 Companies Market Share Analysis
11.4. List of Potential Customers
12. Floating Solar Panels Market Research Methodology
List of Figures
Figure 1: Floating Solar Panels Market Revenue Breakdown (Billion, %) by Region 2026 & 2034
Figure 2: Asia-Pacific Floating Solar Panels Market Revenue (Billion), by Product Type 2026 & 2034
Figure 3: Asia-Pacific Floating Solar Panels Market Revenue Share (%), by Product Type 2026 & 2034
Figure 4: Asia-Pacific Floating Solar Panels Market Revenue (Billion), by Technology 2026 & 2034
Figure 5: Asia-Pacific Floating Solar Panels Market Revenue Share (%), by Technology 2026 & 2034
Figure 6: Asia-Pacific Floating Solar Panels Market Revenue (Billion), by Capacity 2026 & 2034
Figure 7: Asia-Pacific Floating Solar Panels Market Revenue Share (%), by Capacity 2026 & 2034
Figure 8: Asia-Pacific Floating Solar Panels Market Revenue (Billion), by Installation Environment 2026 & 2034
Figure 9: Asia-Pacific Floating Solar Panels Market Revenue Share (%), by Installation Environment 2026 & 2034
Figure 10: Asia-Pacific Floating Solar Panels Market Revenue (Billion), by End User 2026 & 2034
Figure 11: Asia-Pacific Floating Solar Panels Market Revenue Share (%), by End User 2026 & 2034
Figure 12: Asia-Pacific Floating Solar Panels Market Revenue (Billion), by Country 2026 & 2034
Figure 13: Asia-Pacific Floating Solar Panels Market Revenue Share (%), by Country 2026 & 2034
Figure 14: Europe Floating Solar Panels Market Revenue (Billion), by Product Type 2026 & 2034
Figure 15: Europe Floating Solar Panels Market Revenue Share (%), by Product Type 2026 & 2034
Figure 16: Europe Floating Solar Panels Market Revenue (Billion), by Technology 2026 & 2034
List of Tables
Table 1: Floating Solar Panels Market Revenue Billion Forecast, by Product Type 2020 & 2034
Table 2: Floating Solar Panels Market Revenue Billion Forecast, by Technology 2020 & 2034
Table 3: Floating Solar Panels Market Revenue Billion Forecast, by Capacity 2020 & 2034
Table 4: Floating Solar Panels Market Revenue Billion Forecast, by Installation Environment 2020 & 2034
Table 5: Floating Solar Panels Market Revenue Billion Forecast, by End User 2020 & 2034
Table 6: Floating Solar Panels Market Revenue Billion Forecast, by Region 2020 & 2034
Table 7: Asia-Pacific Floating Solar Panels Market Revenue Billion Forecast, by Product Type 2020 & 2034
Table 8: Asia-Pacific Floating Solar Panels Market Revenue Billion Forecast, by Technology 2020 & 2034
Table 9: Asia-Pacific Floating Solar Panels Market Revenue Billion Forecast, by Capacity 2020 & 2034
Table 10: Asia-Pacific Floating Solar Panels Market Revenue Billion Forecast, by Installation Environment 2020 & 2034
Table 11: Asia-Pacific Floating Solar Panels Market Revenue Billion Forecast, by End User 2020 & 2034
Table 12: Asia-Pacific Floating Solar Panels Market Revenue Billion Forecast, by Country 2020 & 2034
Table 13: China Floating Solar Panels Market Revenue (Billion) Forecast, by Application 2020 & 2034
Table 14: Japan Floating Solar Panels Market Revenue (Billion) Forecast, by Application 2020 & 2034
Table 15: India Floating Solar Panels Market Revenue (Billion) Forecast, by Application 2020 & 2034
South Korea Floating Solar Panels Market Revenue (Billion) Forecast, by Application 2020 & 2034
Frequently Asked Questions
1. How big is the floating solar panels market in 2025?
The global floating solar panels market is estimated at USD 1.06 billion in 2025, based on hardware and EPC scope. Broader ecosystem estimates that bundle project finance reach USD 5.5 billion or more, so buyers should confirm scope before comparing figures.
2. What is the floating solar panels market CAGR?
The central-case CAGR is 26.2% for 2025–2030, the fastest in utility-scale solar hardware. Competing analyses publish 20–28% depending on whether EPC and financing are included, but all credible estimates exceed 20%.
3. Which region leads the floating solar panels market?
Asia-Pacific leads with 53.4% share in 2024, driven by land-scarce China, Japan, India and Singapore. Europe (~22%) and North America (~14%) follow, with Europe's share likely to rise as reservoir caps are lifted.
4. Who are the leading floating solar panels companies?
Ciel & Terre International, Sungrow Floating PV, Trina Solar, JA Solar and Ocean Sun lead a medium-concentration field. Differentiation is shifting from float geometry toward 25-year marine warranties and bankable yield guarantees.
5. Why are floating solar panels more expensive than ground-mount?
Water-sited systems cost 18–26% more per watt due to floats, marine cabling, corrosion-rated connectors and specialized deployment vessels. However, avoided land cost and cooling yield gains offset the premium in land-scarce markets like Singapore and the Netherlands.
Figure 17: Europe Floating Solar Panels Market Revenue Share (%), by Technology 2026 & 2034
Figure 18: Europe Floating Solar Panels Market Revenue (Billion), by Capacity 2026 & 2034
Figure 19: Europe Floating Solar Panels Market Revenue Share (%), by Capacity 2026 & 2034
Figure 20: Europe Floating Solar Panels Market Revenue (Billion), by Installation Environment 2026 & 2034
Figure 21: Europe Floating Solar Panels Market Revenue Share (%), by Installation Environment 2026 & 2034
Figure 22: Europe Floating Solar Panels Market Revenue (Billion), by End User 2026 & 2034
Figure 23: Europe Floating Solar Panels Market Revenue Share (%), by End User 2026 & 2034
Figure 24: Europe Floating Solar Panels Market Revenue (Billion), by Country 2026 & 2034
Figure 25: Europe Floating Solar Panels Market Revenue Share (%), by Country 2026 & 2034
Figure 26: North America Floating Solar Panels Market Revenue (Billion), by Product Type 2026 & 2034
Figure 27: North America Floating Solar Panels Market Revenue Share (%), by Product Type 2026 & 2034
Figure 28: North America Floating Solar Panels Market Revenue (Billion), by Technology 2026 & 2034
Figure 29: North America Floating Solar Panels Market Revenue Share (%), by Technology 2026 & 2034
Figure 30: North America Floating Solar Panels Market Revenue (Billion), by Capacity 2026 & 2034
Figure 31: North America Floating Solar Panels Market Revenue Share (%), by Capacity 2026 & 2034
Figure 32: North America Floating Solar Panels Market Revenue (Billion), by Installation Environment 2026 & 2034
Figure 33: North America Floating Solar Panels Market Revenue Share (%), by Installation Environment 2026 & 2034
Figure 34: North America Floating Solar Panels Market Revenue (Billion), by End User 2026 & 2034
Figure 35: North America Floating Solar Panels Market Revenue Share (%), by End User 2026 & 2034
Figure 36: North America Floating Solar Panels Market Revenue (Billion), by Country 2026 & 2034
Figure 37: North America Floating Solar Panels Market Revenue Share (%), by Country 2026 & 2034
Figure 38: South America Floating Solar Panels Market Revenue (Billion), by Product Type 2026 & 2034
Figure 39: South America Floating Solar Panels Market Revenue Share (%), by Product Type 2026 & 2034
Figure 40: South America Floating Solar Panels Market Revenue (Billion), by Technology 2026 & 2034
Figure 41: South America Floating Solar Panels Market Revenue Share (%), by Technology 2026 & 2034
Figure 42: South America Floating Solar Panels Market Revenue (Billion), by Capacity 2026 & 2034
Figure 43: South America Floating Solar Panels Market Revenue Share (%), by Capacity 2026 & 2034
Figure 44: South America Floating Solar Panels Market Revenue (Billion), by Installation Environment 2026 & 2034
Figure 45: South America Floating Solar Panels Market Revenue Share (%), by Installation Environment 2026 & 2034
Figure 46: South America Floating Solar Panels Market Revenue (Billion), by End User 2026 & 2034
Figure 47: South America Floating Solar Panels Market Revenue Share (%), by End User 2026 & 2034
Figure 48: South America Floating Solar Panels Market Revenue (Billion), by Country 2026 & 2034
Figure 49: South America Floating Solar Panels Market Revenue Share (%), by Country 2026 & 2034
Figure 50: Middle East & Africa Floating Solar Panels Market Revenue (Billion), by Product Type 2026 & 2034
Figure 51: Middle East & Africa Floating Solar Panels Market Revenue Share (%), by Product Type 2026 & 2034
Figure 52: Middle East & Africa Floating Solar Panels Market Revenue (Billion), by Technology 2026 & 2034
Figure 53: Middle East & Africa Floating Solar Panels Market Revenue Share (%), by Technology 2026 & 2034
Figure 54: Middle East & Africa Floating Solar Panels Market Revenue (Billion), by Capacity 2026 & 2034
Figure 55: Middle East & Africa Floating Solar Panels Market Revenue Share (%), by Capacity 2026 & 2034
Figure 56: Middle East & Africa Floating Solar Panels Market Revenue (Billion), by Installation Environment 2026 & 2034
Figure 57: Middle East & Africa Floating Solar Panels Market Revenue Share (%), by Installation Environment 2026 & 2034
Figure 58: Middle East & Africa Floating Solar Panels Market Revenue (Billion), by End User 2026 & 2034
Figure 59: Middle East & Africa Floating Solar Panels Market Revenue Share (%), by End User 2026 & 2034
Figure 60: Middle East & Africa Floating Solar Panels Market Revenue (Billion), by Country 2026 & 2034
Figure 61: Middle East & Africa Floating Solar Panels Market Revenue Share (%), by Country 2026 & 2034
Table 16:
Table 17: Singapore Floating Solar Panels Market Revenue (Billion) Forecast, by Application 2020 & 2034
Table 18: Australia Floating Solar Panels Market Revenue (Billion) Forecast, by Application 2020 & 2034
Table 19: Europe Floating Solar Panels Market Revenue Billion Forecast, by Product Type 2020 & 2034
Table 20: Europe Floating Solar Panels Market Revenue Billion Forecast, by Technology 2020 & 2034
Table 21: Europe Floating Solar Panels Market Revenue Billion Forecast, by Capacity 2020 & 2034
Table 22: Europe Floating Solar Panels Market Revenue Billion Forecast, by Installation Environment 2020 & 2034
Table 23: Europe Floating Solar Panels Market Revenue Billion Forecast, by End User 2020 & 2034
Table 24: Europe Floating Solar Panels Market Revenue Billion Forecast, by Country 2020 & 2034
Table 25: Germany Floating Solar Panels Market Revenue (Billion) Forecast, by Application 2020 & 2034
Table 26: Netherlands Floating Solar Panels Market Revenue (Billion) Forecast, by Application 2020 & 2034
Table 27: Portugal Floating Solar Panels Market Revenue (Billion) Forecast, by Application 2020 & 2034
Table 28: Spain Floating Solar Panels Market Revenue (Billion) Forecast, by Application 2020 & 2034
Table 29: France Floating Solar Panels Market Revenue (Billion) Forecast, by Application 2020 & 2034
Table 30: UK Floating Solar Panels Market Revenue (Billion) Forecast, by Application 2020 & 2034
Table 31: North America Floating Solar Panels Market Revenue Billion Forecast, by Product Type 2020 & 2034
Table 32: North America Floating Solar Panels Market Revenue Billion Forecast, by Technology 2020 & 2034
Table 33: North America Floating Solar Panels Market Revenue Billion Forecast, by Capacity 2020 & 2034
Table 34: North America Floating Solar Panels Market Revenue Billion Forecast, by Installation Environment 2020 & 2034
Table 35: North America Floating Solar Panels Market Revenue Billion Forecast, by End User 2020 & 2034
Table 36: North America Floating Solar Panels Market Revenue Billion Forecast, by Country 2020 & 2034
Table 37: USA Floating Solar Panels Market Revenue (Billion) Forecast, by Application 2020 & 2034
Table 38: Canada Floating Solar Panels Market Revenue (Billion) Forecast, by Application 2020 & 2034
Table 39: Mexico Floating Solar Panels Market Revenue (Billion) Forecast, by Application 2020 & 2034
Table 40: South America Floating Solar Panels Market Revenue Billion Forecast, by Product Type 2020 & 2034
Table 41: South America Floating Solar Panels Market Revenue Billion Forecast, by Technology 2020 & 2034
Table 42: South America Floating Solar Panels Market Revenue Billion Forecast, by Capacity 2020 & 2034
Table 43: South America Floating Solar Panels Market Revenue Billion Forecast, by Installation Environment 2020 & 2034
Table 44: South America Floating Solar Panels Market Revenue Billion Forecast, by End User 2020 & 2034
Table 45: South America Floating Solar Panels Market Revenue Billion Forecast, by Country 2020 & 2034
Table 46: Brazil Floating Solar Panels Market Revenue (Billion) Forecast, by Application 2020 & 2034
Table 47: Chile Floating Solar Panels Market Revenue (Billion) Forecast, by Application 2020 & 2034
Table 48: Colombia Floating Solar Panels Market Revenue (Billion) Forecast, by Application 2020 & 2034
Table 49: Middle East & Africa Floating Solar Panels Market Revenue Billion Forecast, by Product Type 2020 & 2034
Table 50: Middle East & Africa Floating Solar Panels Market Revenue Billion Forecast, by Technology 2020 & 2034
Table 51: Middle East & Africa Floating Solar Panels Market Revenue Billion Forecast, by Capacity 2020 & 2034
Table 52: Middle East & Africa Floating Solar Panels Market Revenue Billion Forecast, by Installation Environment 2020 & 2034
Table 53: Middle East & Africa Floating Solar Panels Market Revenue Billion Forecast, by End User 2020 & 2034
Table 54: Middle East & Africa Floating Solar Panels Market Revenue Billion Forecast, by Country 2020 & 2034
Table 55: Saudi Arabia Floating Solar Panels Market Revenue (Billion) Forecast, by Application 2020 & 2034
Table 56: UAE Floating Solar Panels Market Revenue (Billion) Forecast, by Application 2020 & 2034
Table 57: South Africa Floating Solar Panels Market Revenue (Billion) Forecast, by Application 2020 & 2034
Table 58: Egypt Floating Solar Panels Market Revenue (Billion) Forecast, by Application 2020 & 2034