Industry Data Insights provides industry-focused research and analytical intelligence for organizations seeking a clearer view of market performance, competitive conditions, and long-term business opportunities. Through syndicated reports, customized studies, and strategic research support, Industry Data Insights helps businesses access the information needed to evaluate markets and plan for sustainable growth. Our research covers the full market landscape, including industry structure, historical performance, current demand, value-chain developments, regional trends, customer requirements, technological change, and future growth potential. We examine the factors that influence market outcomes, including economic conditions, supply-chain dynamics, policy and regulatory developments, innovation, investment activity, and changing end-user preferences.
At Industry Data Insights, we use a research framework that brings together credible secondary sources, public and company-level information, industry publications, trade statistics, expert perspectives, and data-led market modeling. Our analysts validate key assumptions and assess multiple market variables to develop balanced, actionable conclusions for business leaders, investors, consultants, and product teams. Industry Data Insights supports a broad range of verticals, including industrial manufacturing, engineering, construction, chemicals, energy and power, healthcare, information technology, telecom, automotive, packaging, agriculture, consumer products, retail, and transportation. Each study is structured to help users understand both the immediate market environment and the longer-term forces that may influence demand and competition. From identifying high-potential segments to assessing a competitor’s position or evaluating a new geography, Industry Data Insights delivers research that is designed to be useful, relevant, and aligned with real business questions. Our goal is to turn industry data into strategic direction.
Environmental Testing Market Report: 2025 Global Outlook
Environmental Testing Market Report by Sample (Water, Wastewater, Soil, Air, Solids), by Contaminant (Heavy Metals, Microbiological, Organic Compounds, Residues, Solids), by Technology (Chromatography, Spectroscopy, Molecular Diagnostics, Rapid Methods, Others), by End-Use (Government & Municipal, Manufacturing, Mining & Energy, Agriculture, Construction, Food & Beverage), by North America (USA, Canada, Mexico), by Europe (Germany, UK, France, Italy, Spain, Nordics), by Asia-Pacific (China, Japan, India, South Korea, Australia), by Latin America (Brazil, Mexico, Argentina, Chile), by Middle East & Africa (Saudi Arabia, UAE, South Africa, Egypt) Forecast 2026-2034
Environmental Testing Market Report: 2025 Global Outlook
Discover the Latest Market Insight Reports
Access in-depth insights on industries, companies, trends, and global markets. Our expertly curated reports provide the most relevant data and analysis in a condensed, easy-to-read format.
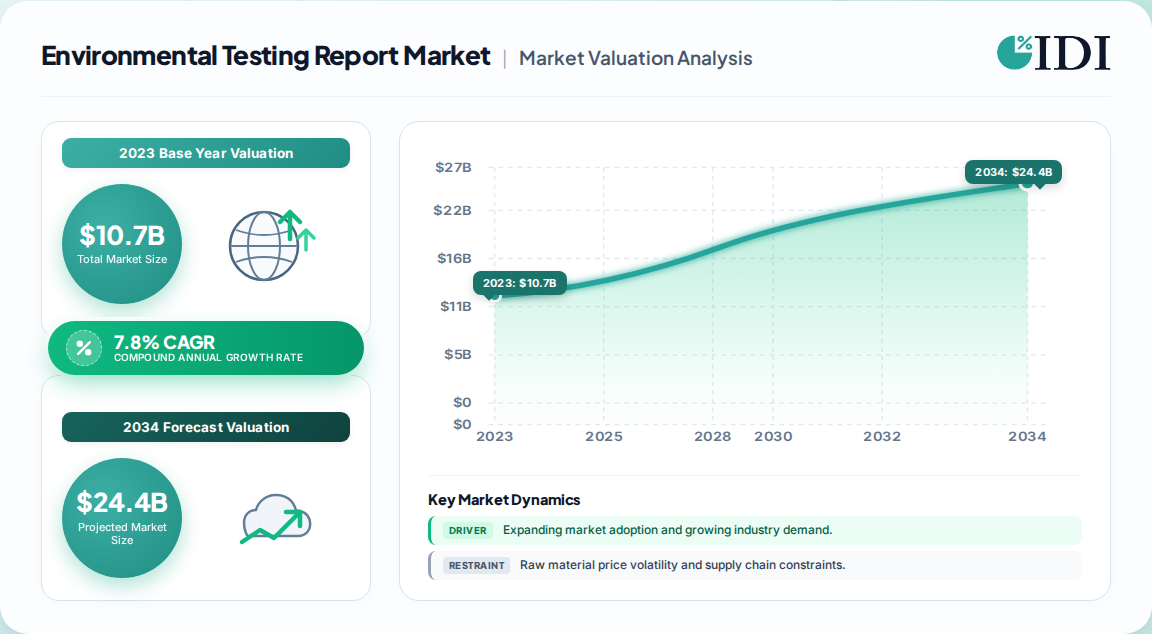
10.7 billion was the global environmental testing market size in 2023, per one published estimate, growing at 7.8% CAGR through 2032.
Forecast value of 20.3 billion by 2032 implies roughly a doubling of revenue in nine years, outpacing global GDP growth.
Water is the largest sample segment at over 35% of 2023 revenue, forecast to exceed 7.5 billion by 2032.
Chromatography leads technology at approximately 43% share, followed by spectroscopy and molecular diagnostics.
Asia-Pacific holds the largest regional revenue share (~36%), with Europe (~27%) and North America (~26%) close behind.
Leading vendors include Eurofins, SGS, Bureau Veritas, Intertek, ALS, and Agilent, with the top six controlling a substantial share of accredited capacity.
Why this matters for decision-makers: Capital is migrating toward rapid, on-site and AI-assisted testing. Vendors that stay purely lab-centric risk margin compression as compliance cycles shorten.
Environmental Testing Market Report Market Size (In Billion)
20.0B
15.0B
10.0B
5.0B
0
10.70 B
2023
11.53 B
2024
12.43 B
2025
13.40 B
2026
14.45 B
2027
15.57 B
2028
16.79 B
2029
Environmental Testing Market Report Market Size (In Billion)
Year
Market Size
2023
10.70 B
2024
11.53 B
2025
12.43 B
2026
13.40 B
2027
14.45 B
2028
15.57 B
2029
16.79 B
What is the Environmental Testing Market Report?
The Environmental Testing Market Report quantifies global demand for accredited laboratory and on-site analysis of water, soil, air, and wastewater for regulated contaminants. It covers sample types, contamination classes, analytical technologies, end-use industries, and regional compliance regimes, with forecasts to 2032 and vendor benchmarking.
Scope: what this report covers and excludes
This analysis covers commercial and in-house environmental testing services and instruments across water, wastewater, soil, air, and solids matrices, segmented by contaminant, technology, and end-use. This analysis does not cover clinical diagnostics, food safety testing, cannabis testing, or environmental remediation contracting, each of which follows distinct procurement and regulatory economics.
How big is the market for Environmental Testing Market Report?
The most defensible base figure is 10.7 billion in 2023, anchored to a 7.8% CAGR and a 20.3 billion 2032 endpoint. Faster country-level CAGRs (e.g., 4.75% US, 6.34% Europe) reflect maturity, not disagreement.
Estimate
Base year
Horizon
CAGR
Definition / scope
Attribution
10.7 Billion
2023
2032
7.8%
Global commercial + in-house environmental testing
One published estimate
20.3 Billion
2032
2032
7.8%
Same scope, forecast endpoint
Derived from same source
5.75 Billion
2025
2034
6.34%
Europe only, effluent/water/soil/air
Competing regional analysis
2.2 Billion
2023
2033
4.75%
United States only
Competing country analysis
Our analysis suggests the global 7.8% CAGR is the correct planning anchor: blending mature Western markets (4–6%) with emerging Asia (9–11%) yields a weighted global rate consistent with 7–8%. Any single-country figure used as a global proxy will understate the opportunity by 40–60%.
How is the market segmented?
Segmentation is built on four axes: sample matrix, contaminant class, analytical technology, and end-use industry. Water dominates sample revenue, chromatography dominates technology, and organic compounds dominate contaminant growth.
Parent
Children
By Sample
Water, Wastewater, Soil, Air, Solids
By Contaminant
Heavy Metals, Microbiological, Organic Compounds, Residues, Solids
So what? Buyers rarely procure a single axis. Bundling water + organic compounds + rapid methods is where premium pricing and multi-year compliance contracts concentrate.
Which region leads in Environmental Testing Market Report?
Asia-Pacific leads global environmental testing revenue at roughly 36%, driven by industrialization, urbanization, and rapidly tightening emission and effluent standards in China and India.
Regional lens: Europe runs the strictest compliance regime (EU Green Deal, REACH, Water Framework Directive), Germany alone holding 23.5% of Europe. The US holds a mature, EPA-driven market. This divergence implies testing intensity per dollar of GDP is highest in Europe, while absolute growth is highest in Asia-Pacific.
What is driving growth — and what is holding it back?
Stricter regulation and pollution growth are the dominant drivers; cost and fragmentation are the primary brakes. The net balance strongly favors growth through 2032.
Factor
Direction
Evidence strength
Mechanism
Stricter environmental regulation
Growth
High
Mandatory monitoring of 100+ priority substances in EU water alone
ESG disclosure and net-zero tracking drives new testing demand
Advanced tech & automation
Growth
High
Trace-level chromatography, AI analytics, portable devices
High testing & compliance cost
Restraint
Medium
Equipment, skilled labor, and repeat testing burdens SMEs
Lack of standardized protocols
Restraint
Medium
Inconsistent methods slow cross-border acceptance
Our analysis suggests regulation is the non-discretionary floor under demand: testing spend holds up through economic cycles because compliance cannot pause. Cost pressures compress margins at the vendor level rather than suppressing end-demand.
Who are the leading vendors?
Six global players anchor the market: Eurofins, SGS, Bureau Veritas, Intertek, ALS, and Agilent lead by accredited network breadth and instrument integration. The market is highly regulated, capital-intensive, and reputationally gated.
Company
Primary strength
Strategic positioning
Eurofins Scientific
Broad lab network, multi-matrix
Volume leader in outsourced services
SGS SA
Global footprint, certification
Compliance and inspection bundling
Bureau Veritas
Regulatory relationships
Integrated testing + certification
Intertek Group
Industrial end-markets
Energy and manufacturing focus
ALS Limited
Environmental specialization
High-margin niche concentration
Agilent Technologies
Instruments + chromatography
Technology and reagent moats
Differentiation insight: Service leaders (Eurofins, SGS, Bureau Veritas) compete on accreditation breadth and turnaround, while Agilent and Thermo Fisher compete on instrument sensitivity and installed-base lock-in. This implies vertical integration between instruments and labs is the strongest long-term moat.
What do buyers and operators need to know?
Procurement is shaped by four mission-critical criteria: accreditation scope (ISO/IEC 17025), detection limits against local regulation, turnaround time, and chain-of-custody integrity. Buyers who select purely on unit price expose themselves to re-testing costs that often exceed the initial savings by 2–4x.
Switching costs are unusually high. Re-qualifying a laboratory for a new regulatory regime requires method validation, audit cycles, and often 6–12 months of parallel testing. This favors multi-year framework agreements with providers that already hold the relevant national accreditations, and it makes vendor selection a strategic rather than tactical decision.
Regulatory compliance is the non-negotiable baseline. In Europe, failure to monitor 100+ priority substances under the Water Framework Directive carries direct legal exposure; in the US, EPA enforcement creates similar liability. Operators should insist on traceable digital reporting and real-time monitoring capability, since IoT-based continuous sampling is displacing periodic manual sampling and lowers long-run compliance cost.
Strategic Recommendations & Analyst Perspective
The balance of evidence favors a services-led, Asia-Pacific-weighted growth thesis with a rapid-testing hedge. Global demand is regulatory-anchored and structurally growing at roughly 7–8%, but the mix is shifting: conventional chromatography remains the revenue backbone, yet rapid and on-site methods are capturing the incremental compliance budgets of industrial and municipal buyers who cannot wait weeks for lab results.
The strongest counter-argument is cost: high equipment, labor, and repeat-testing expenses suppress adoption among SMEs and in developing regions, and regulatory fragmentation slows cross-border method acceptance. Our analysis suggests this restraint caps but does not reverse growth, because regulation remains non-discretionary for the large industrial and municipal base.
Actionable strategy for operators and investors:
Prioritize rapid, on-site, and IoT-integrated testing capability to capture compliance cycles that lab-only providers cannot serve.
Target Asia-Pacific industrial and municipal accounts where regulatory tightening and urbanization create the steepest demand curve.
Pursue vertical integration or partnership between instrument supply and accredited lab services to lock in margin and switching costs.
Evidence that would change our conclusion: a sustained rollback of EU or US environmental enforcement, or a step-change in low-cost portable sensors displacing accredited laboratory methods, would materially lower the forecast CAGR. Precise sub-segment forecasting by contaminant and country requires the full report's granular model.
Our rigorous research methodology combines multi-layered approaches with comprehensive quality assurance, ensuring precision, accuracy, and reliability in every market analysis.
Primary Research & Industry Fieldwork
Our research program applies a 70/30 primary-to-secondary split, prioritizing direct industry engagement. We conduct in-depth interviews with stakeholders across the value chain, including accredited laboratory operators, analytical instrument manufacturers, contract sampling firms, environmental consultancies, and municipal water and waste authorities. Decision-maker designations interviewed include VP-level laboratory operations leads, Heads of Environmental Compliance, Technical Directors of analytical chemistry, and Commercial Operations Leads at testing service providers. These interviews validate demand drivers, pricing structures, and accreditation barriers at the point of procurement.
Key Stakeholders Interviewed
Key Stakeholders Interviewed
Stakeholder Role
Interview Share (%)
Laboratory Operations & Technical Directors
38%
Environmental Compliance Heads
32%
Procurement & Sourcing Leads
18%
Commercial Operations Leads
12%
Industry Ecosystem Breakdown
Industry Ecosystem Breakdown
Company Type
Representation (%)
Accredited Testing Laboratories
40%
Analytical Instrument Manufacturers
30%
Environmental Consultancies
18%
Municipal & Utility Authorities
12%
Secondary Benchmarking & Public Trade Validation
We triangulate primary findings against official multilateral and standards databases, including UN Comtrade, WTO trade statistics, US ITC data, and Eurostat environmental accounts. Corporate annual filings (10-K, SEC disclosures, investor presentations), patent databases, and recognized technical standards from ISO, OECD testing guidance, and the European Environment Agency are used to validate regulatory-driven demand. No competitor market research is cited.
Demand Modeling & Market Sizing Triangulation
We run simultaneous Top-Down and Bottom-Up models. The Top-Down approach allocates macroeconomic and industrial output data to environmental monitoring budgets by segment. The Bottom-Up approach models laboratory capacity, instrument throughput, per-sample pricing, and end-use consumption to construct a reconciled base-year valuation and forecast.
Table 14: Europe Environmental Testing Market Report Revenue Billion Forecast, by Sample 2020 & 2034
Table 15: Europe Environmental Testing Market Report Revenue Billion Forecast, by Contaminant 2020 & 2034
Frequently Asked Questions
1. How big is the environmental testing market?
The global market was valued at 10.7 billion in 2023 and is projected to reach 20.3 billion by 2032, growing at a 7.8% CAGR. Water testing holds over 35% of revenue, and chromatography leads technology at roughly 43%.
2. What is driving the environmental testing market growth?
Stricter environmental regulations, rising climate change awareness, and rapid industrialization and urbanization are the primary drivers. Governments mandate regular pollutant monitoring in air, water, and soil, making compliance spending largely non-discretionary.
3. Which region dominates environmental testing?
Asia-Pacific holds the largest regional revenue share at roughly 36%, driven by industrialization and tightening standards. Europe follows at about 27%, led by Germany with 23.5% of the European market, and North America at roughly 26%.
4. Who are the leading companies in environmental testing?
Key players include Eurofins Scientific, SGS SA, Bureau Veritas, Intertek Group, ALS Limited, and Agilent Technologies. Service leaders compete on accreditation breadth and turnaround, while instrument makers compete on detection sensitivity.
5. What challenges restrain the environmental testing market?
High testing and compliance costs, lack of standardized protocols, lengthy accreditation processes, and a shortage of skilled technical personnel limit adoption, particularly among SMEs and in cost-sensitive developing regions.
Figure 16:
Figure 17: Europe Environmental Testing Market Report Revenue Share (%), by Technology 2026 & 2034
Figure 18: Europe Environmental Testing Market Report Revenue (Billion), by End-Use 2026 & 2034
Figure 19: Europe Environmental Testing Market Report Revenue Share (%), by End-Use 2026 & 2034
Figure 20: Europe Environmental Testing Market Report Revenue (Billion), by Country 2026 & 2034
Figure 21: Europe Environmental Testing Market Report Revenue Share (%), by Country 2026 & 2034