Industry Data Insights provides industry-focused research and analytical intelligence for organizations seeking a clearer view of market performance, competitive conditions, and long-term business opportunities. Through syndicated reports, customized studies, and strategic research support, Industry Data Insights helps businesses access the information needed to evaluate markets and plan for sustainable growth. Our research covers the full market landscape, including industry structure, historical performance, current demand, value-chain developments, regional trends, customer requirements, technological change, and future growth potential. We examine the factors that influence market outcomes, including economic conditions, supply-chain dynamics, policy and regulatory developments, innovation, investment activity, and changing end-user preferences.
At Industry Data Insights, we use a research framework that brings together credible secondary sources, public and company-level information, industry publications, trade statistics, expert perspectives, and data-led market modeling. Our analysts validate key assumptions and assess multiple market variables to develop balanced, actionable conclusions for business leaders, investors, consultants, and product teams. Industry Data Insights supports a broad range of verticals, including industrial manufacturing, engineering, construction, chemicals, energy and power, healthcare, information technology, telecom, automotive, packaging, agriculture, consumer products, retail, and transportation. Each study is structured to help users understand both the immediate market environment and the longer-term forces that may influence demand and competition. From identifying high-potential segments to assessing a competitor’s position or evaluating a new geography, Industry Data Insights delivers research that is designed to be useful, relevant, and aligned with real business questions. Our goal is to turn industry data into strategic direction.
Private 5g Network Market by Component (Hardware, Software, Services), by Frequency Band (Sub-6 GHz, mmWave), by Spectrum (Licensed, Unlicensed/Shared), by Deployment Model (On-Premise, Cloud, Hybrid), by Enterprise Size (SMEs, Large Enterprises), by Industry Vertical (Manufacturing, Logistics & Transportation, Energy & Utilities, Healthcare, Defense & Public Safety, Retail, Agriculture, Smart Cities), by North America (USA, Canada, Mexico), by Europe (Germany, UK, France, Italy), by Asia Pacific (China, Japan, India, South Korea), by Latin America (Brazil, Mexico, Argentina), by Middle East & Africa (Saudi Arabia, UAE, South Africa) Forecast 2026-2034
Access in-depth insights on industries, companies, trends, and global markets. Our expertly curated reports provide the most relevant data and analysis in a condensed, easy-to-read format.
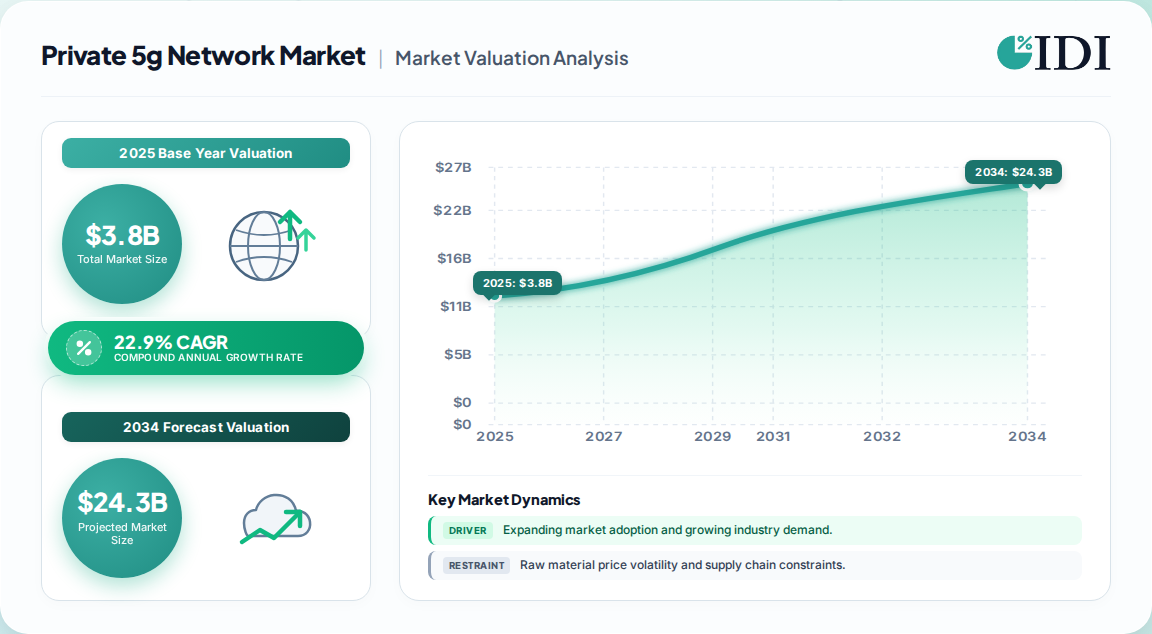
The global private 5G network market was valued at 3.8 Billion in 2025 and reached an estimated 5.4 Billion in 2026, on a trajectory toward 34.4 Billion by 2035 under the most conservative published forecast.
Forecast CAGR sits in a 22.9% to 58.9% band across published estimates — a divergence wide enough that it changes investment sequencing, not just revenue sizing.
Hardware (RAN, core network, backhaul and transport) accounted for 51.8% of 2025 revenue, with services the fastest-growing component as enterprises shift toward as-a-service consumption.
North America held roughly 32% of 2025 revenue share, while Asia Pacific is the fastest-growing region, with one analysis placing APAC at 34.5% share on a broader definition.
The top five vendors — Huawei, Nokia, Ericsson, ZTE and Samsung — collectively held 68.7% of 2025 share, with Huawei alone at 23.7%.
Sub-6 GHz and unlicensed/shared spectrum dominated 2025 deployments; mmWave and licensed spectrum grow faster off a small base.
Why this matters for decision-makers: Only 11.9% of active US CBRS base stations ran 5G NR in mid-2024, so near-term revenue is being earned in LTE-dominant estates — vendors that price for 5G-only greenfields will lose the mid-market to competitors who support migration paths.
Private 5g Network Market Market Size (In Billion)
20.0B
15.0B
10.0B
5.0B
0
3.800 B
2025
5.400 B
2026
6.600 B
2027
8.200 B
2028
10.00 B
2029
12.30 B
2030
15.10 B
2031
Private 5g Network Market Market Size (In Billion)
Year
Market Size
2025
3.800 B
2026
5.400 B
2027
6.600 B
2028
8.200 B
2029
10.00 B
2030
12.30 B
2031
15.10 B
What is the Private 5g Network Market?
The private 5G network market covers dedicated, non-public cellular networks built on licensed, shared or unlicensed spectrum for a single enterprise or campus. It spans RAN, core, backhaul, edge compute and managed services, sold on-premise, hosted or as-a-service to factories, ports, utilities, hospitals and government sites.
Scope: what this report covers and excludes
This report covers components (hardware, software, services), frequency bands, spectrum models, deployment models, enterprise size tiers and industry verticals across five regions, valued at manufacturer and service-provider revenue. This analysis does not cover public mobile network capex, Wi-Fi 6/7 enterprise equipment, satellite connectivity, or consumer 5G subscriptions.
How big is the market for Private 5g Network Market?
Base-year sizing is converging: three of four published estimates put 2025 between 3.8 Billion and 4.8 Billion, with only the forecast slope in genuine dispute. The table below isolates that divergence.
Estimate
Base year
Horizon
CAGR
Definition / scope
Attribution
3.8 Billion
2025
2035 (34.4 Billion)
22.9%
Global private 5G, hardware/software/services, conservative adoption curve
Our analysis suggests the 22.9% figure is the most defensible base case. The high-CAGR estimates implicitly assume mass 5G Standalone conversion that the installed base does not yet support — only 101 organisations globally were identified piloting or deploying private 5G SA as of April 2025. Treat 20-25% as the planning case and 40%+ as the upside scenario requiring standalone maturity.
How is the market segmented?
Segmentation follows the procurement path: buyers choose a frequency band, then a spectrum model, then a deploy-or-buy model, and the vertical dictates the compliance envelope.
Parent segment
Children
By Component
Hardware (RAN, Core Network, Backhaul & Transport), Software, Services (Installation & Integration, Data Services, Support & Maintenance)
By Frequency Band
Sub-6 GHz, mmWave
By Spectrum
Licensed, Unlicensed/Shared
By Deployment Model
On-Premise, Cloud, Hybrid (Public-Private)
By Enterprise Size
SMEs, Large Enterprises
By Industry Vertical
Manufacturing, Logistics & Transportation, Energy & Utilities, Healthcare, Defense & Public Safety, Retail, Agriculture, Smart Cities
Hardware dominance is a structural artifact, not a permanent feature. Our analysis suggests the 51.8% hardware share compresses through the forecast as integration services and subscription models absorb budget — services are already the fastest-growing component.
Which region leads in Private 5g Network Market?
North America led in 2025 with roughly 32% revenue share, but Asia Pacific is the fastest-growing region and, on broader definitions that include government-led smart-city programs, already holds the largest share at about 34.5%.
Private 5g Network Market Regional Market Share
Loading chart...
Private 5g Network Market Regional Market Share
Region
Market Share (%)
North America
0.32%
Europe
0.22%
Asia-Pacific
0.34%
South America
0.05%
Middle East & Africa
0.07%
North America — USA (CBRS shared spectrum), Canada, Mexico
Europe — Germany (465 campus licences awarded by April 2025), UK, France, Italy
Asia Pacific — China, Japan, India, South Korea
Latin America — Brazil, Mexico, Argentina
Middle East & Africa — Saudi Arabia, UAE, South Africa
The divergence is definitional, not factual. North America's lead is measured on enterprise-purchased commercial deployments; APAC's lead appears when state-directed industrial and municipal programs are counted. For buyers, this means North American CBRS pricing benchmarks are the most competitive globally, while APAC lead volumes reflect public-sector rather than commercial demand.
What is driving growth — and what is holding it back?
Shared-spectrum liberalisation and industrial digitalisation are the two forces that actually convert into capital spending; everything else is an enabling condition.
Factor
Direction
Evidence strength
Mechanism
Shared-spectrum policy (CBRS, campus licences)
Driver
High — 400,403 active CBRS base stations, US, July 2024
Industrial digitalisation and regulatory enablement
Driver
High — 465 German campus licences by April 2025
Converts sovereignty goals into enterprise capex
3GPP Release 17/18 (RedCap, URLLC, 5G Advanced)
Driver
Medium — standards published, devices lagging
Widens device ecosystem beyond heavy RAN
LTE-to-5G NR transition lag
Restraint
High — 11.9% of CBRS base stations on 5G NR, July 2024
Suppresses revenue mix shift to premium 5G configs
Nascent 5G Standalone ecosystem
Restraint
High — 101 organisations piloting/deploying, April 2025
Blocks premium slicing and sub-millisecond use cases
Deployment CapEx and OT/IT convergence complexity
Restraint
Medium — 6-12 month timelines, scarce integration talent
Pushes SMEs toward NaaS, extends sales cycles
The balance of evidence favours demand over supply constraints. Spectrum access is no longer the binding limitation in the US and Germany; integration capacity is. That shifts value capture decisively toward managed-service providers and systems integrators, and away from radio vendors selling components into enterprises without deployment partners.
Who are the leading vendors?
The top five vendors held 68.7% of 2025 share, but their position is concentrated in radio infrastructure rather than the integration and service layers where growth is fastest.
Company
Position
Key differentiator
Huawei
Market leader, 23.7% share (2025)
Cost-competitive RAN and core, strong APAC and MEA footprint
Nokia
Top-five
European campus-network leadership, industrial OT partnerships
Ericsson
Top-five
Global operator relationships, cloud-native core portfolio
ZTE
Top-five
Aggressive pricing in emerging markets
Samsung
Top-five
US CBRS and mmWave strength, semiconductor integration
The moat is not the radio. Our analysis suggests vendor lock-in now accrues through the core network and management software, where switching costs are highest, while RAN becomes progressively commoditised by Open RAN and shared-spectrum hardware.
What do buyers and operators need to know?
Selection criteria should be weighted toward migration headroom, not peak 5G specification. Because 88% of US CBRS infrastructure still runs LTE, a buyer who purchases 5G-only greenfield equipment absorbs a technology risk the installed market has not yet validated.
Procurement risk concentrates in three areas: spectrum tenure (shared-spectrum access can be interrupted by incumbent priority users), integration talent scarcity (6-12 month deployment timelines with limited specialist availability), and vendor continuity in the core. Buyers should insist on contractual clarity around spectrum fallback, core portability and end-of-life radio support.
Switching costs rise sharply after core deployment. Enterprises that lock a proprietary core at year one face a multi-year re-integration penalty; those that select cloud-native, standards-conformant cores retain optionality into 5G Advanced. Regulatory compliance varies materially by jurisdiction — German campus licences, US CBRS SAS registration and UK shared access licensing impose different obligations that should be assessed before site design, not after.
Strategic Recommendations & Analyst Perspective
The balance of evidence favours a measured-bull position: the market will grow fast, but along a 20-25% CAGR path rather than the 50%+ headlines, because the installed base is LTE-heavy and standalone maturity is a 2027-2028 event. The strongest counter-argument is that NaaS and cloud-delivered cores collapse deployment friction faster than the base case assumes, which would validate the higher estimates — but that requires the 101-organisation standalone pilot pool to convert at scale, and no evidence yet shows it doing so.
Actionable strategy:
Vendors and operators should prioritise LTE-to-5G NR upgrade paths and migration-friendly pricing to capture the large installed CBRS estate before greenfield competition intensifies.
Service providers should invest in integration capacity — the genuine bottleneck — rather than incremental radio portfolio breadth, since deployment complexity is what suppresses SME adoption.
Buyers should contract for core portability and spectrum fallback now; these are the two clauses that determine total cost of ownership through 2030.
Our conclusion would change if standalone private 5G deployments exceeded roughly 500 organisations globally, or if 5G NR penetration of the US CBRS base station estate passed 40%. Either signal would justify re-basing to the 40%+ CAGR scenario. Precise sub-segment and country-level forecasting beyond these directional judgements requires the full report's bottom-up deployment models.
Private 5g Network Market Regional Market Share
Higher Coverage
Lower Coverage
No Coverage
Private 5g Network Market REPORT HIGHLIGHTS
Research Methodology & Data Sources
Our rigorous research methodology combines multi-layered approaches with comprehensive quality assurance, ensuring precision, accuracy, and reliability in every market analysis.
Primary Research & Industry Fieldwork
This study applies a 70/30 primary-to-secondary research split. Structured depth interviews and targeted surveys were conducted across the private cellular value chain, covering radio access and core network equipment vendors, systems integrators and managed-service providers, spectrum access and SAS administrators, industrial automation and OT specialists, and enterprise end-users in manufacturing, logistics, utilities and healthcare. Within these organisations, interviews were held with VP-level Sourcing and Procurement Leads, Heads of Network and Infrastructure Engineering, Technical Directors for OT/IT convergence, and Commercial Operations Leads accountable for deployment economics.
Key Stakeholders Interviewed
Key Stakeholders Interviewed
Stakeholder Role
Interview Share (%)
Network & Infrastructure Engineering Heads
35%
Procurement & Sourcing Leads
30%
OT/IT Technical Directors
25%
Commercial Operations Leads
10%
Industry Ecosystem Breakdown
Industry Ecosystem Breakdown
Company Type
Representation (%)
RAN & Core Network Vendors
40%
Systems Integrators & Managed Service Providers
30%
Industrial Automation & OT Specialists
20%
Enterprise End-Users
10%
Secondary Benchmarking & Public Trade Validation
Secondary validation draws on official multilateral and regulatory databases, including ITU and 3GPP standards publications, national spectrum regulator filings (FCC and Bundesnetzagentur campus-licensing registers), US NTIA and CBRS SAS aggregate data, Eurostat and UN Comtrade trade statistics, and corporate annual filings and investor presentations from listed vendors. Patent filing databases and industry association reports were used to corroborate technology-readiness timelines for RedCap, URLLC and 5G Advanced.
Demand Modeling & Market Sizing Triangulation
Base-year sizing was triangulated simultaneously top-down and bottom-up. The top-down path allocates macroeconomic telecommunications capex and industrial digitalisation spend across verticals and regions; the bottom-up path models vendor radio and core shipment volumes, average selling prices, and site-level deployment counts by spectrum type. Divergence between the two paths was reconciled against regulator-issued licence counts and base-station registrations.
Data Triangulation & Validation Matrix
Dimension
Analytical Scope
Methodology Applied
Validation Level
Base-Year Market Size
Value in USD for base year
Bottom-up shipment and revenue triangulation
High
Forecast Horizon
Multi-year compound projection
Historical CAGR, regression analysis and demand elasticity
High
Regional Distribution
Regional share breakdown
Licence registrations, spectrum data and regional consumption
High
Competitive Landscape
Leading market players
Annual reports, deployment mapping and commercial filings
High
Sources Referenced
Federal Communications Commission (FCC) — spectrum allocation and CBRS framework
Bundesnetzagentur — 5G campus network frequency licensing register
3GPP — Release 17 and Release 18 specifications
ITU — international spectrum and mobile broadband standards
US NTIA — aggregate CBRS SAS deployment data
Aspects
Details
Study Period
2020-2034
Base Year
2025
Estimated Year
2026
Forecast Period
2026-2034
Historical Period
2020-2025
Growth Rate
CAGR of 22.9% from 2020-2034
Segmentation
By Component
Hardware
Software
Services
By Frequency Band
Sub-6 GHz
mmWave
By Spectrum
Licensed
Unlicensed/Shared
By Deployment Model
On-Premise
Cloud
Hybrid
By Enterprise Size
SMEs
Large Enterprises
By Industry Vertical
Manufacturing
Logistics & Transportation
Energy & Utilities
Healthcare
Defense & Public Safety
Retail
Agriculture
Smart Cities
By Geography
North America
USA
Canada
Mexico
Europe
Germany
UK
France
Italy
Asia Pacific
China
Japan
India
South Korea
Latin America
Brazil
Mexico
Argentina
Middle East & Africa
Saudi Arabia
UAE
South Africa
Table of Contents
1. Private 5g Network Market Introduction
1.1. Research Scope
1.2. Market Segmentation
1.3. Research Objective
1.4. Definitions and Assumptions
2. Private 5g Network Market Executive Summary
2.1. Market Snapshot
3. Private 5g Network Market Dynamics
3.1. Introduction
3.2. Market Drivers
3.3. Market Restrains
3.4. Market Trends
4. Private 5g Network Market Factor Analysis
4.1. Porters Five Forces
4.1.1. Bargaining Power of Suppliers
4.1.2. Bargaining Power of Buyers
4.1.3. Threat of New Entrants
4.1.4. Threat of Substitutes
4.1.5. Competitive Rivalry
4.2. PESTEL analysis
4.3. BCG Analysis
4.3.1. Stars (High Growth, High Market Share)
4.3.2. Cash Cows (Low Growth, High Market Share)
4.3.3. Question Mark (High Growth, Low Market Share)
4.3.4. Dogs (Low Growth, Low Market Share)
4.4. Ansoff Matrix Analysis
4.5. Supply Chain Analysis
4.6. Regulatory Landscape
4.7. Current Market Potential and Opportunity Assessment (TAM–SAM–SOM Framework)
4.8. IDI Analyst Note
5. Private 5g Network Market Analysis, Insights and Forecast, 2020-2034
5.1. Analysis, Insights and Forecast - by Component
5.1.1. Hardware
5.1.2. Software
5.1.3. Services
5.2. Analysis, Insights and Forecast - by Frequency Band
5.2.1. Sub-6 GHz
5.2.2. mmWave
5.3. Analysis, Insights and Forecast - by Spectrum
5.3.1. Licensed
5.3.2. Unlicensed/Shared
5.4. Analysis, Insights and Forecast - by Deployment Model
5.4.1. On-Premise
5.4.2. Cloud
5.4.3. Hybrid
5.5. Analysis, Insights and Forecast - by Enterprise Size
5.5.1. SMEs
5.5.2. Large Enterprises
5.6. Analysis, Insights and Forecast - by Industry Vertical
5.6.1. Manufacturing
5.6.2. Logistics & Transportation
5.6.3. Energy & Utilities
5.6.4. Healthcare
5.6.5. Defense & Public Safety
5.6.6. Retail
5.6.7. Agriculture
5.6.8. Smart Cities
5.7. Analysis, Insights and Forecast - by Region
5.7.1. North America
5.7.2. Europe
5.7.3. Asia Pacific
5.7.4. Latin America
5.7.5. Middle East & Africa
6. Private 5g Network Market North America Analysis, Insights and Forecast, 2020-2034
6.1. Analysis, Insights and Forecast - by Component
6.1.1. Hardware
6.1.2. Software
6.1.3. Services
6.2. Analysis, Insights and Forecast - by Frequency Band
6.2.1. Sub-6 GHz
6.2.2. mmWave
6.3. Analysis, Insights and Forecast - by Spectrum
6.3.1. Licensed
6.3.2. Unlicensed/Shared
6.4. Analysis, Insights and Forecast - by Deployment Model
6.4.1. On-Premise
6.4.2. Cloud
6.4.3. Hybrid
6.5. Analysis, Insights and Forecast - by Enterprise Size
6.5.1. SMEs
6.5.2. Large Enterprises
6.6. Analysis, Insights and Forecast - by Industry Vertical
6.6.1. Manufacturing
6.6.2. Logistics & Transportation
6.6.3. Energy & Utilities
6.6.4. Healthcare
6.6.5. Defense & Public Safety
6.6.6. Retail
6.6.7. Agriculture
6.6.8. Smart Cities
7. Private 5g Network Market Europe Analysis, Insights and Forecast, 2020-2034
7.1. Analysis, Insights and Forecast - by Component
7.1.1. Hardware
7.1.2. Software
7.1.3. Services
7.2. Analysis, Insights and Forecast - by Frequency Band
7.2.1. Sub-6 GHz
7.2.2. mmWave
7.3. Analysis, Insights and Forecast - by Spectrum
7.3.1. Licensed
7.3.2. Unlicensed/Shared
7.4. Analysis, Insights and Forecast - by Deployment Model
7.4.1. On-Premise
7.4.2. Cloud
7.4.3. Hybrid
7.5. Analysis, Insights and Forecast - by Enterprise Size
7.5.1. SMEs
7.5.2. Large Enterprises
7.6. Analysis, Insights and Forecast - by Industry Vertical
7.6.1. Manufacturing
7.6.2. Logistics & Transportation
7.6.3. Energy & Utilities
7.6.4. Healthcare
7.6.5. Defense & Public Safety
7.6.6. Retail
7.6.7. Agriculture
7.6.8. Smart Cities
8. Private 5g Network Market Asia Pacific Analysis, Insights and Forecast, 2020-2034
8.1. Analysis, Insights and Forecast - by Component
8.1.1. Hardware
8.1.2. Software
8.1.3. Services
8.2. Analysis, Insights and Forecast - by Frequency Band
8.2.1. Sub-6 GHz
8.2.2. mmWave
8.3. Analysis, Insights and Forecast - by Spectrum
8.3.1. Licensed
8.3.2. Unlicensed/Shared
8.4. Analysis, Insights and Forecast - by Deployment Model
8.4.1. On-Premise
8.4.2. Cloud
8.4.3. Hybrid
8.5. Analysis, Insights and Forecast - by Enterprise Size
8.5.1. SMEs
8.5.2. Large Enterprises
8.6. Analysis, Insights and Forecast - by Industry Vertical
8.6.1. Manufacturing
8.6.2. Logistics & Transportation
8.6.3. Energy & Utilities
8.6.4. Healthcare
8.6.5. Defense & Public Safety
8.6.6. Retail
8.6.7. Agriculture
8.6.8. Smart Cities
9. Private 5g Network Market Latin America Analysis, Insights and Forecast, 2020-2034
9.1. Analysis, Insights and Forecast - by Component
9.1.1. Hardware
9.1.2. Software
9.1.3. Services
9.2. Analysis, Insights and Forecast - by Frequency Band
9.2.1. Sub-6 GHz
9.2.2. mmWave
9.3. Analysis, Insights and Forecast - by Spectrum
9.3.1. Licensed
9.3.2. Unlicensed/Shared
9.4. Analysis, Insights and Forecast - by Deployment Model
9.4.1. On-Premise
9.4.2. Cloud
9.4.3. Hybrid
9.5. Analysis, Insights and Forecast - by Enterprise Size
9.5.1. SMEs
9.5.2. Large Enterprises
9.6. Analysis, Insights and Forecast - by Industry Vertical
9.6.1. Manufacturing
9.6.2. Logistics & Transportation
9.6.3. Energy & Utilities
9.6.4. Healthcare
9.6.5. Defense & Public Safety
9.6.6. Retail
9.6.7. Agriculture
9.6.8. Smart Cities
10. Private 5g Network Market Middle East & Africa Analysis, Insights and Forecast, 2020-2034
10.1. Analysis, Insights and Forecast - by Component
10.1.1. Hardware
10.1.2. Software
10.1.3. Services
10.2. Analysis, Insights and Forecast - by Frequency Band
10.2.1. Sub-6 GHz
10.2.2. mmWave
10.3. Analysis, Insights and Forecast - by Spectrum
10.3.1. Licensed
10.3.2. Unlicensed/Shared
10.4. Analysis, Insights and Forecast - by Deployment Model
10.4.1. On-Premise
10.4.2. Cloud
10.4.3. Hybrid
10.5. Analysis, Insights and Forecast - by Enterprise Size
10.5.1. SMEs
10.5.2. Large Enterprises
10.6. Analysis, Insights and Forecast - by Industry Vertical
1. How fast is the private 5G network market growing?
Published estimates range from 22.9% to 58.9% CAGR through the mid-2030s. The 22.9% figure is most defensible given LTE-dominant installed infrastructure and a still-nascent standalone ecosystem.
2. Which region dominates private 5G deployments?
North America led 2025 revenue at roughly 32%, driven by CBRS shared spectrum. Asia Pacific is the fastest-growing region and leads on broader definitions that include government-directed industrial programs.
3. What is the largest segment?
Hardware held 51.8% of 2025 revenue, led by RAN and core network equipment. Services are the fastest-growing component as enterprises shift toward as-a-service consumption.
4. Who are the leading vendors?
Huawei leads with 23.7% share, followed by Nokia, Ericsson, ZTE and Samsung, which together held 68.7% of the market in 2025.
Figure 17: Europe Private 5g Network Market Revenue Share (%), by Component 2026 & 2034
Figure 18: Europe Private 5g Network Market Revenue (Billion), by Frequency Band 2026 & 2034
Figure 19: Europe Private 5g Network Market Revenue Share (%), by Frequency Band 2026 & 2034
Figure 20: Europe Private 5g Network Market Revenue (Billion), by Spectrum 2026 & 2034
Figure 21: Europe Private 5g Network Market Revenue Share (%), by Spectrum 2026 & 2034
Figure 22: Europe Private 5g Network Market Revenue (Billion), by Deployment Model 2026 & 2034
Figure 23: Europe Private 5g Network Market Revenue Share (%), by Deployment Model 2026 & 2034
Figure 24: Europe Private 5g Network Market Revenue (Billion), by Enterprise Size 2026 & 2034
Figure 25: Europe Private 5g Network Market Revenue Share (%), by Enterprise Size 2026 & 2034
Figure 26: Europe Private 5g Network Market Revenue (Billion), by Industry Vertical 2026 & 2034
Figure 27: Europe Private 5g Network Market Revenue Share (%), by Industry Vertical 2026 & 2034
Figure 28: Europe Private 5g Network Market Revenue (Billion), by Country 2026 & 2034
Figure 29: Europe Private 5g Network Market Revenue Share (%), by Country 2026 & 2034
Figure 30: Asia Pacific Private 5g Network Market Revenue (Billion), by Component 2026 & 2034
Figure 31: Asia Pacific Private 5g Network Market Revenue Share (%), by Component 2026 & 2034
Figure 32: Asia Pacific Private 5g Network Market Revenue (Billion), by Frequency Band 2026 & 2034
Figure 33: Asia Pacific Private 5g Network Market Revenue Share (%), by Frequency Band 2026 & 2034
Figure 34: Asia Pacific Private 5g Network Market Revenue (Billion), by Spectrum 2026 & 2034
Figure 35: Asia Pacific Private 5g Network Market Revenue Share (%), by Spectrum 2026 & 2034
Figure 36: Asia Pacific Private 5g Network Market Revenue (Billion), by Deployment Model 2026 & 2034
Figure 37: Asia Pacific Private 5g Network Market Revenue Share (%), by Deployment Model 2026 & 2034
Figure 38: Asia Pacific Private 5g Network Market Revenue (Billion), by Enterprise Size 2026 & 2034
Figure 39: Asia Pacific Private 5g Network Market Revenue Share (%), by Enterprise Size 2026 & 2034
Figure 40: Asia Pacific Private 5g Network Market Revenue (Billion), by Industry Vertical 2026 & 2034
Figure 41: Asia Pacific Private 5g Network Market Revenue Share (%), by Industry Vertical 2026 & 2034
Figure 42: Asia Pacific Private 5g Network Market Revenue (Billion), by Country 2026 & 2034
Figure 43: Asia Pacific Private 5g Network Market Revenue Share (%), by Country 2026 & 2034
Figure 44: Latin America Private 5g Network Market Revenue (Billion), by Component 2026 & 2034
Figure 45: Latin America Private 5g Network Market Revenue Share (%), by Component 2026 & 2034
Figure 46: Latin America Private 5g Network Market Revenue (Billion), by Frequency Band 2026 & 2034
Figure 47: Latin America Private 5g Network Market Revenue Share (%), by Frequency Band 2026 & 2034
Figure 48: Latin America Private 5g Network Market Revenue (Billion), by Spectrum 2026 & 2034
Figure 49: Latin America Private 5g Network Market Revenue Share (%), by Spectrum 2026 & 2034
Figure 50: Latin America Private 5g Network Market Revenue (Billion), by Deployment Model 2026 & 2034
Figure 51: Latin America Private 5g Network Market Revenue Share (%), by Deployment Model 2026 & 2034
Figure 52: Latin America Private 5g Network Market Revenue (Billion), by Enterprise Size 2026 & 2034
Figure 53: Latin America Private 5g Network Market Revenue Share (%), by Enterprise Size 2026 & 2034
Figure 54: Latin America Private 5g Network Market Revenue (Billion), by Industry Vertical 2026 & 2034
Figure 55: Latin America Private 5g Network Market Revenue Share (%), by Industry Vertical 2026 & 2034
Figure 56: Latin America Private 5g Network Market Revenue (Billion), by Country 2026 & 2034
Figure 57: Latin America Private 5g Network Market Revenue Share (%), by Country 2026 & 2034
Figure 58: Middle East & Africa Private 5g Network Market Revenue (Billion), by Component 2026 & 2034
Figure 59: Middle East & Africa Private 5g Network Market Revenue Share (%), by Component 2026 & 2034
Figure 60: Middle East & Africa Private 5g Network Market Revenue (Billion), by Frequency Band 2026 & 2034
Figure 61: Middle East & Africa Private 5g Network Market Revenue Share (%), by Frequency Band 2026 & 2034
Figure 62: Middle East & Africa Private 5g Network Market Revenue (Billion), by Spectrum 2026 & 2034
Figure 63: Middle East & Africa Private 5g Network Market Revenue Share (%), by Spectrum 2026 & 2034
Figure 64: Middle East & Africa Private 5g Network Market Revenue (Billion), by Deployment Model 2026 & 2034
Figure 65: Middle East & Africa Private 5g Network Market Revenue Share (%), by Deployment Model 2026 & 2034
Figure 66: Middle East & Africa Private 5g Network Market Revenue (Billion), by Enterprise Size 2026 & 2034
Figure 67: Middle East & Africa Private 5g Network Market Revenue Share (%), by Enterprise Size 2026 & 2034
Figure 68: Middle East & Africa Private 5g Network Market Revenue (Billion), by Industry Vertical 2026 & 2034
Figure 69: Middle East & Africa Private 5g Network Market Revenue Share (%), by Industry Vertical 2026 & 2034
Figure 70: Middle East & Africa Private 5g Network Market Revenue (Billion), by Country 2026 & 2034
Figure 71: Middle East & Africa Private 5g Network Market Revenue Share (%), by Country 2026 & 2034