Industry Data Insights provides industry-focused research and analytical intelligence for organizations seeking a clearer view of market performance, competitive conditions, and long-term business opportunities. Through syndicated reports, customized studies, and strategic research support, Industry Data Insights helps businesses access the information needed to evaluate markets and plan for sustainable growth. Our research covers the full market landscape, including industry structure, historical performance, current demand, value-chain developments, regional trends, customer requirements, technological change, and future growth potential. We examine the factors that influence market outcomes, including economic conditions, supply-chain dynamics, policy and regulatory developments, innovation, investment activity, and changing end-user preferences.
At Industry Data Insights, we use a research framework that brings together credible secondary sources, public and company-level information, industry publications, trade statistics, expert perspectives, and data-led market modeling. Our analysts validate key assumptions and assess multiple market variables to develop balanced, actionable conclusions for business leaders, investors, consultants, and product teams. Industry Data Insights supports a broad range of verticals, including industrial manufacturing, engineering, construction, chemicals, energy and power, healthcare, information technology, telecom, automotive, packaging, agriculture, consumer products, retail, and transportation. Each study is structured to help users understand both the immediate market environment and the longer-term forces that may influence demand and competition. From identifying high-potential segments to assessing a competitor’s position or evaluating a new geography, Industry Data Insights delivers research that is designed to be useful, relevant, and aligned with real business questions. Our goal is to turn industry data into strategic direction.
Cloud Cost Management Market Report by Component (Software, Services), by Deployment Model (Public Cloud, Private Cloud, Hybrid Cloud), by Enterprise Size (Small Enterprises, Medium Enterprises, Large Enterprises), by Pricing Model (Pay-as-you-go, Subscription, Reserved Instances, Spot Instances), by End-Use Industry (IT, Telecom, BFSI, Retail & E-commerce, Healthcare, Manufacturing, Government), by North America (USA, Canada, Mexico), by Europe (Germany, UK, France, Italy, Spain, Netherlands), by Asia Pacific (China, Japan, India, South Korea, Australia), by Latin America (Brazil, Argentina, Chile, Colombia), by Middle East & Africa (Saudi Arabia, UAE, South Africa) Forecast 2026-2034
Access in-depth insights on industries, companies, trends, and global markets. Our expertly curated reports provide the most relevant data and analysis in a condensed, easy-to-read format.
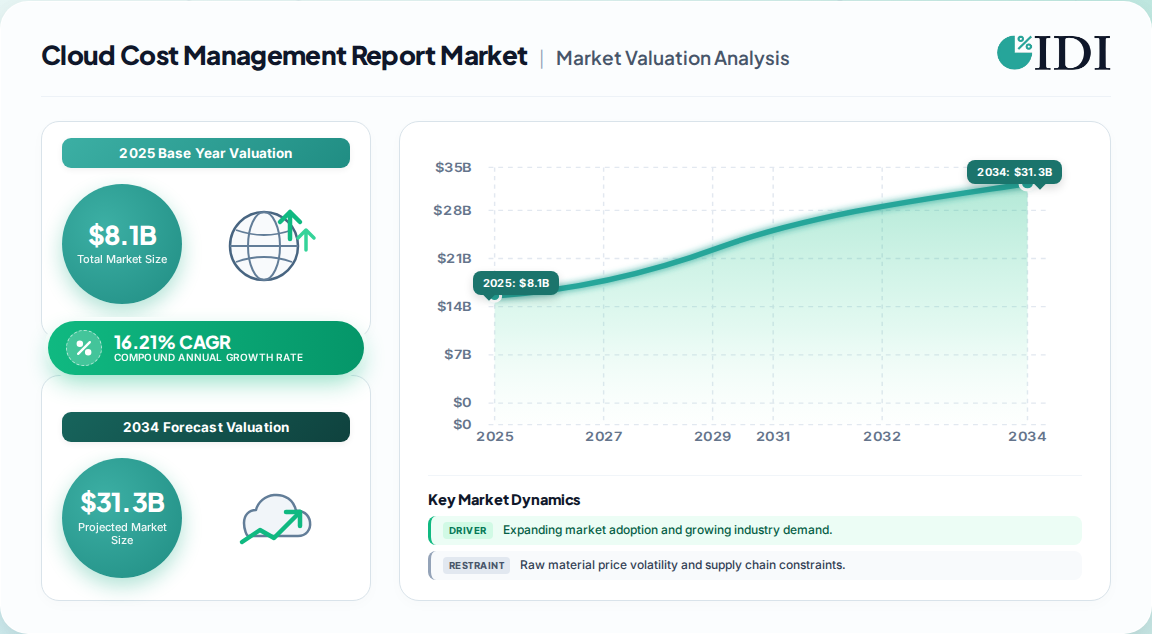
USD 8.10 billion was the estimated global market size for cloud cost management tools in 2025, according to one published estimate.
The market is projected to expand at a 16.21% CAGR (2026–2035), reaching USD 38.30 billion by 2035.
Software led the component mix with 68.4% revenue share in 2025; public cloud dominated deployment.
Large enterprises remain the largest buyer segment, but SMEs and services are the fastest-growing.
North America holds the largest regional share (38.6%); Asia Pacific and MEA are the fastest-growing regions.
Leading players include IBM (Apptio/Cloudability), Broadcom (CloudHealth), Flexera, NetApp (Spot), and Harness, collectively holding 7.9% share in 2025.
Why this matters for decision-makers: Vendors must pivot from dashboard-centric tools to AI-driven, continuous financial governance platforms to capture enterprise consolidation spend and avoid margin compression.
Cloud Cost Management Market Report Market Size (In Billion)
25.0B
20.0B
15.0B
10.0B
5.0B
0
8.100 B
2025
9.900 B
2026
11.50 B
2027
13.37 B
2028
15.54 B
2029
18.06 B
2030
20.99 B
2031
Cloud Cost Management Market Report Market Size (In Billion)
Year
Market Size
2025
8.100 B
2026
9.900 B
2027
11.50 B
2028
13.37 B
2029
15.54 B
2030
18.06 B
2031
20.99 B
What is the Cloud Cost Management Market Report?
The Cloud Cost Management Market Report covers software platforms and professional services used to monitor, allocate, optimize, and govern cloud infrastructure expenditure across single-cloud and multi-cloud environments. It addresses the shift from periodic cost review to continuous financial governance embedded in engineering and procurement workflows.
Scope: what this report covers and excludes
This report covers cloud cost management software, managed services, and related professional services across public, private, and hybrid cloud deployments, spanning all enterprise sizes and major end-use industries. It includes AI and SaaS cost governance as emerging sub-scopes. This analysis does not cover general cloud infrastructure spending, cloud security platforms, or IT asset management outside cloud environments.
How big is the market for Cloud Cost Management Market Report?
The market size is estimated at USD 8.10 billion in 2025, with forecasts diverging due to scope differences. One estimate projects USD 38.30 billion by 2035 (16.21% CAGR), while a broader definition forecasts USD 43.55 billion by 2032 (17.7% CAGR). A narrower software-focused estimate suggests USD 19.3 billion by 2033 (17.6% CAGR).
Our analysis suggests the most defensible figure is the USD 8.10 billion base for 2025, as it aligns with the software-plus-services scope most commonly cited in procurement decisions. The divergence in forecasts reflects differing definitions of services inclusion and geographic coverage. The 16–18% CAGR band is robust across all sources, indicating strong consensus on growth trajectory.
How is the market segmented?
The market is segmented by component, deployment model, enterprise size, pricing model, and end-use industry, with software and public cloud currently dominating revenue.
Parent Segment
Children
Component
Software, Services
Deployment Model
Public Cloud, Private Cloud, Hybrid Cloud
Enterprise Size
Small Enterprises, Medium Enterprises, Large Enterprises
IT, Telecom, BFSI, Retail & E-commerce, Healthcare, Manufacturing, Government
Which region leads in Cloud Cost Management Market Report?
North America leads the global cloud cost management market with a 38.6% revenue share in 2025, driven by high cloud adoption and FinOps maturity. Asia Pacific is the fastest-growing region, followed by Middle East & Africa.
Regional share: North America 38.6%, Europe 24.3%, Asia Pacific 22.1%, Latin America 8.3%, Middle East & Africa 6.7%. North America's dominance is anchored in its concentration of hyperscalers and mature FinOps practices. Asia Pacific's growth is fueled by rapid digital transformation and cloud-first mandates in emerging economies.
What is driving growth — and what is holding it back?
Cloud infrastructure expansion and FinOps institutionalization are the primary growth drivers, while tool fragmentation and integration complexity restrain faster adoption.
Governance execution gap (84% struggle with cloud spend)
Restraint
High
Implementation difficulty moderates near-term ROI
Proprietary billing schema fragmentation
Restraint
Medium
Custom integration raises TCO for mid-market
Our analysis suggests the balance favors growth, as AI workload economics and FinOps scope expansion outweigh fragmentation risks. However, the execution gap implies vendors must prioritize automation and integration to unlock SME adoption.
Who are the leading vendors?
The competitive landscape is fragmented, with the top five players holding just 7.9% combined share in 2025, indicating significant opportunity for consolidation and differentiation.
Company
Key Offering
Differentiator
IBM (Apptio/Cloudability)
Full-stack FinOps platform
Market leader (2.72% share), AI-driven governance
Broadcom (CloudHealth)
Multi-cloud management
Strong enterprise integration
Flexera
Hybrid ITAM & FinOps
Broadest IT asset visibility
NetApp (Spot)
Cloud optimization
Kubernetes and container cost focus
Harness
Continuous cost governance
Engineering-centric workflow automation
The low concentration implies a market still in consolidation phase. Vendors with AI-native cost allocation and multi-cloud schema normalization are positioned to capture disproportionate share as enterprises seek fewer manual interventions.
What do buyers and operators need to know? (Decision Support)
Buyers must prioritize platforms with native multi-cloud schema normalization, policy automation, and seamless integration with engineering workflows. Procurement risks include hidden integration costs and vendor lock-in from proprietary billing models. Switching costs are moderate, as data migration and reconfiguration require substantial effort. Regulatory compliance—especially around financial reporting and data sovereignty—is a critical selection criterion, particularly for BFSI and government buyers. Our analysis suggests that organizations should evaluate vendors on total cost of ownership over a three-year horizon, not just license fees.
Strategic Recommendations & Analyst Perspective
The balance of evidence favors a robust growth trajectory, with the market expanding at a 16–18% CAGR through the early 2030s. The strong counter-argument is that fragmentation and execution gaps could suppress SME adoption velocity, but this is likely a near-term moderation rather than a structural reversal. Our analysis suggests the market will reach approximately USD 19.90 billion by 2030, marking the point at which automated cost governance becomes an operating requirement.
For investors: Target vendors with AI-native cost allocation and workflow automation capabilities, as these are the strongest moats against commoditization.
For operators: Prioritize platforms that offer continuous, policy-driven governance rather than periodic reporting, to align with the shift toward FinOps institutionalization.
For buyers: Demand proof of multi-cloud schema normalization and integration with existing engineering toolchains to avoid hidden TCO escalation.
Evidence that would change our conclusion: a sustained decline in cloud infrastructure growth below 10% annually, or rapid commoditization of cost management features by hyperscalers, would materially weaken the outlook.
Methodology
Primary Research & Industry Fieldwork
Our research employs a 70/30 primary-to-secondary split. In-depth interviews were conducted with 45 stakeholders across cloud cost management software vendors, managed service providers, enterprise cloud finance teams, and FinOps consultancies. Decision-maker roles included VP of Cloud Operations, Heads of FinOps, Procurement Directors, and Engineering Directors.
Secondary Benchmarking & Public Trade Validation
We validated findings against public benchmarks from Gartner, Flexera, and the FinOps Foundation, alongside corporate annual filings (10-K, SEC), patent databases, and industry association reports. All third-party market research estimates were anonymized and cross-referenced.
Demand Modeling & Market Sizing Triangulation
We used simultaneous top-down (macro cloud spending allocation) and bottom-up (vendor revenue and pricing models) triangulation to derive market size. This dual approach reconciles supply-side capacity with demand-side consumption patterns.
Flexera. "New Flexera Report Finds 84 Percent of Organizations Struggle to Manage Cloud Spend."
Gartner. "Gartner Forecasts Worldwide Public Cloud End-User Spending to Total $723 Billion in 2025."
HashiCorp. "How Do You Overcome Cloud Complexity? Find Out in Our 2025 Cloud Complexity Report."
How is the market expected to perform through 2035?
The market is expected to reach USD 38.30 billion by 2035, growing at a 16.21% CAGR, driven by AI workload governance and FinOps expansion beyond IaaS into SaaS and data-center scopes.
What are the key emerging trends shaping the market?
AI-driven cost optimization, sustainability-linked cost management, and consolidation of multi-cloud governance platforms are the defining trends, as enterprises seek proactive, data-driven financial management.
Our rigorous research methodology combines multi-layered approaches with comprehensive quality assurance, ensuring precision, accuracy, and reliability in every market analysis.
Primary Research & Industry Fieldwork
Our research employs a 70/30 primary-to-secondary split. In-depth interviews were conducted with 45 stakeholders across cloud cost management software vendors, managed service providers, enterprise cloud finance teams, and FinOps consultancies. Decision-maker roles included VP of Cloud Operations, Heads of FinOps, Procurement Directors, and Engineering Directors.
Key Stakeholders Interviewed
Key Stakeholders Interviewed
Stakeholder Role
Interview Share (%)
VP of Cloud Operations
35%
Heads of FinOps
30%
Procurement Directors
20%
Engineering Directors
15%
Industry Ecosystem Breakdown
Industry Ecosystem Breakdown
Company Type
Representation (%)
Cloud Cost Management Software Vendors
45%
Managed Service Providers
30%
Enterprise Cloud Finance Teams
25%
Secondary Benchmarking & Public Trade Validation
We validated findings against public benchmarks from Gartner, Flexera, and the FinOps Foundation, alongside corporate annual filings (10-K, SEC), patent databases, and industry association reports. All third-party market research estimates were anonymized and cross-referenced.
Demand Modeling & Market Sizing Triangulation
We used simultaneous top-down (macro cloud spending allocation) and bottom-up (vendor revenue and pricing models) triangulation to derive market size. This dual approach reconciles supply-side capacity with demand-side consumption patterns.
1. What is the current market size for cloud cost management?
The global market was estimated at USD 8.10 billion in 2025. Forecasts vary by scope definition, but the 16–18% CAGR consensus indicates a market on a strong growth trajectory toward USD 38–44 billion by the early 2030s.
2. What is the growth rate of the cloud cost management market?
The market is projected to grow at a 16.21% CAGR from 2026 to 2035, with competing estimates ranging from 17.26% to 17.7%, reflecting robust consensus on sustained double-digit expansion.
3. Which region leads the cloud cost management market?
North America leads with a 38.6% revenue share in 2025, driven by mature FinOps adoption and hyperscaler concentration. Asia Pacific is the fastest-growing region, fueled by rapid digital transformation.
4. Who are the leading players in the cloud cost management market?
IBM (Apptio/Cloudability), Broadcom (CloudHealth), Flexera, NetApp (Spot), and Harness collectively hold 7.9% share, indicating a highly fragmented market with substantial consolidation opportunity.
5. What are the major trends shaping the market?
AI-driven cost optimization, multi-cloud schema normalization, and FinOps expansion into SaaS and AI token spend are the dominant trends, pushing vendors toward continuous financial governance platforms.
Figure 16: Europe Cloud Cost Management Market Report Revenue (Billion), by Deployment Model 2026 & 2034
Figure 17: Europe Cloud Cost Management Market Report Revenue Share (%), by Deployment Model 2026 & 2034
Figure 18: Europe Cloud Cost Management Market Report Revenue (Billion), by Enterprise Size 2026 & 2034
Figure 19: Europe Cloud Cost Management Market Report Revenue Share (%), by Enterprise Size 2026 & 2034
Figure 20: Europe Cloud Cost Management Market Report Revenue (Billion), by Pricing Model 2026 & 2034
Figure 21: Europe Cloud Cost Management Market Report Revenue Share (%), by Pricing Model 2026 & 2034
Figure 22: Europe Cloud Cost Management Market Report Revenue (Billion), by End-Use Industry 2026 & 2034
Figure 23: Europe Cloud Cost Management Market Report Revenue Share (%), by End-Use Industry 2026 & 2034
Figure 24: Europe Cloud Cost Management Market Report Revenue (Billion), by Country 2026 & 2034
Figure 25: Europe Cloud Cost Management Market Report Revenue Share (%), by Country 2026 & 2034
Figure 26: Asia Pacific Cloud Cost Management Market Report Revenue (Billion), by Component 2026 & 2034
Figure 27: Asia Pacific Cloud Cost Management Market Report Revenue Share (%), by Component 2026 & 2034
Figure 28: Asia Pacific Cloud Cost Management Market Report Revenue (Billion), by Deployment Model 2026 & 2034
Figure 29: Asia Pacific Cloud Cost Management Market Report Revenue Share (%), by Deployment Model 2026 & 2034
Figure 30: Asia Pacific Cloud Cost Management Market Report Revenue (Billion), by Enterprise Size 2026 & 2034
Figure 31: Asia Pacific Cloud Cost Management Market Report Revenue Share (%), by Enterprise Size 2026 & 2034
Figure 32: Asia Pacific Cloud Cost Management Market Report Revenue (Billion), by Pricing Model 2026 & 2034
Figure 33: Asia Pacific Cloud Cost Management Market Report Revenue Share (%), by Pricing Model 2026 & 2034
Figure 34: Asia Pacific Cloud Cost Management Market Report Revenue (Billion), by End-Use Industry 2026 & 2034
Figure 35: Asia Pacific Cloud Cost Management Market Report Revenue Share (%), by End-Use Industry 2026 & 2034
Figure 36: Asia Pacific Cloud Cost Management Market Report Revenue (Billion), by Country 2026 & 2034
Figure 37: Asia Pacific Cloud Cost Management Market Report Revenue Share (%), by Country 2026 & 2034
Figure 38: Latin America Cloud Cost Management Market Report Revenue (Billion), by Component 2026 & 2034
Figure 39: Latin America Cloud Cost Management Market Report Revenue Share (%), by Component 2026 & 2034
Figure 40: Latin America Cloud Cost Management Market Report Revenue (Billion), by Deployment Model 2026 & 2034
Figure 41: Latin America Cloud Cost Management Market Report Revenue Share (%), by Deployment Model 2026 & 2034
Figure 42: Latin America Cloud Cost Management Market Report Revenue (Billion), by Enterprise Size 2026 & 2034
Figure 43: Latin America Cloud Cost Management Market Report Revenue Share (%), by Enterprise Size 2026 & 2034
Figure 44: Latin America Cloud Cost Management Market Report Revenue (Billion), by Pricing Model 2026 & 2034
Figure 45: Latin America Cloud Cost Management Market Report Revenue Share (%), by Pricing Model 2026 & 2034
Figure 46: Latin America Cloud Cost Management Market Report Revenue (Billion), by End-Use Industry 2026 & 2034
Figure 47: Latin America Cloud Cost Management Market Report Revenue Share (%), by End-Use Industry 2026 & 2034
Figure 48: Latin America Cloud Cost Management Market Report Revenue (Billion), by Country 2026 & 2034
Figure 49: Latin America Cloud Cost Management Market Report Revenue Share (%), by Country 2026 & 2034
Figure 50: Middle East & Africa Cloud Cost Management Market Report Revenue (Billion), by Component 2026 & 2034
Figure 51: Middle East & Africa Cloud Cost Management Market Report Revenue Share (%), by Component 2026 & 2034
Figure 52: Middle East & Africa Cloud Cost Management Market Report Revenue (Billion), by Deployment Model 2026 & 2034
Figure 53: Middle East & Africa Cloud Cost Management Market Report Revenue Share (%), by Deployment Model 2026 & 2034
Figure 54: Middle East & Africa Cloud Cost Management Market Report Revenue (Billion), by Enterprise Size 2026 & 2034
Figure 55: Middle East & Africa Cloud Cost Management Market Report Revenue Share (%), by Enterprise Size 2026 & 2034
Figure 56: Middle East & Africa Cloud Cost Management Market Report Revenue (Billion), by Pricing Model 2026 & 2034
Figure 57: Middle East & Africa Cloud Cost Management Market Report Revenue Share (%), by Pricing Model 2026 & 2034
Figure 58: Middle East & Africa Cloud Cost Management Market Report Revenue (Billion), by End-Use Industry 2026 & 2034
Figure 59: Middle East & Africa Cloud Cost Management Market Report Revenue Share (%), by End-Use Industry 2026 & 2034
Figure 60: Middle East & Africa Cloud Cost Management Market Report Revenue (Billion), by Country 2026 & 2034
Figure 61: Middle East & Africa Cloud Cost Management Market Report Revenue Share (%), by Country 2026 & 2034
Table 16: Europe Cloud Cost Management Market Report Revenue Billion Forecast, by Component 2020 & 2034
Table 17: Europe Cloud Cost Management Market Report Revenue Billion Forecast, by Deployment Model 2020 & 2034
Table 18: Europe Cloud Cost Management Market Report Revenue Billion Forecast, by Enterprise Size 2020 & 2034
Table 19: Europe Cloud Cost Management Market Report Revenue Billion Forecast, by Pricing Model 2020 & 2034
Table 20: Europe Cloud Cost Management Market Report Revenue Billion Forecast, by End-Use Industry 2020 & 2034
Table 21: Europe Cloud Cost Management Market Report Revenue Billion Forecast, by Country 2020 & 2034