Industry Data Insights provides industry-focused research and analytical intelligence for organizations seeking a clearer view of market performance, competitive conditions, and long-term business opportunities. Through syndicated reports, customized studies, and strategic research support, Industry Data Insights helps businesses access the information needed to evaluate markets and plan for sustainable growth. Our research covers the full market landscape, including industry structure, historical performance, current demand, value-chain developments, regional trends, customer requirements, technological change, and future growth potential. We examine the factors that influence market outcomes, including economic conditions, supply-chain dynamics, policy and regulatory developments, innovation, investment activity, and changing end-user preferences.
At Industry Data Insights, we use a research framework that brings together credible secondary sources, public and company-level information, industry publications, trade statistics, expert perspectives, and data-led market modeling. Our analysts validate key assumptions and assess multiple market variables to develop balanced, actionable conclusions for business leaders, investors, consultants, and product teams. Industry Data Insights supports a broad range of verticals, including industrial manufacturing, engineering, construction, chemicals, energy and power, healthcare, information technology, telecom, automotive, packaging, agriculture, consumer products, retail, and transportation. Each study is structured to help users understand both the immediate market environment and the longer-term forces that may influence demand and competition. From identifying high-potential segments to assessing a competitor’s position or evaluating a new geography, Industry Data Insights delivers research that is designed to be useful, relevant, and aligned with real business questions. Our goal is to turn industry data into strategic direction.
US Patient Positioning Support Aids Market Report 2026
Us Patient Positioning Support Aids Market Report by Product Type (Patient Positioning Devices, Gel Positioners, Air-Assisted Transfer Aids, Slide Sheets, Offloading Devices), by Material (Foam, Gel, Plastic, Metal), by Application (Surgery, Diagnostics/Imaging, Therapy/Rehabilitation, Emergency Care), by End User (Hospitals, Ambulatory Surgical Centers, Nursing Homes, Home Care), by Patient Population (Adult, Pediatric, Bariatric, Geriatric), by Distribution Channel (Direct Sales, Distributor/GPO, E-commerce), by South (Texas, Florida, Georgia, North Carolina, Tennessee), by Northeast (New York, Pennsylvania, Massachusetts, New Jersey), by West (California, Arizona, Washington, Colorado), by Midwest (Illinois, Ohio, Michigan, Minnesota, Missouri) Forecast 2026-2034
US Patient Positioning Support Aids Market Report 2026
Discover the Latest Market Insight Reports
Access in-depth insights on industries, companies, trends, and global markets. Our expertly curated reports provide the most relevant data and analysis in a condensed, easy-to-read format.
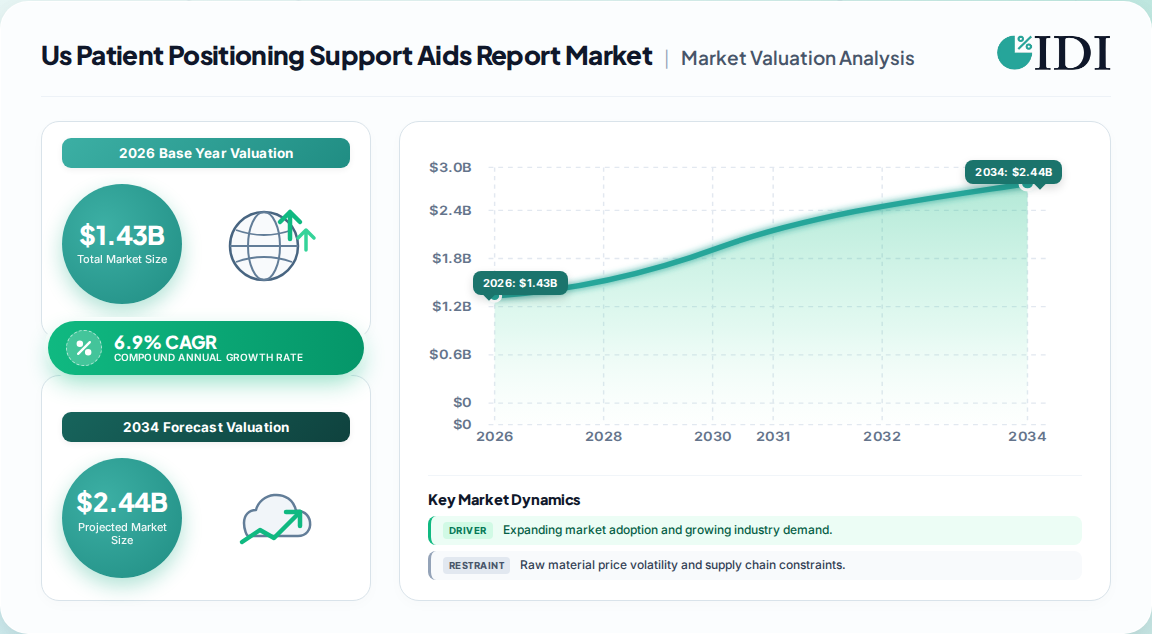
USD 1.43 billion is the 2026 base valuation for U.S. patient positioning support aids, with a 6.9% CAGR to USD 2.61 billion by 2035.
Forecast growth is structural, not cyclical: surgical volume, an 18% population aged 65+, and pressure-injury accountability drive adoption.
Patient positioning devices lead product mix at roughly 38%; foam-based materials hold about 42% due to pressure redistribution and cost efficiency.
Hospitals account for approximately 48% of demand; ambulatory surgical centers are the fastest-growing end-use tier.
Leading vendors include Hillrom (Baxter), Stryker, Medline, Cardinal Health, AliMed, Span-America (Savaria), and Xodus Medical.
Why this matters for decision-makers: vendors and GPO buyers should re-underwrite product portfolios around pressure-injury prevention and ASC-compatible designs, because that is where incremental 2026–2030 spend is concentrating.
Us Patient Positioning Support Aids Market Report Market Size (In Billion)
2.0B
1.5B
1.0B
500.0M
0
1.250 B
2024
1.340 B
2025
1.430 B
2026
1.530 B
2027
1.630 B
2028
1.750 B
2029
1.870 B
2030
Us Patient Positioning Support Aids Market Report Market Size (In Billion)
Year
Market Size
2024
1.250 B
2025
1.340 B
2026
1.430 B
2027
1.530 B
2028
1.630 B
2029
1.750 B
2030
1.870 B
What is the Us Patient Positioning Support Aids Market Report?
The U.S. patient positioning support aids market covers medical devices and consumables—positioning wedges, bolsters, gel and foam positioners, headrests, and transfer aids—used to stabilize, protect, and reposition patients during surgery, imaging, therapy, and long-term care. It is measured at manufacturer-level revenue across hospitals, ASCs, and nursing facilities.
Scope: what this report covers and excludes
This report scope is country-level (United States) and covers product revenue for positioning and support aids across surgery, diagnostics/imaging, therapy, and long-term care, by product type, material, application, end user, patient population, and distribution channel. It excludes operating-room tables and surgical booms (capital equipment), wheelchairs and mobility scooters, general hospital beds, and wound-care dressings except where bundled into a positioning system. This analysis does not cover global or ex-U.S. demand, nor does it size adjacent negative-pressure therapy or bariatric handling equipment.
How big is the market for Us Patient Positioning Support Aids Market Report?
Available published estimates for the U.S. market diverge materially—from roughly USD 1.3 billion to USD 1.7 billion for 2025—because definitions of "positioning support aids" vary in whether they include transfer aids, offloading devices, and imaging accessories. The table below normalizes the competing figures.
Estimate
Base year
Horizon
CAGR
Definition / scope
Attribution
USD 1.34B
2025
2035
6.9%
Positioning devices + support aids, U.S. only
One published estimate
USD 1.7B
2025
2035
3.9%
Broader cushions, pillows, wedges, rolls
A competing analysis
USD 1.6B global
2024
2030
7.1%
Global positioning and support aids; U.S. ≈ 37.7%
Another published benchmark
The USD 1.34B / 6.9% path is the most defensible for U.S.-only scope: it aligns with the global figure (U.S. share of 37.7% applied to USD 1.6B in 2024 yields ~USD 1.2–1.3B) and with surgical-volume growth. The 3.9% estimate likely embeds a narrower product basket and conservative ASC pricing. Our analysis suggests a 2026 base of USD 1.43 billion and 6.9% CAGR is the best planning anchor for procurement and investment models.
How is the market segmented?
Segmentation matters because growth is uneven: foam and devices lead revenue today, while ASC-compatible and smart-monitoring formats carry the steepest trajectory.
Parent segment
Children
2025 share (est.)
By Product Type
Patient positioning devices (wedges, bolsters, pillows, headrests/cradles), gel positioners, air-assisted transfer aids, slide sheets, offloading devices
Devices ≈38%
By Material
Foam, gel, plastic, metal, hybrid
Foam ≈42%
By Application
Surgery, diagnostics/imaging, therapy/rehabilitation, emergency care
Surgery ≈36%
By End User
Hospitals, ambulatory surgical centers, nursing homes, home care
Hospitals ≈48%
By Patient Population
Adult, pediatric, bariatric, geriatric
Adult ≈45%
By Distribution Channel
Direct sales, distributor/GPO, e-commerce
Direct ≈39%
Which U.S. region leads in Us Patient Positioning Support Aids Market Report?
Demand concentrates in the South, which holds the largest share of hospital beds, ASC expansion under Medicare, and the fastest-growing 65+ population—followed closely by the Northeast's dense academic-medical-center corridor.
Us Patient Positioning Support Aids Market Report Regional Market Share
Loading chart...
Us Patient Positioning Support Aids Market Report Regional Market Share
Region
Market Share (%)
Northeast
0.24%
South
0.31%
Midwest
0.21%
West
0.24%
South — ~31%: high surgical volume, rapid ASC build-out, large geriatric cohort.
Texas, Florida, Georgia, North Carolina, Tennessee
Northeast
New York, Pennsylvania, Massachusetts, New Jersey
West
California, Arizona, Washington, Colorado
Midwest
Illinois, Ohio, Michigan, Minnesota, Missouri
What is driving growth — and what is holding it back?
Growth is driven by structural surgical demand and a regulatory-quality shift toward pressure-injury prevention, while adoption is restrained by price sensitivity, reprocessing of reusable aids, and clinical-training gaps.
Factor
Direction
Evidence strength
Mechanism
Rising surgical procedures
Driver
High
~310M major surgeries globally; U.S. hip/knee replacements alone exceed 1.3M annually
Aging population (18% aged 65+)
Driver
High
More procedures, long-term care, and repositioning protocols
Pressure-injury accountability
Driver
High
HAI and pressure-ulcer penalties push facilities toward specialized aids
Improper use erodes perceived ROI and slows replacement cycles
Who are the leading vendors?
Competition is moderately concentrated: diversified medtech and distribution giants hold procurement leverage, while specialists defend niches through design patents and GPO contracts.
Company
Positioning
Notable strength
Hillrom (Baxter International)
Broad portfolio
Bed frames, surfaces, and positioning integration
Stryker Corporation
OR and surgical
Surgical positioning systems and tables
Medline Industries
Distribution scale
Private-label and broad hospital supply
Cardinal Health
Distribution/GPO access
Contract reach and logistics
AliMed
Specialty consumables
Positioning aids and ergonomic accessories
Span-America (Savaria)
Foam and surfaces
Pressure-redistribution materials
Xodus Medical
OR consumables
Gel positioners and surgical accessories
Differentiation increasingly rests on material science (foam/gel blends), patent-protected designs (e.g., anti-skid strips and integrated arm protectors), and GPO contract coverage rather than on price alone. Our analysis suggests the durable moat is clinical evidence plus training ecosystems, because switching costs sit in protocol change, not device price.
What do buyers and operators need to know?
Selection should prioritize pressure-redistribution performance and cleanability over unit price, since pressure injuries and HAIs carry the largest downstream cost. Confirm FDA device classification, ISO 10993 biocompatibility evidence, and validated reprocessing instructions for reusable aids. Procurement risk concentrates in single-source GPO contracts and in ASC settings where portability and storage compete with clinical capability. Switching costs are moderate: device replacement is inexpensive, but retraining staff and revising positioning protocols create real friction—so pilot before standardizing. Total cost of ownership, not sticker price, should drive award decisions.
Strategic Recommendations & Analyst Perspective
The balance of evidence favors a 6.5–7% U.S. CAGR through 2035, anchored on surgical volume and pressure-injury economics rather than on device novelty. The strongest counter-argument is that ASC price pressure and reusable-aid reprocessing could push realized growth toward the 4% end of the range—but that view underweights the accountability-driven upgrade cycle in hospitals, which is where 48% of spend sits. Our analysis suggests vendors that bundle device, training, and outcome data will outcompete those selling commodity foam.
Vendors: prioritize ASC-compatible, foam-led portfolios with pressure-mapping validation to capture the fastest-growing channel.
Hospital operators: standardize around a GPO-contracted core set and use pressure-injury incidence as the contract scorecard.
Investors: concentrate diligence on companies with patented designs and training ecosystems, not on low-cost commodity suppliers.
What would change this conclusion: a sustained decline in elective surgical volume, or CMS policy removing pressure-injury financial penalties, would materially lower the growth path and shift value toward acute-care niches only.
Us Patient Positioning Support Aids Market Report Regional Market Share
Higher Coverage
Lower Coverage
No Coverage
Us Patient Positioning Support Aids Market Report REPORT HIGHLIGHTS
Research Methodology & Data Sources
Our rigorous research methodology combines multi-layered approaches with comprehensive quality assurance, ensuring precision, accuracy, and reliability in every market analysis.
Primary Research & Industry Fieldwork
We apply a 70/30 primary-to-secondary research split. In-depth interviews were conducted across the value chain: raw-material and foam/gel suppliers, specialized positioning-aid producers, contract manufacturers, and national medical-surgical distributors. Interviewees included VP-level Sourcing leads, Heads of R&D, Technical Directors, and Commercial Operations Leads at hospitals and GPOs, ensuring demand-side and supply-side validation.
Key Stakeholders Interviewed
Key Stakeholders Interviewed
Stakeholder Role
Interview Share (%)
Sourcing & Procurement Leads
35%
R&D & Technical Directors
30%
Clinical & Nursing Operations
20%
Regulatory & Quality Managers
15%
Industry Ecosystem Breakdown
Industry Ecosystem Breakdown
Company Type
Representation (%)
Positioning Aid Manufacturers
40%
Raw Material & Foam/Gel Suppliers
25%
Medical-Surgical Distributors
20%
Hospital & GPO Procurement
15%
Secondary Benchmarking & Public Trade Validation
We triangulate against official multilateral and standards sources—UN Comtrade, US ITC, Eurostat, WHO and CMS datasets—alongside corporate annual filings (10-K, SEC), investor presentations, patent databases, and recognized technical standards bodies such as ISO and AAMI. This anchors every estimate in verifiable public evidence rather than single-publisher claims.
Demand Modeling & Market Sizing Triangulation
We run simultaneous top-down (macro healthcare spend, surgical volume, bed counts) and bottom-up (manufacturer capacity, pricing, end-use consumption) models. Divergences are reconciled through weighted triangulation, with base-year values cross-checked against import/export flows and facility-level procurement benchmarks.
U.S. Food and Drug Administration (FDA) device classification and 510(k) databases
Centers for Medicare & Medicaid Services (CMS) ASC payment and quality datasets
ISO 10993 biocompatibility and AAMI pressure-injury standards
UN Comtrade and US ITC medical-device trade statistics
Aspects
Details
Study Period
2020-2034
Base Year
2025
Estimated Year
2026
Forecast Period
2026-2034
Historical Period
2020-2025
Growth Rate
CAGR of 6.9% from 2020-2034
Segmentation
By Product Type
Patient Positioning Devices
Gel Positioners
Air-Assisted Transfer Aids
Slide Sheets
Offloading Devices
By Material
Foam
Gel
Plastic
Metal
By Application
Surgery
Diagnostics/Imaging
Therapy/Rehabilitation
Emergency Care
By End User
Hospitals
Ambulatory Surgical Centers
Nursing Homes
Home Care
By Patient Population
Adult
Pediatric
Bariatric
Geriatric
By Distribution Channel
Direct Sales
Distributor/GPO
E-commerce
By Geography
South
Texas
Florida
Georgia
North Carolina
Tennessee
Northeast
New York
Pennsylvania
Massachusetts
New Jersey
West
California
Arizona
Washington
Colorado
Midwest
Illinois
Ohio
Michigan
Minnesota
Missouri
Table of Contents
1. Us Patient Positioning Support Aids Market Report Introduction
1.1. Research Scope
1.2. Market Segmentation
1.3. Research Objective
1.4. Definitions and Assumptions
2. Us Patient Positioning Support Aids Market Report Executive Summary
2.1. Market Snapshot
3. Us Patient Positioning Support Aids Market Report Dynamics
3.1. Introduction
3.2. Market Drivers
3.3. Market Restrains
3.4. Market Trends
4. Us Patient Positioning Support Aids Market Report Factor Analysis
4.1. Porters Five Forces
4.1.1. Bargaining Power of Suppliers
4.1.2. Bargaining Power of Buyers
4.1.3. Threat of New Entrants
4.1.4. Threat of Substitutes
4.1.5. Competitive Rivalry
4.2. PESTEL analysis
4.3. BCG Analysis
4.3.1. Stars (High Growth, High Market Share)
4.3.2. Cash Cows (Low Growth, High Market Share)
4.3.3. Question Mark (High Growth, Low Market Share)
4.3.4. Dogs (Low Growth, Low Market Share)
4.4. Ansoff Matrix Analysis
4.5. Supply Chain Analysis
4.6. Regulatory Landscape
4.7. Current Market Potential and Opportunity Assessment (TAM–SAM–SOM Framework)
4.8. IDI Analyst Note
5. Us Patient Positioning Support Aids Market Report Analysis, Insights and Forecast, 2020-2034
5.1. Analysis, Insights and Forecast - by Product Type
5.1.1. Patient Positioning Devices
5.1.2. Gel Positioners
5.1.3. Air-Assisted Transfer Aids
5.1.4. Slide Sheets
5.1.5. Offloading Devices
5.2. Analysis, Insights and Forecast - by Material
5.2.1. Foam
5.2.2. Gel
5.2.3. Plastic
5.2.4. Metal
5.3. Analysis, Insights and Forecast - by Application
5.3.1. Surgery
5.3.2. Diagnostics/Imaging
5.3.3. Therapy/Rehabilitation
5.3.4. Emergency Care
5.4. Analysis, Insights and Forecast - by End User
5.4.1. Hospitals
5.4.2. Ambulatory Surgical Centers
5.4.3. Nursing Homes
5.4.4. Home Care
5.5. Analysis, Insights and Forecast - by Patient Population
5.5.1. Adult
5.5.2. Pediatric
5.5.3. Bariatric
5.5.4. Geriatric
5.6. Analysis, Insights and Forecast - by Distribution Channel
5.6.1. Direct Sales
5.6.2. Distributor/GPO
5.6.3. E-commerce
5.7. Analysis, Insights and Forecast - by Region
5.7.1. South
5.7.2. Northeast
5.7.3. West
5.7.4. Midwest
6. Us Patient Positioning Support Aids Market Report South Analysis, Insights and Forecast, 2020-2034
6.1. Analysis, Insights and Forecast - by Product Type
6.1.1. Patient Positioning Devices
6.1.2. Gel Positioners
6.1.3. Air-Assisted Transfer Aids
6.1.4. Slide Sheets
6.1.5. Offloading Devices
6.2. Analysis, Insights and Forecast - by Material
6.2.1. Foam
6.2.2. Gel
6.2.3. Plastic
6.2.4. Metal
6.3. Analysis, Insights and Forecast - by Application
6.3.1. Surgery
6.3.2. Diagnostics/Imaging
6.3.3. Therapy/Rehabilitation
6.3.4. Emergency Care
6.4. Analysis, Insights and Forecast - by End User
6.4.1. Hospitals
6.4.2. Ambulatory Surgical Centers
6.4.3. Nursing Homes
6.4.4. Home Care
6.5. Analysis, Insights and Forecast - by Patient Population
6.5.1. Adult
6.5.2. Pediatric
6.5.3. Bariatric
6.5.4. Geriatric
6.6. Analysis, Insights and Forecast - by Distribution Channel
6.6.1. Direct Sales
6.6.2. Distributor/GPO
6.6.3. E-commerce
7. Us Patient Positioning Support Aids Market Report Northeast Analysis, Insights and Forecast, 2020-2034
7.1. Analysis, Insights and Forecast - by Product Type
7.1.1. Patient Positioning Devices
7.1.2. Gel Positioners
7.1.3. Air-Assisted Transfer Aids
7.1.4. Slide Sheets
7.1.5. Offloading Devices
7.2. Analysis, Insights and Forecast - by Material
7.2.1. Foam
7.2.2. Gel
7.2.3. Plastic
7.2.4. Metal
7.3. Analysis, Insights and Forecast - by Application
7.3.1. Surgery
7.3.2. Diagnostics/Imaging
7.3.3. Therapy/Rehabilitation
7.3.4. Emergency Care
7.4. Analysis, Insights and Forecast - by End User
7.4.1. Hospitals
7.4.2. Ambulatory Surgical Centers
7.4.3. Nursing Homes
7.4.4. Home Care
7.5. Analysis, Insights and Forecast - by Patient Population
7.5.1. Adult
7.5.2. Pediatric
7.5.3. Bariatric
7.5.4. Geriatric
7.6. Analysis, Insights and Forecast - by Distribution Channel
7.6.1. Direct Sales
7.6.2. Distributor/GPO
7.6.3. E-commerce
8. Us Patient Positioning Support Aids Market Report West Analysis, Insights and Forecast, 2020-2034
8.1. Analysis, Insights and Forecast - by Product Type
8.1.1. Patient Positioning Devices
8.1.2. Gel Positioners
8.1.3. Air-Assisted Transfer Aids
8.1.4. Slide Sheets
8.1.5. Offloading Devices
8.2. Analysis, Insights and Forecast - by Material
8.2.1. Foam
8.2.2. Gel
8.2.3. Plastic
8.2.4. Metal
8.3. Analysis, Insights and Forecast - by Application
8.3.1. Surgery
8.3.2. Diagnostics/Imaging
8.3.3. Therapy/Rehabilitation
8.3.4. Emergency Care
8.4. Analysis, Insights and Forecast - by End User
8.4.1. Hospitals
8.4.2. Ambulatory Surgical Centers
8.4.3. Nursing Homes
8.4.4. Home Care
8.5. Analysis, Insights and Forecast - by Patient Population
8.5.1. Adult
8.5.2. Pediatric
8.5.3. Bariatric
8.5.4. Geriatric
8.6. Analysis, Insights and Forecast - by Distribution Channel
8.6.1. Direct Sales
8.6.2. Distributor/GPO
8.6.3. E-commerce
9. Us Patient Positioning Support Aids Market Report Midwest Analysis, Insights and Forecast, 2020-2034
9.1. Analysis, Insights and Forecast - by Product Type
9.1.1. Patient Positioning Devices
9.1.2. Gel Positioners
9.1.3. Air-Assisted Transfer Aids
9.1.4. Slide Sheets
9.1.5. Offloading Devices
9.2. Analysis, Insights and Forecast - by Material
9.2.1. Foam
9.2.2. Gel
9.2.3. Plastic
9.2.4. Metal
9.3. Analysis, Insights and Forecast - by Application
9.3.1. Surgery
9.3.2. Diagnostics/Imaging
9.3.3. Therapy/Rehabilitation
9.3.4. Emergency Care
9.4. Analysis, Insights and Forecast - by End User
9.4.1. Hospitals
9.4.2. Ambulatory Surgical Centers
9.4.3. Nursing Homes
9.4.4. Home Care
9.5. Analysis, Insights and Forecast - by Patient Population
9.5.1. Adult
9.5.2. Pediatric
9.5.3. Bariatric
9.5.4. Geriatric
9.6. Analysis, Insights and Forecast - by Distribution Channel
9.6.1. Direct Sales
9.6.2. Distributor/GPO
9.6.3. E-commerce
10. Us Patient Positioning Support Aids Market Report Competitive Analysis
10.1. Company Profiles
10.2. Market Entropy
10.2.1. Company's Key Areas Served
10.2.2. Recent Developments
10.3. Company Market Share Analysis, 2026
10.3.1. Top 5 Companies Market Share Analysis
10.3.2. Top 3 Companies Market Share Analysis
10.4. List of Potential Customers
11. Us Patient Positioning Support Aids Market Report Research Methodology
List of Figures
Figure 1: Us Patient Positioning Support Aids Market Report Revenue Breakdown (Billion, %) by Product 2026 & 2034
Figure 2: Us Patient Positioning Support Aids Market Report Value Share (%), by Product Type 2026 & 2034
Figure 3: Us Patient Positioning Support Aids Market Report Value Share (%), by Material 2026 & 2034
Figure 4: Us Patient Positioning Support Aids Market Report Value Share (%), by Application 2026 & 2034
Figure 5: Us Patient Positioning Support Aids Market Report Value Share (%), by End User 2026 & 2034
Figure 6: Us Patient Positioning Support Aids Market Report Value Share (%), by Patient Population 2026 & 2034
Figure 7: Us Patient Positioning Support Aids Market Report Value Share (%), by Distribution Channel 2026 & 2034
Figure 8: Us Patient Positioning Support Aids Market Report Share (%) by Company 2026
List of Tables
Table 1: Us Patient Positioning Support Aids Market Report Revenue Billion Forecast, by Product Type 2020 & 2034
Table 2: Us Patient Positioning Support Aids Market Report Revenue Billion Forecast, by Material 2020 & 2034
Table 3: Us Patient Positioning Support Aids Market Report Revenue Billion Forecast, by Application 2020 & 2034
Table 4: Us Patient Positioning Support Aids Market Report Revenue Billion Forecast, by End User 2020 & 2034
Table 5: Us Patient Positioning Support Aids Market Report Revenue Billion Forecast, by Patient Population 2020 & 2034
Table 6: Us Patient Positioning Support Aids Market Report Revenue Billion Forecast, by Distribution Channel 2020 & 2034
Table 7: Us Patient Positioning Support Aids Market Report Revenue Billion Forecast, by Region 2020 & 2034
Table 8: South Us Patient Positioning Support Aids Market Report Revenue Billion Forecast, by Product Type 2020 & 2034
Table 9: South Us Patient Positioning Support Aids Market Report Revenue Billion Forecast, by Material 2020 & 2034
Table 10: South Us Patient Positioning Support Aids Market Report Revenue Billion Forecast, by Application 2020 & 2034
Table 11: South Us Patient Positioning Support Aids Market Report Revenue Billion Forecast, by End User 2020 & 2034
Table 12: South Us Patient Positioning Support Aids Market Report Revenue Billion Forecast, by Patient Population 2020 & 2034
Table 13: South Us Patient Positioning Support Aids Market Report Revenue Billion Forecast, by Distribution Channel 2020 & 2034
Table 14: South Us Patient Positioning Support Aids Market Report Revenue Billion Forecast, by Country 2020 & 2034
Texas Us Patient Positioning Support Aids Market Report Revenue (Billion) Forecast, by Application 2020 & 2034
Frequently Asked Questions
1. How big is the U.S. patient positioning support aids market?
The U.S. market is estimated at USD 1.43 billion in 2026 and projected to reach USD 2.61 billion by 2035, growing at a 6.9% CAGR, per one published estimate.
2. What is the fastest-growing segment?
Ambulatory surgical centers are the fastest-growing end-user segment, driven by the shift of procedures to outpatient settings and demand for portable, efficient positioning aids.
3. Which companies lead the U.S. market?
Leading players include Hillrom (Baxter), Stryker, Medline, Cardinal Health, AliMed, Span-America (Savaria), and Xodus Medical, competing on design, materials, and GPO contracts.
4. What drives demand for patient positioning support aids?
Rising surgical volumes, an aging population, pressure-injury prevention mandates, and ASC expansion drive demand, while price sensitivity and training gaps restrain adoption.
Table 15:
Table 16: Florida Us Patient Positioning Support Aids Market Report Revenue (Billion) Forecast, by Application 2020 & 2034
Table 17: Georgia Us Patient Positioning Support Aids Market Report Revenue (Billion) Forecast, by Application 2020 & 2034
Table 18: North Carolina Us Patient Positioning Support Aids Market Report Revenue (Billion) Forecast, by Application 2020 & 2034
Table 19: Tennessee Us Patient Positioning Support Aids Market Report Revenue (Billion) Forecast, by Application 2020 & 2034
Table 20: Northeast Us Patient Positioning Support Aids Market Report Revenue Billion Forecast, by Product Type 2020 & 2034
Table 21: Northeast Us Patient Positioning Support Aids Market Report Revenue Billion Forecast, by Material 2020 & 2034
Table 22: Northeast Us Patient Positioning Support Aids Market Report Revenue Billion Forecast, by Application 2020 & 2034
Table 23: Northeast Us Patient Positioning Support Aids Market Report Revenue Billion Forecast, by End User 2020 & 2034
Table 24: Northeast Us Patient Positioning Support Aids Market Report Revenue Billion Forecast, by Patient Population 2020 & 2034
Table 25: Northeast Us Patient Positioning Support Aids Market Report Revenue Billion Forecast, by Distribution Channel 2020 & 2034
Table 26: Northeast Us Patient Positioning Support Aids Market Report Revenue Billion Forecast, by Country 2020 & 2034
Table 27: New York Us Patient Positioning Support Aids Market Report Revenue (Billion) Forecast, by Application 2020 & 2034
Table 28: Pennsylvania Us Patient Positioning Support Aids Market Report Revenue (Billion) Forecast, by Application 2020 & 2034
Table 29: Massachusetts Us Patient Positioning Support Aids Market Report Revenue (Billion) Forecast, by Application 2020 & 2034
Table 30: New Jersey Us Patient Positioning Support Aids Market Report Revenue (Billion) Forecast, by Application 2020 & 2034
Table 31: West Us Patient Positioning Support Aids Market Report Revenue Billion Forecast, by Product Type 2020 & 2034
Table 32: West Us Patient Positioning Support Aids Market Report Revenue Billion Forecast, by Material 2020 & 2034
Table 33: West Us Patient Positioning Support Aids Market Report Revenue Billion Forecast, by Application 2020 & 2034
Table 34: West Us Patient Positioning Support Aids Market Report Revenue Billion Forecast, by End User 2020 & 2034
Table 35: West Us Patient Positioning Support Aids Market Report Revenue Billion Forecast, by Patient Population 2020 & 2034
Table 36: West Us Patient Positioning Support Aids Market Report Revenue Billion Forecast, by Distribution Channel 2020 & 2034
Table 37: West Us Patient Positioning Support Aids Market Report Revenue Billion Forecast, by Country 2020 & 2034
Table 38: California Us Patient Positioning Support Aids Market Report Revenue (Billion) Forecast, by Application 2020 & 2034
Table 39: Arizona Us Patient Positioning Support Aids Market Report Revenue (Billion) Forecast, by Application 2020 & 2034
Table 40: Washington Us Patient Positioning Support Aids Market Report Revenue (Billion) Forecast, by Application 2020 & 2034
Table 41: Colorado Us Patient Positioning Support Aids Market Report Revenue (Billion) Forecast, by Application 2020 & 2034
Table 42: Midwest Us Patient Positioning Support Aids Market Report Revenue Billion Forecast, by Product Type 2020 & 2034
Table 43: Midwest Us Patient Positioning Support Aids Market Report Revenue Billion Forecast, by Material 2020 & 2034
Table 44: Midwest Us Patient Positioning Support Aids Market Report Revenue Billion Forecast, by Application 2020 & 2034
Table 45: Midwest Us Patient Positioning Support Aids Market Report Revenue Billion Forecast, by End User 2020 & 2034
Table 46: Midwest Us Patient Positioning Support Aids Market Report Revenue Billion Forecast, by Patient Population 2020 & 2034
Table 47: Midwest Us Patient Positioning Support Aids Market Report Revenue Billion Forecast, by Distribution Channel 2020 & 2034
Table 48: Midwest Us Patient Positioning Support Aids Market Report Revenue Billion Forecast, by Country 2020 & 2034
Table 49: Illinois Us Patient Positioning Support Aids Market Report Revenue (Billion) Forecast, by Application 2020 & 2034
Table 50: Ohio Us Patient Positioning Support Aids Market Report Revenue (Billion) Forecast, by Application 2020 & 2034
Table 51: Michigan Us Patient Positioning Support Aids Market Report Revenue (Billion) Forecast, by Application 2020 & 2034
Table 52: Minnesota Us Patient Positioning Support Aids Market Report Revenue (Billion) Forecast, by Application 2020 & 2034
Table 53: Missouri Us Patient Positioning Support Aids Market Report Revenue (Billion) Forecast, by Application 2020 & 2034