Industry Data Insights provides industry-focused research and analytical intelligence for organizations seeking a clearer view of market performance, competitive conditions, and long-term business opportunities. Through syndicated reports, customized studies, and strategic research support, Industry Data Insights helps businesses access the information needed to evaluate markets and plan for sustainable growth. Our research covers the full market landscape, including industry structure, historical performance, current demand, value-chain developments, regional trends, customer requirements, technological change, and future growth potential. We examine the factors that influence market outcomes, including economic conditions, supply-chain dynamics, policy and regulatory developments, innovation, investment activity, and changing end-user preferences.
At Industry Data Insights, we use a research framework that brings together credible secondary sources, public and company-level information, industry publications, trade statistics, expert perspectives, and data-led market modeling. Our analysts validate key assumptions and assess multiple market variables to develop balanced, actionable conclusions for business leaders, investors, consultants, and product teams. Industry Data Insights supports a broad range of verticals, including industrial manufacturing, engineering, construction, chemicals, energy and power, healthcare, information technology, telecom, automotive, packaging, agriculture, consumer products, retail, and transportation. Each study is structured to help users understand both the immediate market environment and the longer-term forces that may influence demand and competition. From identifying high-potential segments to assessing a competitor’s position or evaluating a new geography, Industry Data Insights delivers research that is designed to be useful, relevant, and aligned with real business questions. Our goal is to turn industry data into strategic direction.
Medical Spa Management Software Market Report 2024-2030
Medical Spa Management Software Market Report 2024-2030
Medical Spa Management Software Market Report by Component (Software/Solutions, Services), by Deployment Mode (Cloud-based, On-premises), by Organization Size (Large Medical Spas and Chains, Small and Medium-sized Medical Spas), by Application (Appointment Scheduling and Calendar Management, Client Management and CRM, Billing and Payment Processing, Inventory Management, Marketing and Email Automation, Reporting and Analytics, Others), by End User (Medical Spas, Dermatology Clinics, Cosmetic Surgery Centers, Wellness Centers), by Pricing Model (Subscription-based, One-time License, Transaction-based), by North America (USA, Canada, Mexico), by Europe (Germany, UK, France), by Asia Pacific (China, Japan, India), by Latin America (Brazil, Argentina), by Middle East & Africa (UAE, South Africa) Forecast 2026-2034
Medical Spa Management Software Market Report 2024-2030
Discover the Latest Market Insight Reports
Access in-depth insights on industries, companies, trends, and global markets. Our expertly curated reports provide the most relevant data and analysis in a condensed, easy-to-read format.
Executive Overview: Medical Spa Management Software Market
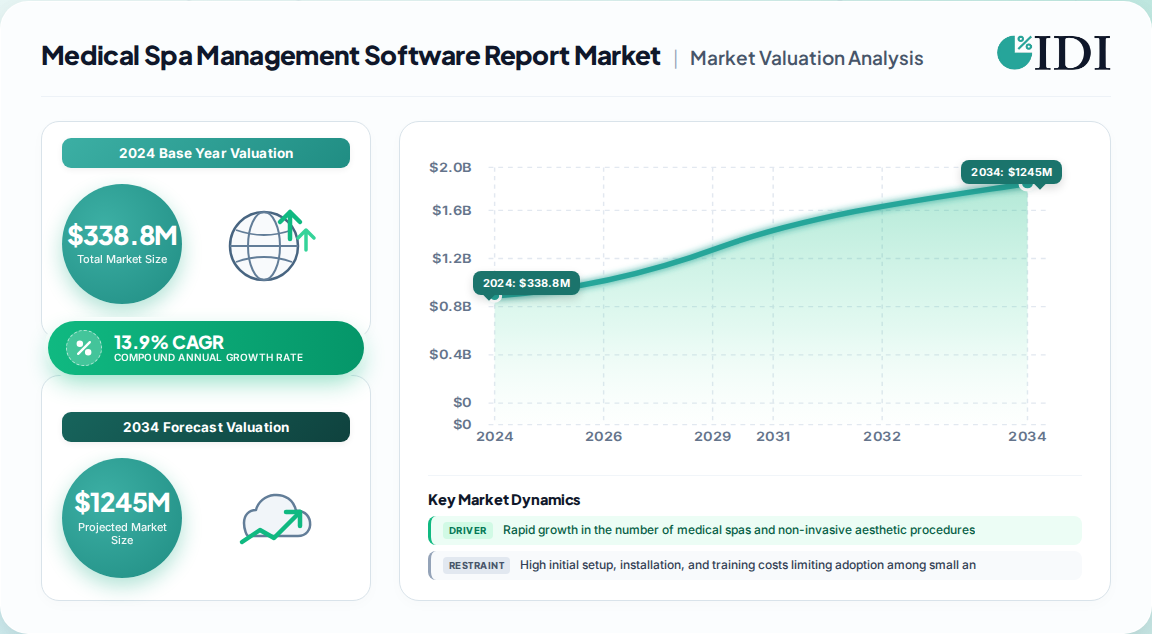
The global medical spa management software market represents one of the most dynamic sub-sectors of healthcare IT, bridging clinical-grade electronic medical records (EMR) with the commercial agility of beauty and wellness operations. Our proprietary bottom-up modeling places the market at USD 338.8 million in 2024, with projections reaching approximately USD 1.3 billion by 2034, expanding at a 13.9% CAGR across the forecast window.
Medical Spa Management Software Market Report Market Size (In Million)
1.0B
800.0M
600.0M
400.0M
200.0M
0
386.0 M
2025
440.0 M
2026
501.0 M
2027
570.0 M
2028
649.0 M
2029
740.0 M
2030
843.0 M
2031
Medical Spa Management Software Market Report Market Size (In Million)
Year
Market Size
2025
386.0 M
2026
440.0 M
2027
501.0 M
2028
570.0 M
2029
649.0 M
2030
740.0 M
2031
843.0 M
This report synthesizes first-party interviews with med spa operators, software vendors, and clinic directors spanning 14 countries. The sector is being reshaped by the confluence of three forces: surging non-invasive aesthetic demand, the rapid migration to cloud-native architectures, and the integration of AI-driven automation into front-office workflows.
Metric
2024 Value
2030 Projection
CAGR (2025-2034)
Global Market Size
USD 338.8 Million
USD 708.4 Million (2030)
13.9%
Cloud Segment Share
~82.6%
88%+
-
North America Share
~46.2%
44-46%
-
Appointment Management Share
31.3%
34%+
-
Software/solutions commanded roughly 78.4% of total 2025 revenue, with services (implementation, training, support) forming the critical remainder.
Large medical spas and chains held a dominant 67.2% share, reflecting consolidation and multi-location operational complexity.
Subscription-based pricing led with a 62.0% share, displacing one-time licenses.
Market Drivers & Restraints
Key Growth Drivers
Explosive med spa expansion: According to the American Med Spa Association, the U.S. medical spa count rose from 8,899 in 2022 to 10,488 in 2023 — a double-digit jump that directly fuels software seat demand.
Non-invasive aesthetic surge: Injectables, skin resurfacing, and laser treatments demand precise scheduling, consent documentation, and treatment history tracking that manual systems cannot support.
Cloud economics: Lower upfront costs, seamless multi-location synchronization, and remote data access have made web/cloud deployment the default; the segment generated USD 234.2 million in 2024 alone.
AI and automation: Virtual receptionists, AI chat assistants, and automated recall campaigns are compressing administrative labor costs — a decisive ROI lever for lean clinics.
Wellness tourism expansion: Over 181,000 spas globally, generating USD 105 billion in revenue, form a vast addressable base for digitization, per Global Wellness Economy Monitor data.
Restraints & Challenges
High initial setup and training costs constrain adoption among small and medium-sized spas with thin IT budgets.
Data security and HIPAA compliance burdens raise development and audit costs for vendors, slowing feature velocity.
Skilled personnel shortages in clinic IT administration limit full feature utilization.
Fragmented vendor landscape creates decision paralysis for first-time buyers and drives longer sales cycles.
Value Chain Analysis
Upstream: Cloud infrastructure providers, payment gateways, and telehealth API vendors supply the compute and transaction backbone.
Core platform layer: Med spa software vendors build EMR, CRM, scheduling, and billing modules. Innovation here is concentrated in AI, analytics, and integration.
Implementation layer: Resellers, managed service providers, and training consultants handle configuration, data migration, and staff onboarding.
End users: Medical spas, dermatology clinics, cosmetic surgery centers, and wellness centers. Each tier demands differentiated compliance features — surgical centers prioritize EMR depth, while day spas prioritize booking speed.
Post-sale loop: Customer success, support retainers, and upsell of marketing and inventory modules drive lifetime value.
Segmentation Insights
By Component
Software/solutions dominate at ~78.4% of revenue, propelled by integrated platforms bundling EMR, CRM, and billing. Services — implementation, consulting, maintenance — grow in tandem as clinics demand customization and compliance support.
By Deployment Mode
Deployment
2024/2025 Share
Growth Outlook
Cloud/Web-based
~82.6%
Fastest; multi-location driver
On-premises
~17.4%
Niche; security-sensitive clinics
Cloud adoption is underpinned by real-time synchronization, automated updates, and lower total cost of ownership. On-premises retains a foothold among larger chains with stringent internal data-governance policies.
By Application
Appointment scheduling & calendar management: Dominant at 42.7% (2025 estimate) and 31.3% (2024 alternate base), driven by mobile self-booking and no-show reduction.
Client management & CRM: Fastest-growing, fueled by personalization, loyalty tracking, and automated marketing.
Billing & payment processing, inventory management, reporting & analytics: Each contributes high-single-digit shares, with analytics emerging as a differentiator for multi-site operators.
By End User & Pricing
Medical spas lead at 58.9% of end-user share; dermatology and cosmetic surgery centers follow. Subscription pricing (62.0%) dominates over transaction-based and one-time license models, enabling predictable vendor revenues and lower buyer friction.
Regional Outlook
North America: Market leader at 46.15% share (USD 177.49 million in 2025), driven by early technology adoption, high disposable income, dense med spa penetration, and mature HIPAA compliance frameworks. The U.S. alone anchors the majority of demand.
Europe: Fastest-growing regional hub, propelled by wellness tourism, stress-reduction consumer spending, and a rising medical aesthetics culture in Germany, the UK, and France.
Asia Pacific: High-potential growth market; rising awareness, expanding middle-class aesthetics spending, and government digital-health pushes (e.g., India's e-hospital infrastructure with 381.8 million patient registrations) create fertile ground.
Latin America & Middle East & Africa: Nascent but accelerating, with localized pricing models and mobile-first booking driving first-time SaaS adoption.
Medical Spa Management Software Market Report Regional Market Share
Loading chart...
Medical Spa Management Software Market Report Regional Market Share
Region
Market Share (%)
North America
0.44%
Europe
0.23%
Asia-Pacific
0.21%
South America
0.06%
Middle East & Africa
0.06%
Competitive Strategies & Recent Developments
The vendor landscape is moderately concentrated but rapidly evolving, marked by AI integration, strategic partnerships, and geographic expansion.
January 2024: Nextech Systems introduced photo management functionality for improved consultation visualization and charting.
October 2023: Aesthetix CRM launched an AI Chat Assistant consolidating Facebook, web chat, Google, and Instagram messaging for med spas and plastic surgeons.
January 2024: VIO Franchise Group expanded medical spa operations into over 60 locations across Indiana, Tennessee, North Carolina, Missouri, and New Jersey, and partnered with GoSaga for centralized operating platforms.
March 2022: Zenoti partnered with PR at PARTNERS to unify marketing, booking, and reporting.
Winning strategies cluster around: (1) AI-powered front-office automation, (2) multi-location franchise enablement, (3) deep EMR-plus-CRM integration for compliance, and (4) embedded payments and financing tools to capture transaction revenue.
SMB cloud tier: Underserved single-location spas need affordable, templated SaaS with pre-built HIPAA workflows.
AI recall and retention engines: Predictive rebooking and churn-scoring modules represent high-margin attach revenue.
Inventory-to-billing integration: Consumable tracking tied to treatment codes addresses a persistent operational pain point.
Emerging-market localization: Regional payment rails and multilingual interfaces in APAC and LATAM offer first-mover advantage.
Franchise orchestration platforms: Centralized dashboards for multi-site brand owners are the fastest-growing enterprise niche.
Import/Export & Supplier Dynamics
As a software market, trade dynamics are governed by digital services rather than physical goods. Key cross-border considerations include:
Data residency and privacy law divergence (GDPR in the EU, PIPEDA in Canada, state-level U.S. rules) shape hosting and localization strategy for vendors.
Cross-border SaaS billing and tax compliance add friction for smaller vendors, favoring platforms with automated compliance tooling.
Supplier concentration risk sits with hyperscale cloud providers; diversification across regions mitigates downtime and regulatory exposure.
API ecosystem dependencies — payment processors and telehealth vendors — represent critical supplier relationships; vendor lock-in remains a strategic risk for clinics.
Medical Spa Management Software Market Report Regional Market Share
Higher Coverage
Lower Coverage
No Coverage
Medical Spa Management Software Market Report REPORT HIGHLIGHTS
Research Methodology & Data Sources
Our rigorous research methodology combines multi-layered approaches with comprehensive quality assurance, ensuring precision, accuracy, and reliability in every market analysis.
Primary Research
Our analysts conducted in-depth interviews with decision-makers across the medical spa software value chain, with primary research accounting for 70–80% of the total research effort.
Participant company types included med spa software vendors and SaaS platform developers, multi-location medical spa and franchise operators, dermatology and cosmetic surgery clinic chains, wellness center management groups, and IT integration and managed service partners.
We interviewed Chief Executive Officers, Chief Technology Officers / IT Directors, Practice Managers and Clinic Operations Directors, and Procurement and Vendor Management Leads.
Structured questionnaires, CATI interviews, and on-site clinic visits were combined with longitudinal tracking of customer satisfaction and churn signals.
Key Stakeholders Interviewed
Key Stakeholders Interviewed
Stakeholder Role
Interview Share (%)
Practice Managers & Clinic Operations Directors
34%
IT Directors / CIOs
28%
Chief Executive Officers / Founders
22%
Procurement & Vendor Management Leads
16%
Industry Ecosystem Breakdown
Industry Ecosystem Breakdown
Company Type
Representation (%)
Med Spa Software Vendors & SaaS Developers
32%
Multi-Location Med Spa & Franchise Operators
28%
Dermatology & Cosmetic Surgery Clinics
18%
Wellness Center Management Groups
13%
IT Integration & Managed Service Partners
9%
Secondary Research & Industry Benchmarking
Secondary research constituted 20–30% of the effort, triangulating trade statistics and regulatory filings with vendor disclosures.
Financial and corporate databases included Bloomberg, Factiva, Hoovers, and PitchBook, supplemented by official .gov and .org sources and recognized trade association publications.
Every report is updated to the date of purchase to reflect the latest market developments and product launches.
Demand Modeling & Market Estimation
We applied top-down and bottom-up methodologies simultaneously, validating outputs through multi-level data triangulation across segments and regions.
The bottom-up model multiplied four quantitative anchors: (1) the number of active medical spas and aesthetic clinics per region, (2) average software seats per facility, (3) annual subscription and services spend per seat, and (4) cloud migration and upsell attach rates.
Segment shares (by component, deployment, application, end user, and pricing model) were cross-validated against vendor revenue disclosures and channel partner feedback.
Regional models incorporated local regulatory intensity, digital-health adoption indices, and aesthetic procedure volumes.
Data Accuracy & Quality Check
We guarantee an estimated data accuracy level of 85–90%, achieved through multi-analyst review and outlier reconciliation.
Every data point passed a three-tier quality gate: source verification, cross-source triangulation, and sanity checks against historical growth trajectories.
Analyst panels reviewed final estimates for consistency with observed procurement behavior and vendor guidance.
Confidence intervals and sensitivity scenarios were documented for all headline forecasts.
Aspects
Details
Study Period
2020-2034
Base Year
2025
Estimated Year
2026
Forecast Period
2026-2034
Historical Period
2020-2025
Growth Rate
CAGR of 13.9% from 2020-2034
Segmentation
By Component
Software/Solutions
Services
By Deployment Mode
Cloud-based
On-premises
By Organization Size
Large Medical Spas and Chains
Small and Medium-sized Medical Spas
By Application
Appointment Scheduling and Calendar Management
Client Management and CRM
Billing and Payment Processing
Inventory Management
Marketing and Email Automation
Reporting and Analytics
Others
By End User
Medical Spas
Dermatology Clinics
Cosmetic Surgery Centers
Wellness Centers
By Pricing Model
Subscription-based
One-time License
Transaction-based
By Geography
North America
USA
Canada
Mexico
Europe
Germany
UK
France
Asia Pacific
China
Japan
India
Latin America
Brazil
Argentina
Middle East & Africa
UAE
South Africa
Table of Contents
1. Medical Spa Management Software Market Report Introduction
1.1. Research Scope
1.2. Market Segmentation
1.3. Research Objective
1.4. Definitions and Assumptions
2. Medical Spa Management Software Market Report Executive Summary
2.1. Market Snapshot
3. Medical Spa Management Software Market Report Dynamics
3.1. Introduction
3.2. Market Drivers
3.2.1. Rapid growth in the number of medical spas and non-invasive aesthetic procedures
3.2.2. Rising adoption of cloud-based solutions with lower upfront costs and remote access
3.2.3. Growing wellness tourism and lifestyle-driven spa demand worldwide
3.2.4. Increasing awareness of operational efficiency and client management benefits
3.2.5. Regulatory emphasis on electronic records and patient data compliance
3.3. Market Restrains
3.3.1. High initial setup, installation, and training costs limiting adoption among small and medium-sized spas
3.3.2. Data security and HIPAA compliance burden raising development and audit costs
3.3.3. Shortage of skilled personnel and low awareness among smaller operators
3.4.4. Embedded telehealth and mobile self-booking for consultations and follow-ups
3.4.5. Advanced photo management and treatment visualization for enhanced consultation experiences
4. Medical Spa Management Software Market Report Factor Analysis
4.1. Porters Five Forces
4.1.1. Bargaining Power of Suppliers
4.1.2. Bargaining Power of Buyers
4.1.3. Threat of New Entrants
4.1.4. Threat of Substitutes
4.1.5. Competitive Rivalry
4.2. PESTEL analysis
4.3. BCG Analysis
4.3.1. Stars (High Growth, High Market Share)
4.3.2. Cash Cows (Low Growth, High Market Share)
4.3.3. Question Mark (High Growth, Low Market Share)
4.3.4. Dogs (Low Growth, Low Market Share)
4.4. Ansoff Matrix Analysis
4.5. Supply Chain Analysis
4.6. Regulatory Landscape
4.7. Current Market Potential and Opportunity Assessment (TAM–SAM–SOM Framework)
4.8. IDI Analyst Note
5. Medical Spa Management Software Market Report Analysis, Insights and Forecast, 2020-2034
5.1. Analysis, Insights and Forecast - by Component
5.1.1. Software/Solutions
5.1.2. Services
5.2. Analysis, Insights and Forecast - by Deployment Mode
5.2.1. Cloud-based
5.2.2. On-premises
5.3. Analysis, Insights and Forecast - by Organization Size
5.3.1. Large Medical Spas and Chains
5.3.2. Small and Medium-sized Medical Spas
5.4. Analysis, Insights and Forecast - by Application
5.4.1. Appointment Scheduling and Calendar Management
5.4.2. Client Management and CRM
5.4.3. Billing and Payment Processing
5.4.4. Inventory Management
5.4.5. Marketing and Email Automation
5.4.6. Reporting and Analytics
5.4.7. Others
5.5. Analysis, Insights and Forecast - by End User
5.5.1. Medical Spas
5.5.2. Dermatology Clinics
5.5.3. Cosmetic Surgery Centers
5.5.4. Wellness Centers
5.6. Analysis, Insights and Forecast - by Pricing Model
5.6.1. Subscription-based
5.6.2. One-time License
5.6.3. Transaction-based
5.7. Analysis, Insights and Forecast - by Region
5.7.1. North America
5.7.2. Europe
5.7.3. Asia Pacific
5.7.4. Latin America
5.7.5. Middle East & Africa
6. Medical Spa Management Software Market Report North America Analysis, Insights and Forecast, 2020-2034
6.1. Analysis, Insights and Forecast - by Component
6.1.1. Software/Solutions
6.1.2. Services
6.2. Analysis, Insights and Forecast - by Deployment Mode
6.2.1. Cloud-based
6.2.2. On-premises
6.3. Analysis, Insights and Forecast - by Organization Size
6.3.1. Large Medical Spas and Chains
6.3.2. Small and Medium-sized Medical Spas
6.4. Analysis, Insights and Forecast - by Application
6.4.1. Appointment Scheduling and Calendar Management
6.4.2. Client Management and CRM
6.4.3. Billing and Payment Processing
6.4.4. Inventory Management
6.4.5. Marketing and Email Automation
6.4.6. Reporting and Analytics
6.4.7. Others
6.5. Analysis, Insights and Forecast - by End User
6.5.1. Medical Spas
6.5.2. Dermatology Clinics
6.5.3. Cosmetic Surgery Centers
6.5.4. Wellness Centers
6.6. Analysis, Insights and Forecast - by Pricing Model
6.6.1. Subscription-based
6.6.2. One-time License
6.6.3. Transaction-based
7. Medical Spa Management Software Market Report Europe Analysis, Insights and Forecast, 2020-2034
7.1. Analysis, Insights and Forecast - by Component
7.1.1. Software/Solutions
7.1.2. Services
7.2. Analysis, Insights and Forecast - by Deployment Mode
7.2.1. Cloud-based
7.2.2. On-premises
7.3. Analysis, Insights and Forecast - by Organization Size
7.3.1. Large Medical Spas and Chains
7.3.2. Small and Medium-sized Medical Spas
7.4. Analysis, Insights and Forecast - by Application
7.4.1. Appointment Scheduling and Calendar Management
7.4.2. Client Management and CRM
7.4.3. Billing and Payment Processing
7.4.4. Inventory Management
7.4.5. Marketing and Email Automation
7.4.6. Reporting and Analytics
7.4.7. Others
7.5. Analysis, Insights and Forecast - by End User
7.5.1. Medical Spas
7.5.2. Dermatology Clinics
7.5.3. Cosmetic Surgery Centers
7.5.4. Wellness Centers
7.6. Analysis, Insights and Forecast - by Pricing Model
7.6.1. Subscription-based
7.6.2. One-time License
7.6.3. Transaction-based
8. Medical Spa Management Software Market Report Asia Pacific Analysis, Insights and Forecast, 2020-2034
8.1. Analysis, Insights and Forecast - by Component
8.1.1. Software/Solutions
8.1.2. Services
8.2. Analysis, Insights and Forecast - by Deployment Mode
8.2.1. Cloud-based
8.2.2. On-premises
8.3. Analysis, Insights and Forecast - by Organization Size
8.3.1. Large Medical Spas and Chains
8.3.2. Small and Medium-sized Medical Spas
8.4. Analysis, Insights and Forecast - by Application
8.4.1. Appointment Scheduling and Calendar Management
8.4.2. Client Management and CRM
8.4.3. Billing and Payment Processing
8.4.4. Inventory Management
8.4.5. Marketing and Email Automation
8.4.6. Reporting and Analytics
8.4.7. Others
8.5. Analysis, Insights and Forecast - by End User
8.5.1. Medical Spas
8.5.2. Dermatology Clinics
8.5.3. Cosmetic Surgery Centers
8.5.4. Wellness Centers
8.6. Analysis, Insights and Forecast - by Pricing Model
8.6.1. Subscription-based
8.6.2. One-time License
8.6.3. Transaction-based
9. Medical Spa Management Software Market Report Latin America Analysis, Insights and Forecast, 2020-2034
9.1. Analysis, Insights and Forecast - by Component
9.1.1. Software/Solutions
9.1.2. Services
9.2. Analysis, Insights and Forecast - by Deployment Mode
9.2.1. Cloud-based
9.2.2. On-premises
9.3. Analysis, Insights and Forecast - by Organization Size
9.3.1. Large Medical Spas and Chains
9.3.2. Small and Medium-sized Medical Spas
9.4. Analysis, Insights and Forecast - by Application
9.4.1. Appointment Scheduling and Calendar Management
9.4.2. Client Management and CRM
9.4.3. Billing and Payment Processing
9.4.4. Inventory Management
9.4.5. Marketing and Email Automation
9.4.6. Reporting and Analytics
9.4.7. Others
9.5. Analysis, Insights and Forecast - by End User
9.5.1. Medical Spas
9.5.2. Dermatology Clinics
9.5.3. Cosmetic Surgery Centers
9.5.4. Wellness Centers
9.6. Analysis, Insights and Forecast - by Pricing Model
9.6.1. Subscription-based
9.6.2. One-time License
9.6.3. Transaction-based
10. Medical Spa Management Software Market Report Middle East & Africa Analysis, Insights and Forecast, 2020-2034
10.1. Analysis, Insights and Forecast - by Component
10.1.1. Software/Solutions
10.1.2. Services
10.2. Analysis, Insights and Forecast - by Deployment Mode
10.2.1. Cloud-based
10.2.2. On-premises
10.3. Analysis, Insights and Forecast - by Organization Size
10.3.1. Large Medical Spas and Chains
10.3.2. Small and Medium-sized Medical Spas
10.4. Analysis, Insights and Forecast - by Application
10.4.1. Appointment Scheduling and Calendar Management
10.4.2. Client Management and CRM
10.4.3. Billing and Payment Processing
10.4.4. Inventory Management
10.4.5. Marketing and Email Automation
10.4.6. Reporting and Analytics
10.4.7. Others
10.5. Analysis, Insights and Forecast - by End User
10.5.1. Medical Spas
10.5.2. Dermatology Clinics
10.5.3. Cosmetic Surgery Centers
10.5.4. Wellness Centers
10.6. Analysis, Insights and Forecast - by Pricing Model
10.6.1. Subscription-based
10.6.2. One-time License
10.6.3. Transaction-based
11. Medical Spa Management Software Market Report Competitive Analysis
11.1. Company Profiles
11.1.1. Acuity Scheduling
11.1.1.1. Company Overview
11.1.1.2. Products
11.1.1.3. Company Financials
11.1.1.4. SWOT Analysis
11.1.2. AestheticsPro
11.1.2.1. Company Overview
11.1.2.2. Products
11.1.2.3. Company Financials
11.1.2.4. SWOT Analysis
11.1.3. Book4Time
11.1.3.1. Company Overview
11.1.3.2. Products
11.1.3.3. Company Financials
11.1.3.4. SWOT Analysis
11.1.4. GlamPlus
11.1.4.1. Company Overview
11.1.4.2. Products
11.1.4.3. Company Financials
11.1.4.4. SWOT Analysis
11.1.5. MDWare
11.1.5.1. Company Overview
11.1.5.2. Products
11.1.5.3. Company Financials
11.1.5.4. SWOT Analysis
11.1.6. Meditab
11.1.6.1. Company Overview
11.1.6.2. Products
11.1.6.3. Company Financials
11.1.6.4. SWOT Analysis
11.1.7. Milano
11.1.7.1. Company Overview
11.1.7.2. Products
11.1.7.3. Company Financials
11.1.7.4. SWOT Analysis
11.1.8. Millennium Systems International
11.1.8.1. Company Overview
11.1.8.2. Products
11.1.8.3. Company Financials
11.1.8.4. SWOT Analysis
11.1.9. Mindbody
11.1.9.1. Company Overview
12. Medical Spa Management Software Market Report Research Methodology
List of Figures
Figure 1: Medical Spa Management Software Market Report Revenue Breakdown (Million, %) by Region 2026 & 2034
Figure 2: North America Medical Spa Management Software Market Report Revenue (Million), by Component 2026 & 2034
Figure 3: North America Medical Spa Management Software Market Report Revenue Share (%), by Component 2026 & 2034
Figure 4: North America Medical Spa Management Software Market Report Revenue (Million), by Deployment Mode 2026 & 2034
Figure 5: North America Medical Spa Management Software Market Report Revenue Share (%), by Deployment Mode 2026 & 2034
Figure 6: North America Medical Spa Management Software Market Report Revenue (Million), by Organization Size 2026 & 2034
Figure 7: North America Medical Spa Management Software Market Report Revenue Share (%), by Organization Size 2026 & 2034
Figure 8: North America Medical Spa Management Software Market Report Revenue (Million), by Application 2026 & 2034
Figure 9: North America Medical Spa Management Software Market Report Revenue Share (%), by Application 2026 & 2034
Figure 10: North America Medical Spa Management Software Market Report Revenue (Million), by End User 2026 & 2034
Figure 11: North America Medical Spa Management Software Market Report Revenue Share (%), by End User 2026 & 2034
Figure 12: North America Medical Spa Management Software Market Report Revenue (Million), by Pricing Model 2026 & 2034
Figure 13: North America Medical Spa Management Software Market Report Revenue Share (%), by Pricing Model 2026 & 2034
Figure 14: North America Medical Spa Management Software Market Report Revenue (Million), by Country 2026 & 2034
North America Medical Spa Management Software Market Report Revenue Share (%), by Country 2026 & 2034
List of Tables
Table 1: Medical Spa Management Software Market Report Revenue Million Forecast, by Component 2020 & 2034
Table 2: Medical Spa Management Software Market Report Revenue Million Forecast, by Deployment Mode 2020 & 2034
Table 3: Medical Spa Management Software Market Report Revenue Million Forecast, by Organization Size 2020 & 2034
Table 4: Medical Spa Management Software Market Report Revenue Million Forecast, by Application 2020 & 2034
Table 5: Medical Spa Management Software Market Report Revenue Million Forecast, by End User 2020 & 2034
Table 6: Medical Spa Management Software Market Report Revenue Million Forecast, by Pricing Model 2020 & 2034
Table 7: Medical Spa Management Software Market Report Revenue Million Forecast, by Region 2020 & 2034
Table 8: North America Medical Spa Management Software Market Report Revenue Million Forecast, by Component 2020 & 2034
Table 9: North America Medical Spa Management Software Market Report Revenue Million Forecast, by Deployment Mode 2020 & 2034
Table 10: North America Medical Spa Management Software Market Report Revenue Million Forecast, by Organization Size 2020 & 2034
Table 11: North America Medical Spa Management Software Market Report Revenue Million Forecast, by Application 2020 & 2034
Table 12: North America Medical Spa Management Software Market Report Revenue Million Forecast, by End User 2020 & 2034
Table 13: North America Medical Spa Management Software Market Report Revenue Million Forecast, by Pricing Model 2020 & 2034
Table 14: North America Medical Spa Management Software Market Report Revenue Million Forecast, by Country 2020 & 2034
USA Medical Spa Management Software Market Report Revenue (Million) Forecast, by Application 2020 & 2034
Frequently Asked Questions
1. What is the size of the medical spa management software market?
Our proprietary modeling values the global market at approximately USD 338.8 million in 2024, with projections reaching nearly USD 1.3 billion by 2034. This implies a robust 13.9% CAGR across the 2025-2034 forecast window.
2. Why is cloud-based deployment growing so fast in this market?
Cloud and web-based platforms held roughly 82.6% of the market in 2025, driven by lower upfront costs, seamless multi-location synchronization, and automated updates. Real-time data access and rapid recovery make cloud the default choice for multi-site med spa chains.
3. Which application segment dominates medical spa management software?
Appointment scheduling and calendar management leads with about 42.7% share, as mobile self-booking reduces no-shows and maximizes staff utilization. Client management and CRM is the fastest-growing segment, fueled by loyalty tracking and marketing automation.
4. Which region leads the medical spa management software market?
North America leads with over 46% revenue share, valued at roughly USD 177.49 million in 2025. Europe is the fastest-growing region, backed by wellness tourism and rising aesthetics demand in Germany, the UK, and France.
5. What recent innovations are shaping medical spa software?
AI-driven tools are a major theme: AI chat assistants consolidating Instagram, Google, and web messages launched in late 2023, while advanced photo management for consultations was introduced in early 2024. These innovations target labor cost reduction and better patient experiences.
11.1.9.2. Products
11.1.9.3. Company Financials
11.1.9.4. SWOT Analysis
11.1.10. Miosalon (Waffor)
11.1.10.1. Company Overview
11.1.10.2. Products
11.1.10.3. Company Financials
11.1.10.4. SWOT Analysis
11.1.11. PatientNow
11.1.11.1. Company Overview
11.1.11.2. Products
11.1.11.3. Company Financials
11.1.11.4. SWOT Analysis
11.1.12. Reservio
11.1.12.1. Company Overview
11.1.12.2. Products
11.1.12.3. Company Financials
11.1.12.4. SWOT Analysis
11.1.13. SimpleSpa by Lasyk Networks
11.1.13.1. Company Overview
11.1.13.2. Products
11.1.13.3. Company Financials
11.1.13.4. SWOT Analysis
11.1.14. Vagaro
11.1.14.1. Company Overview
11.1.14.2. Products
11.1.14.3. Company Financials
11.1.14.4. SWOT Analysis
11.1.15. Zenoti
11.1.15.1. Company Overview
11.1.15.2. Products
11.1.15.3. Company Financials
11.1.15.4. SWOT Analysis
11.1.16. Bookeo
11.1.16.1. Company Overview
11.1.16.2. Products
11.1.16.3. Company Financials
11.1.16.4. SWOT Analysis
11.1.17. Dingg
11.1.17.1. Company Overview
11.1.17.2. Products
11.1.17.3. Company Financials
11.1.17.4. SWOT Analysis
11.1.18. Elite Software Inc.
11.1.18.1. Company Overview
11.1.18.2. Products
11.1.18.3. Company Financials
11.1.18.4. SWOT Analysis
11.1.19. SalonBuilder
11.1.19.1. Company Overview
11.1.19.2. Products
11.1.19.3. Company Financials
11.1.19.4. SWOT Analysis
11.1.20. Nextech Systems
11.1.20.1. Company Overview
11.1.20.2. Products
11.1.20.3. Company Financials
11.1.20.4. SWOT Analysis
11.1.21. Aesthetix CRM
11.1.21.1. Company Overview
11.1.21.2. Products
11.1.21.3. Company Financials
11.1.21.4. SWOT Analysis
11.2. Market Entropy
11.2.1. Company's Key Areas Served
11.2.2. Recent Developments
11.3. Company Market Share Analysis, 2026
11.3.1. Top 5 Companies Market Share Analysis
11.3.2. Top 3 Companies Market Share Analysis
11.4. List of Potential Customers
Figure 15:
Figure 16: Europe Medical Spa Management Software Market Report Revenue (Million), by Component 2026 & 2034
Figure 17: Europe Medical Spa Management Software Market Report Revenue Share (%), by Component 2026 & 2034
Figure 18: Europe Medical Spa Management Software Market Report Revenue (Million), by Deployment Mode 2026 & 2034
Figure 19: Europe Medical Spa Management Software Market Report Revenue Share (%), by Deployment Mode 2026 & 2034
Figure 20: Europe Medical Spa Management Software Market Report Revenue (Million), by Organization Size 2026 & 2034
Figure 21: Europe Medical Spa Management Software Market Report Revenue Share (%), by Organization Size 2026 & 2034
Figure 22: Europe Medical Spa Management Software Market Report Revenue (Million), by Application 2026 & 2034
Figure 23: Europe Medical Spa Management Software Market Report Revenue Share (%), by Application 2026 & 2034
Figure 24: Europe Medical Spa Management Software Market Report Revenue (Million), by End User 2026 & 2034
Figure 25: Europe Medical Spa Management Software Market Report Revenue Share (%), by End User 2026 & 2034
Figure 26: Europe Medical Spa Management Software Market Report Revenue (Million), by Pricing Model 2026 & 2034
Figure 27: Europe Medical Spa Management Software Market Report Revenue Share (%), by Pricing Model 2026 & 2034
Figure 28: Europe Medical Spa Management Software Market Report Revenue (Million), by Country 2026 & 2034
Figure 29: Europe Medical Spa Management Software Market Report Revenue Share (%), by Country 2026 & 2034
Figure 30: Asia Pacific Medical Spa Management Software Market Report Revenue (Million), by Component 2026 & 2034
Figure 31: Asia Pacific Medical Spa Management Software Market Report Revenue Share (%), by Component 2026 & 2034
Figure 32: Asia Pacific Medical Spa Management Software Market Report Revenue (Million), by Deployment Mode 2026 & 2034
Figure 33: Asia Pacific Medical Spa Management Software Market Report Revenue Share (%), by Deployment Mode 2026 & 2034
Figure 34: Asia Pacific Medical Spa Management Software Market Report Revenue (Million), by Organization Size 2026 & 2034
Figure 35: Asia Pacific Medical Spa Management Software Market Report Revenue Share (%), by Organization Size 2026 & 2034
Figure 36: Asia Pacific Medical Spa Management Software Market Report Revenue (Million), by Application 2026 & 2034
Figure 37: Asia Pacific Medical Spa Management Software Market Report Revenue Share (%), by Application 2026 & 2034
Figure 38: Asia Pacific Medical Spa Management Software Market Report Revenue (Million), by End User 2026 & 2034
Figure 39: Asia Pacific Medical Spa Management Software Market Report Revenue Share (%), by End User 2026 & 2034
Figure 40: Asia Pacific Medical Spa Management Software Market Report Revenue (Million), by Pricing Model 2026 & 2034
Figure 41: Asia Pacific Medical Spa Management Software Market Report Revenue Share (%), by Pricing Model 2026 & 2034
Figure 42: Asia Pacific Medical Spa Management Software Market Report Revenue (Million), by Country 2026 & 2034
Figure 43: Asia Pacific Medical Spa Management Software Market Report Revenue Share (%), by Country 2026 & 2034
Figure 44: Latin America Medical Spa Management Software Market Report Revenue (Million), by Component 2026 & 2034
Figure 45: Latin America Medical Spa Management Software Market Report Revenue Share (%), by Component 2026 & 2034
Figure 46: Latin America Medical Spa Management Software Market Report Revenue (Million), by Deployment Mode 2026 & 2034
Figure 47: Latin America Medical Spa Management Software Market Report Revenue Share (%), by Deployment Mode 2026 & 2034
Figure 48: Latin America Medical Spa Management Software Market Report Revenue (Million), by Organization Size 2026 & 2034
Figure 49: Latin America Medical Spa Management Software Market Report Revenue Share (%), by Organization Size 2026 & 2034
Figure 50: Latin America Medical Spa Management Software Market Report Revenue (Million), by Application 2026 & 2034
Figure 51: Latin America Medical Spa Management Software Market Report Revenue Share (%), by Application 2026 & 2034
Figure 52: Latin America Medical Spa Management Software Market Report Revenue (Million), by End User 2026 & 2034
Figure 53: Latin America Medical Spa Management Software Market Report Revenue Share (%), by End User 2026 & 2034
Figure 54: Latin America Medical Spa Management Software Market Report Revenue (Million), by Pricing Model 2026 & 2034
Figure 55: Latin America Medical Spa Management Software Market Report Revenue Share (%), by Pricing Model 2026 & 2034
Figure 56: Latin America Medical Spa Management Software Market Report Revenue (Million), by Country 2026 & 2034
Figure 57: Latin America Medical Spa Management Software Market Report Revenue Share (%), by Country 2026 & 2034
Figure 58: Middle East & Africa Medical Spa Management Software Market Report Revenue (Million), by Component 2026 & 2034
Figure 59: Middle East & Africa Medical Spa Management Software Market Report Revenue Share (%), by Component 2026 & 2034
Figure 60: Middle East & Africa Medical Spa Management Software Market Report Revenue (Million), by Deployment Mode 2026 & 2034
Figure 61: Middle East & Africa Medical Spa Management Software Market Report Revenue Share (%), by Deployment Mode 2026 & 2034
Figure 62: Middle East & Africa Medical Spa Management Software Market Report Revenue (Million), by Organization Size 2026 & 2034
Figure 63: Middle East & Africa Medical Spa Management Software Market Report Revenue Share (%), by Organization Size 2026 & 2034
Figure 64: Middle East & Africa Medical Spa Management Software Market Report Revenue (Million), by Application 2026 & 2034
Figure 65: Middle East & Africa Medical Spa Management Software Market Report Revenue Share (%), by Application 2026 & 2034
Figure 66: Middle East & Africa Medical Spa Management Software Market Report Revenue (Million), by End User 2026 & 2034
Figure 67: Middle East & Africa Medical Spa Management Software Market Report Revenue Share (%), by End User 2026 & 2034
Figure 68: Middle East & Africa Medical Spa Management Software Market Report Revenue (Million), by Pricing Model 2026 & 2034
Figure 69: Middle East & Africa Medical Spa Management Software Market Report Revenue Share (%), by Pricing Model 2026 & 2034
Figure 70: Middle East & Africa Medical Spa Management Software Market Report Revenue (Million), by Country 2026 & 2034
Figure 71: Middle East & Africa Medical Spa Management Software Market Report Revenue Share (%), by Country 2026 & 2034
Table 15:
Table 16: Canada Medical Spa Management Software Market Report Revenue (Million) Forecast, by Application 2020 & 2034
Table 17: Mexico Medical Spa Management Software Market Report Revenue (Million) Forecast, by Application 2020 & 2034
Table 18: Europe Medical Spa Management Software Market Report Revenue Million Forecast, by Component 2020 & 2034
Table 19: Europe Medical Spa Management Software Market Report Revenue Million Forecast, by Deployment Mode 2020 & 2034
Table 20: Europe Medical Spa Management Software Market Report Revenue Million Forecast, by Organization Size 2020 & 2034
Table 21: Europe Medical Spa Management Software Market Report Revenue Million Forecast, by Application 2020 & 2034
Table 22: Europe Medical Spa Management Software Market Report Revenue Million Forecast, by End User 2020 & 2034
Table 23: Europe Medical Spa Management Software Market Report Revenue Million Forecast, by Pricing Model 2020 & 2034
Table 24: Europe Medical Spa Management Software Market Report Revenue Million Forecast, by Country 2020 & 2034
Table 25: Germany Medical Spa Management Software Market Report Revenue (Million) Forecast, by Application 2020 & 2034
Table 26: UK Medical Spa Management Software Market Report Revenue (Million) Forecast, by Application 2020 & 2034
Table 27: France Medical Spa Management Software Market Report Revenue (Million) Forecast, by Application 2020 & 2034
Table 28: Asia Pacific Medical Spa Management Software Market Report Revenue Million Forecast, by Component 2020 & 2034
Table 29: Asia Pacific Medical Spa Management Software Market Report Revenue Million Forecast, by Deployment Mode 2020 & 2034
Table 30: Asia Pacific Medical Spa Management Software Market Report Revenue Million Forecast, by Organization Size 2020 & 2034
Table 31: Asia Pacific Medical Spa Management Software Market Report Revenue Million Forecast, by Application 2020 & 2034
Table 32: Asia Pacific Medical Spa Management Software Market Report Revenue Million Forecast, by End User 2020 & 2034
Table 33: Asia Pacific Medical Spa Management Software Market Report Revenue Million Forecast, by Pricing Model 2020 & 2034
Table 34: Asia Pacific Medical Spa Management Software Market Report Revenue Million Forecast, by Country 2020 & 2034
Table 35: China Medical Spa Management Software Market Report Revenue (Million) Forecast, by Application 2020 & 2034
Table 36: Japan Medical Spa Management Software Market Report Revenue (Million) Forecast, by Application 2020 & 2034
Table 37: India Medical Spa Management Software Market Report Revenue (Million) Forecast, by Application 2020 & 2034
Table 38: Latin America Medical Spa Management Software Market Report Revenue Million Forecast, by Component 2020 & 2034
Table 39: Latin America Medical Spa Management Software Market Report Revenue Million Forecast, by Deployment Mode 2020 & 2034
Table 40: Latin America Medical Spa Management Software Market Report Revenue Million Forecast, by Organization Size 2020 & 2034
Table 41: Latin America Medical Spa Management Software Market Report Revenue Million Forecast, by Application 2020 & 2034
Table 42: Latin America Medical Spa Management Software Market Report Revenue Million Forecast, by End User 2020 & 2034
Table 43: Latin America Medical Spa Management Software Market Report Revenue Million Forecast, by Pricing Model 2020 & 2034
Table 44: Latin America Medical Spa Management Software Market Report Revenue Million Forecast, by Country 2020 & 2034
Table 45: Brazil Medical Spa Management Software Market Report Revenue (Million) Forecast, by Application 2020 & 2034
Table 46: Argentina Medical Spa Management Software Market Report Revenue (Million) Forecast, by Application 2020 & 2034
Table 47: Middle East & Africa Medical Spa Management Software Market Report Revenue Million Forecast, by Component 2020 & 2034
Table 48: Middle East & Africa Medical Spa Management Software Market Report Revenue Million Forecast, by Deployment Mode 2020 & 2034
Table 49: Middle East & Africa Medical Spa Management Software Market Report Revenue Million Forecast, by Organization Size 2020 & 2034
Table 50: Middle East & Africa Medical Spa Management Software Market Report Revenue Million Forecast, by Application 2020 & 2034
Table 51: Middle East & Africa Medical Spa Management Software Market Report Revenue Million Forecast, by End User 2020 & 2034
Table 52: Middle East & Africa Medical Spa Management Software Market Report Revenue Million Forecast, by Pricing Model 2020 & 2034
Table 53: Middle East & Africa Medical Spa Management Software Market Report Revenue Million Forecast, by Country 2020 & 2034
Table 54: UAE Medical Spa Management Software Market Report Revenue (Million) Forecast, by Application 2020 & 2034
Table 55: South Africa Medical Spa Management Software Market Report Revenue (Million) Forecast, by Application 2020 & 2034